








 AI & Machine Learning Infrastructure
See Every GPU Cycle, Catch Every Anomaly, Control Every Cost
Monitor AI training clusters, inference APIs, and ML workloads with per-second precision. Netdata delivers real-time visibility into GPU utilization, resource bottlenecks, and infrastructure health - without the complexity or cost explosion of traditional monitoring.


Built for AI Infrastructure Teams
From training clusters to inference APIs
Per-Second GPU Visibility
Monitor NVIDIA and Intel GPUs in real-time. Catch thermal throttling, memory leaks, and utilization drops instantly - not minutes later.

Sub-2-Second Alerting
Detect inference latency spikes, training stalls, and resource exhaustion before they cascade. 80% faster MTTR than traditional monitoring.
90% Lower Monitoring Costs
Predictable per-node pricing with no metric cardinality charges. Add GPUs, containers, and custom metrics without per-metric surprise bills.
ML-Powered Anomaly Detection
18 unsupervised models per metric train automatically. 99% false positive reduction - surface anomalies that matter.
60-Second Deployment
One-line install, zero configuration. Auto-discover GPUs, containers, and Kubernetes workloads. Dashboards and alerts active immediately.

Kubernetes-Native
Monitor pods, containers, nodes, and autoscaling in real-time. Track ephemeral training jobs without losing visibility.
Trusted by AI teams worldwide







































Real-Time Infrastructure Intelligence
Catch Training Failures Before They Cascade
10-60× faster than traditional monitoring
Explore GPU Monitoring

Optimize Inference APIs Without Guesswork
80% MTTR reduction
Learn About Alerting


Scale Kubernetes ML Workloads Confidently
Zero configuration required
View Kubernetes Integration


Control Costs Without Sacrificing Visibility
Predictable per-node pricing
Compare Pricing



Why AI Teams Choose Netdata
Built for AI Infrastructure, Not Adapted From APM
Traditional monitoring tools were designed for web applications, then retrofitted for AI workloads. Netdata was built from the ground up for infrastructure observability - delivering superior performance, simplicity, and cost efficiency.
Capability
Netdata
Traditional Monitoring
Data Granularity
✅ Per-Second
Catch 2-10 second transient issues
⚠️ Per-Minute
Miss 90% of incidents
Alert Latency
✅ Sub-2-Seconds
Real-time incident detection
⚠️ 30-90 Seconds
Delayed response
GPU Monitoring
✅ Native Support
NVIDIA, Intel auto-discovered
⚠️ Manual Setup
Requires exporters
ML Anomaly Detection
✅ Built-In
18 models per metric, 99% FP reduction
⚠️ Optional Add-On
Requires configuration
Deployment Time
✅ 60 Seconds
One-line install, zero config
❌ Days to Weeks
Complex setup
Pricing Model
✅ Per-Node
Predictable, no metrics volume charges
❌ Volume-Based
Unpredictable, exponential scaling
Anomaly False Positives
✅ <1%
ML consensus reduces noise
⚠️ High
Manual tuning required
Query Languages
✅ None Required
Point-and-click analysis
❌ PromQL/SQL
Steep learning curve
Data Sovereignty
✅ On-Premises
Metrics, logs, and traces stay local
⚠️ Cloud-Only
Vendor-controlled
Kubernetes Support
✅ Native
Helm chart, auto-discovery
⚠️ Manual
Requires configuration
Observability for Every AI Workload
Optimize GPU Training at Scale
Monitor 100+ GPUs in real-time with per-second granularity. Catch thermal throttling, memory leaks, and utilization drops before they impact training runs.
Native NVIDIA & Intel GPU support
Explore GPU Monitoring


Why AI Teams Trust Netdata
Built for infrastructure observability, proven at scale

True Real-Time Monitoring
Per-second data collection with sub-2-second latency. Catch transient issues invisible to minute-averaged tools.
ML-Powered Intelligence
18 unsupervised models per metric train automatically. 99% false positive reduction - surface anomalies that matter.

Instant Deployment
One-line install, zero configuration. Auto-discover GPUs, containers, Kubernetes. Dashboards active in 60 seconds.

Predictable Costs
Per-node pricing with P90 billing. No metric cardinality charges. 90% lower TCO than volume-based platforms.

Data Sovereignty
Metrics, logs, and traces stay on your infrastructure. SOC 2 Type 2 certified. GDPR, HIPAA, PCI DSS aligned.

Zero Learning Curve
No query languages required. Point-and-click analysis. Universal interface across all infrastructure.

October 3, 2026
Who Built This Dashboard, and Are They Still Here?
Your server monitoring dashboard shouldn't be a DIY project. Netdata charts every metric automatically — no query languages, no dashboards to build, ever.

September 8, 2026
Infrastructure Knowledge For AI Root Cause Analysis
Netdata AI now learns your infrastructure the way a new SRE would: a shared context document your team writes, and a memory layer built from conversations that gets more accurate every time you use it.
August 3, 2026
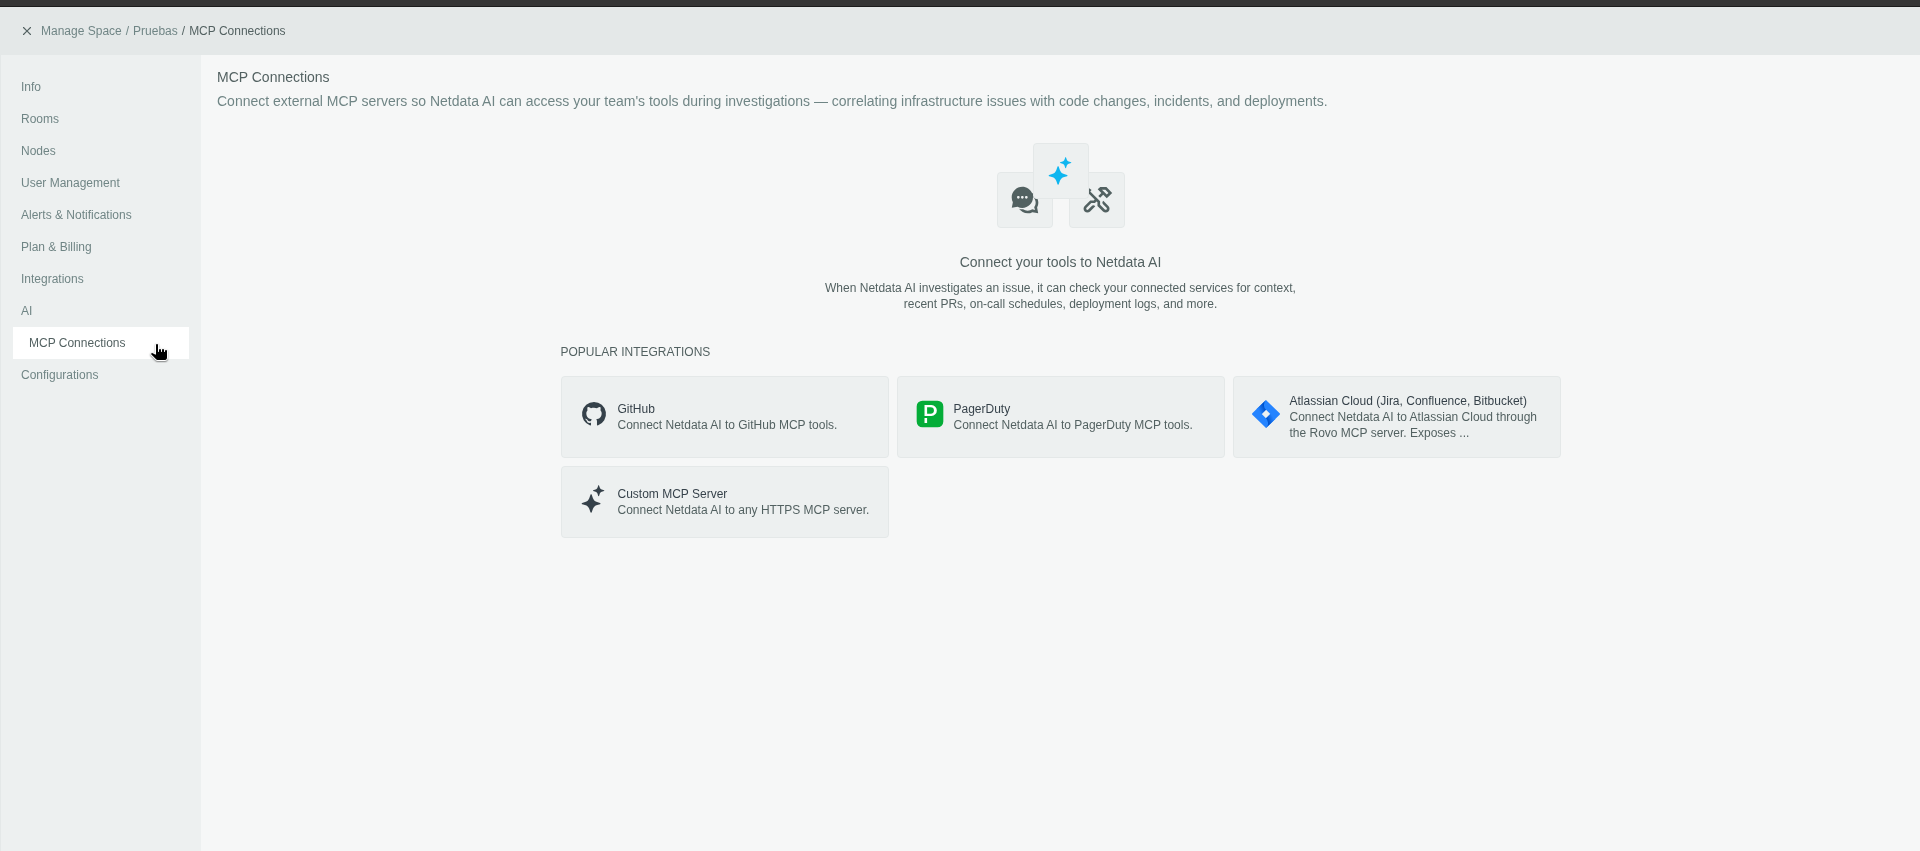
MCP Connections For Observability: AI As MCP Client
Netdata AI can now connect outward to GitHub, PagerDuty, Atlassian, and custom MCP servers via the Model Context Protocol, pulling in the context that explains why an alert fired, not just what changed.