


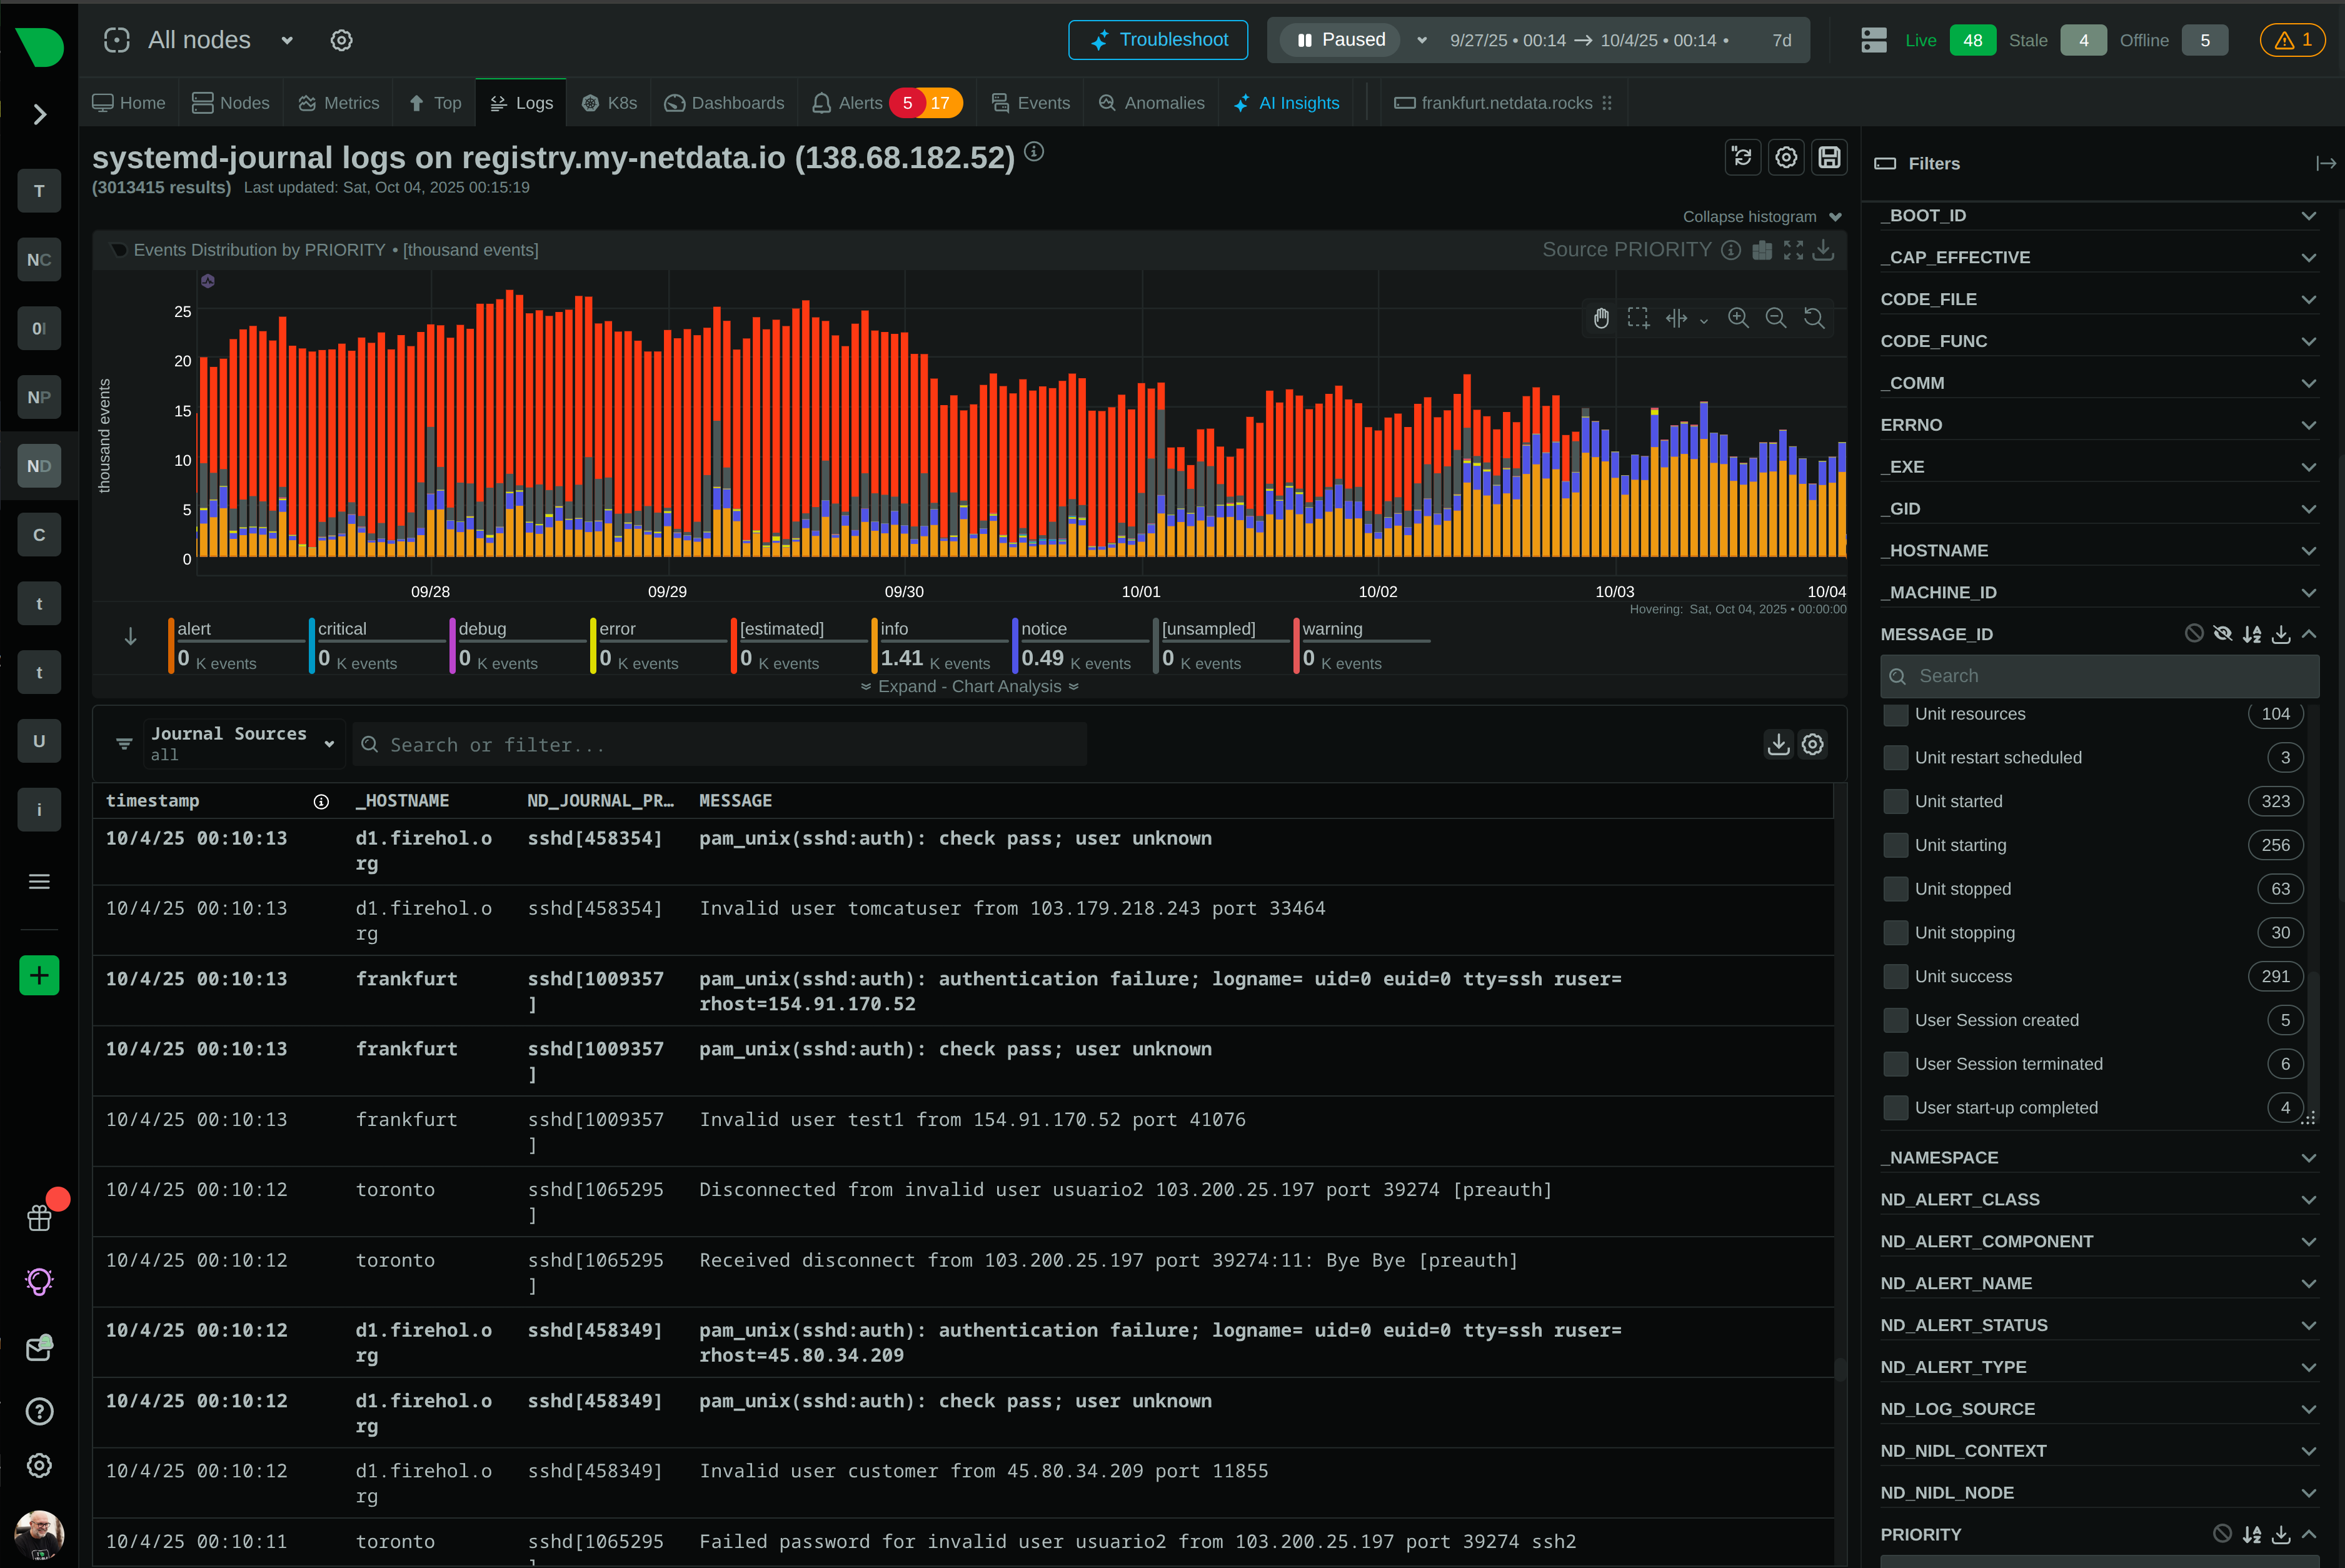
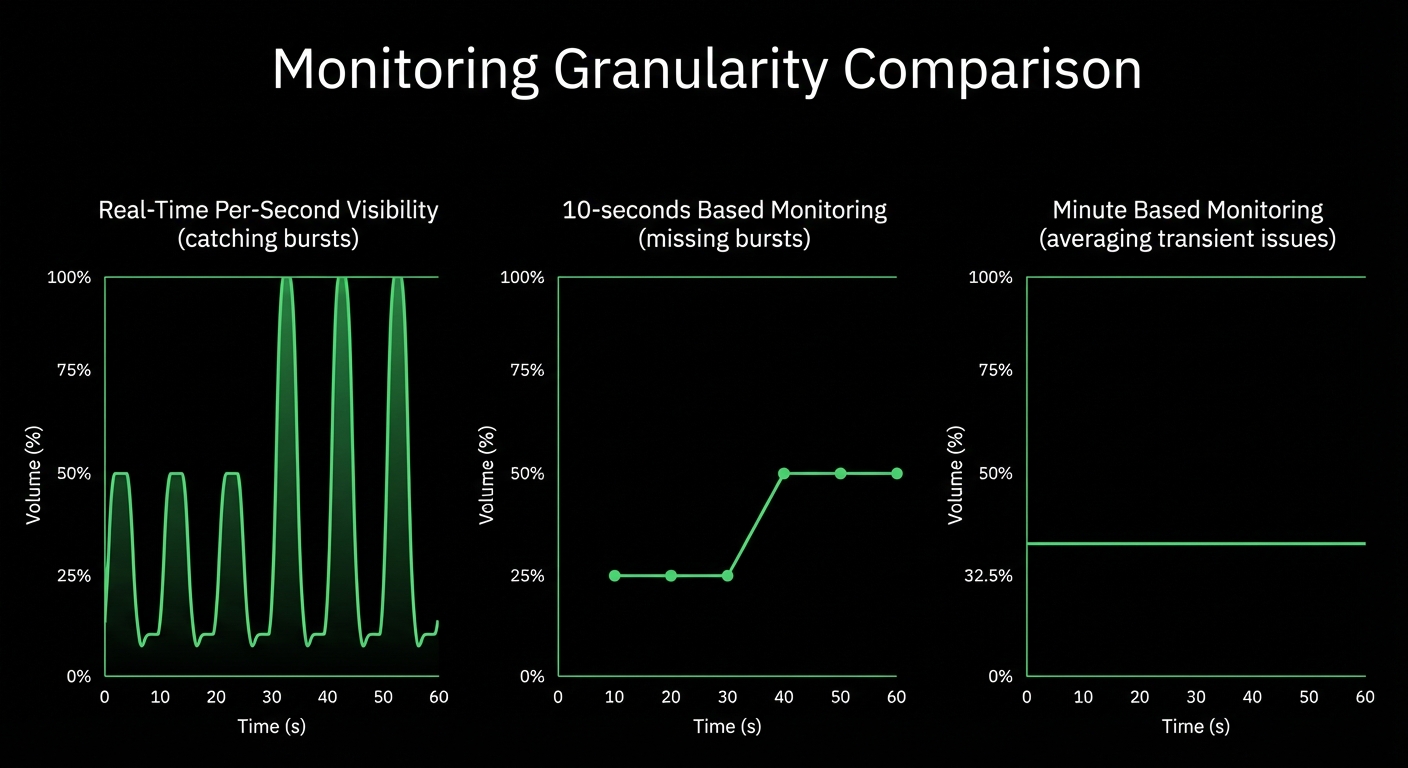
Query Logs Where They Live
Eliminate traditional log pipelines entirely. Netdata’s edge-first architecture queries logs directly from native system formats - no shipping, parsing, or indexing required. Achieve 90% cost reduction with sub-2-second latency at any scale.

Transform Log Management Through Edge Intelligence
Six breakthrough capabilities that redefine what’s possible
Slash Costs by 90%
Flat per-node pricing replaces unpredictable per-GB charges. Keep 100% of your logs without budget anxiety or forced sampling.
Sub-2-Second Latency
Query logs instantly where they live. Direct file access with OS caching delivers console-quality speed without pipeline delays.
Zero Infrastructure Overhead
Leverage systemd-journal and Windows Event Log already running on every system. No clusters to manage, no indexes to maintain.
Unified Metrics and Logs
Logs appear alongside metrics for the same timeframe. Automatic correlation eliminates manual timestamp matching and context switching.
Infinite Horizontal Scale
Each agent operates independently. Adding 1,000 nodes doesn’t affect existing performance - proven at 100,000+ node deployments.
Complete Data Sovereignty
All logs stay on your infrastructure. Zero data egress, native access control, and Forward Secure Sealing for tamper detection.
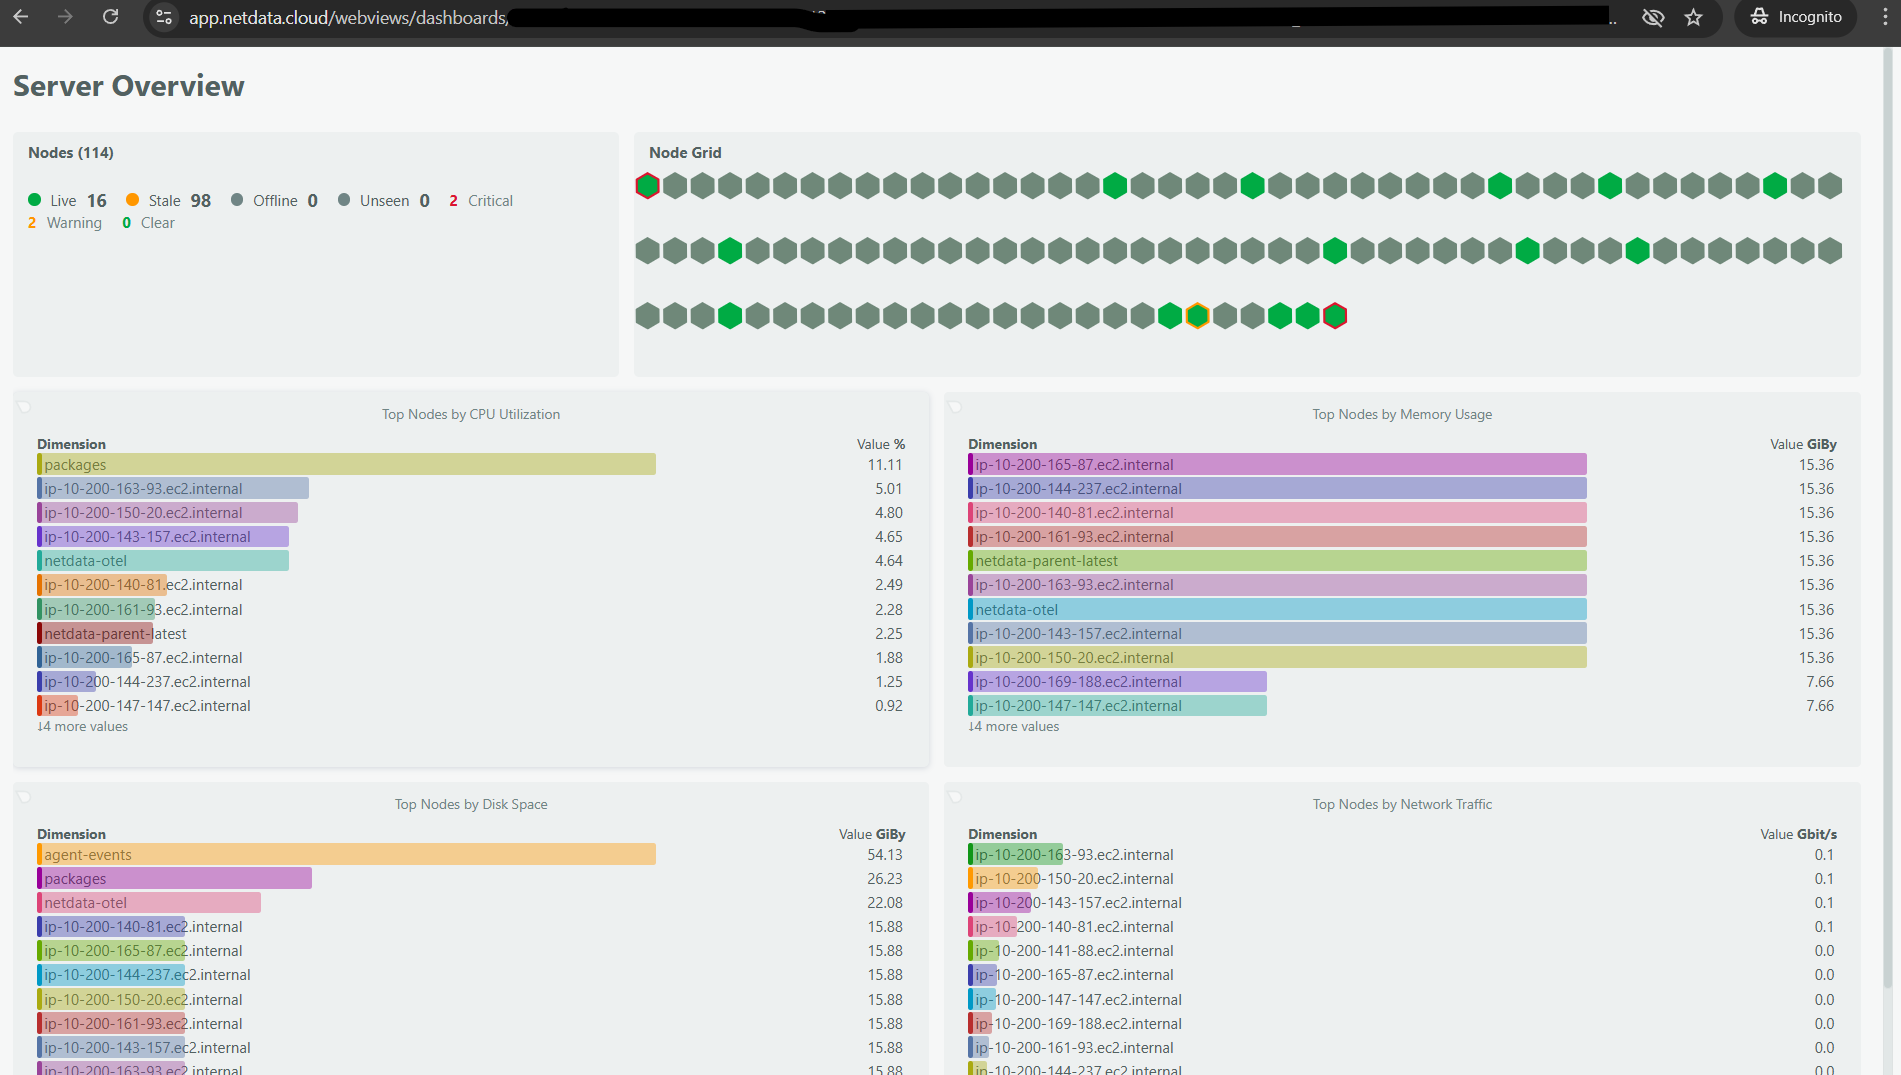
Trusted by operations teams worldwide


Experience Immediate Operational Excellence
Deploy in 60 Seconds, Gain Instant Visibility
60 seconds from install to full log visibility
View Installation Guide
Troubleshoot Faster with Unified Context
80% reduction in MTTR through automatic correlation
Explore Troubleshooting Features
Scale Without Architectural Changes
Proven at 100,000+ node scale with consistent performance
Learn About Scalability
Maintain Complete Data Control
Zero data egress - 100% data sovereignty
Review Security Design

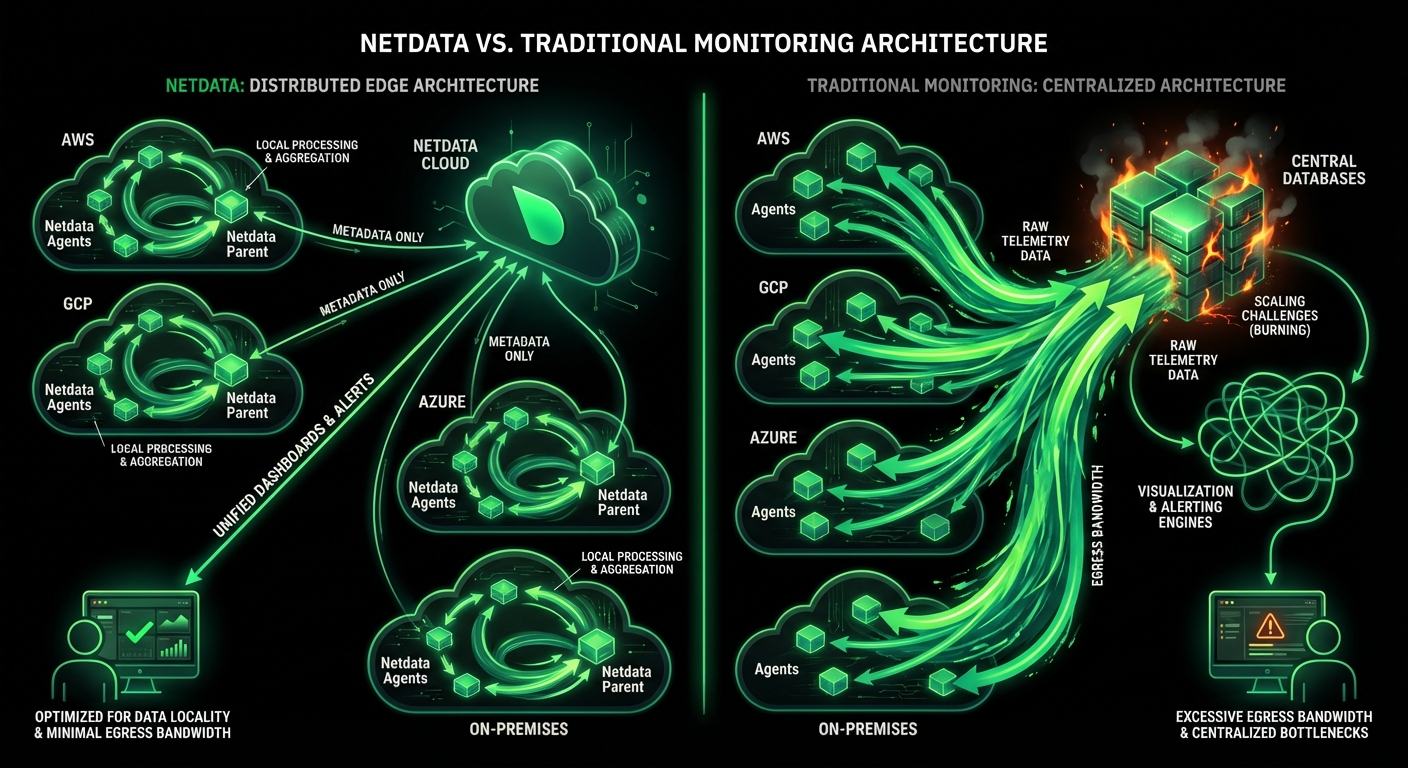
Architecture Comparison
Zero Pipeline vs Traditional Centralized Approaches
Fundamental architectural differences that deliver superior economics and performance
Capability
Netdata Zero Pipeline
Traditional Pipelines
Cost Model
✅ Flat per-node pricing
Unlimited logs, predictable budget
❌ Variable per-GB charges
Unpredictable bills, forced sampling
Query Latency
✅ Sub-2 seconds
Direct file access, OS caching
⚠️ 5-60 seconds
Pipeline processing, network round-trips
Infrastructure Required
✅ Zero additional components
Leverages native system formats
❌ 5+ components to manage
Agents, aggregators, processors, storage, query
Data Movement
✅ None - query in place
Zero egress, instant access
❌ All logs travel centrally
Bandwidth costs, ingestion delays
Storage Efficiency
✅ Native format - no overhead
Native compression, inline indexing
❌ 200-500% overhead
Inverted indexes, replicas, metadata
Scalability Pattern
✅ Horizontal - add agents
Linear cost, no bottlenecks
⚠️ Vertical - bigger clusters
Exponential complexity and cost
Single Point of Failure
✅ None - fully distributed
Each agent operates independently
❌ Central pipeline required
Cluster failure affects all
Time to Value
✅ 60 seconds
Auto-discovery, zero configuration
⚠️ Days to weeks
Pipeline setup, tuning, testing
Operational Burden
✅ Minimal - self-managing
No clusters, no tuning
❌ High - constant attention
Scaling, upgrades, performance tuning
Native Format Mastery Across Platforms
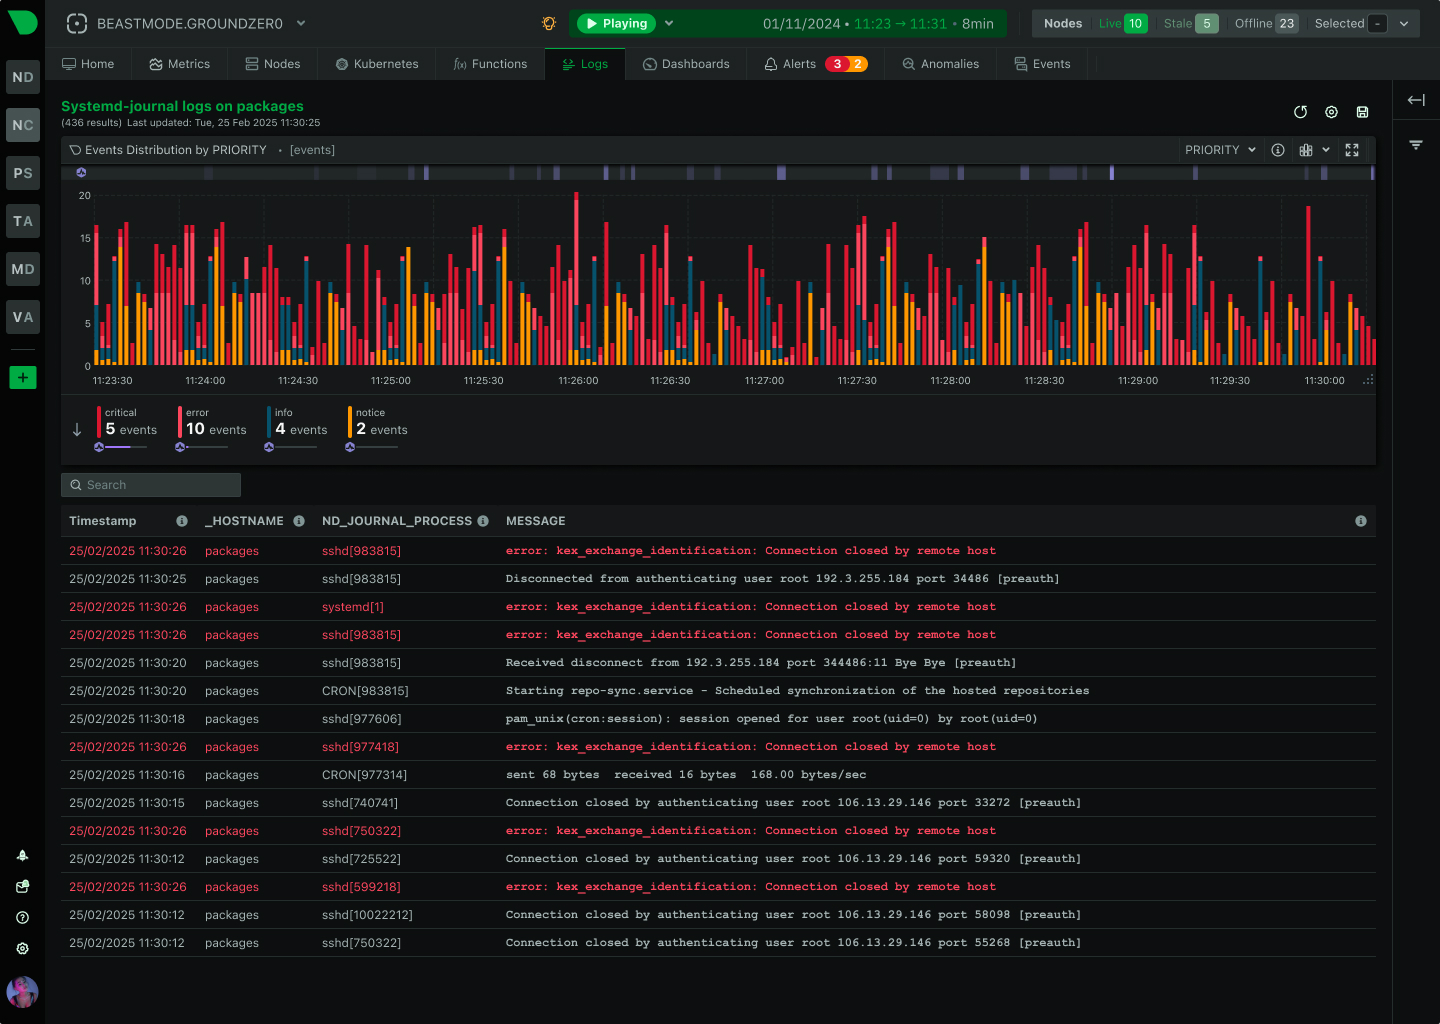
Universal Indexing Without Preprocessing
Every field in every log entry automatically indexed by systemd-journal. Query any field instantly with full-text search, field statistics, and histogram breakdowns. Forward Secure Sealing provides tamper detection for compliance. Native OS caching delivers blazing-fast repeated queries.
200× more accurate field statistics than traditional tools
Explore systemd-journal Integration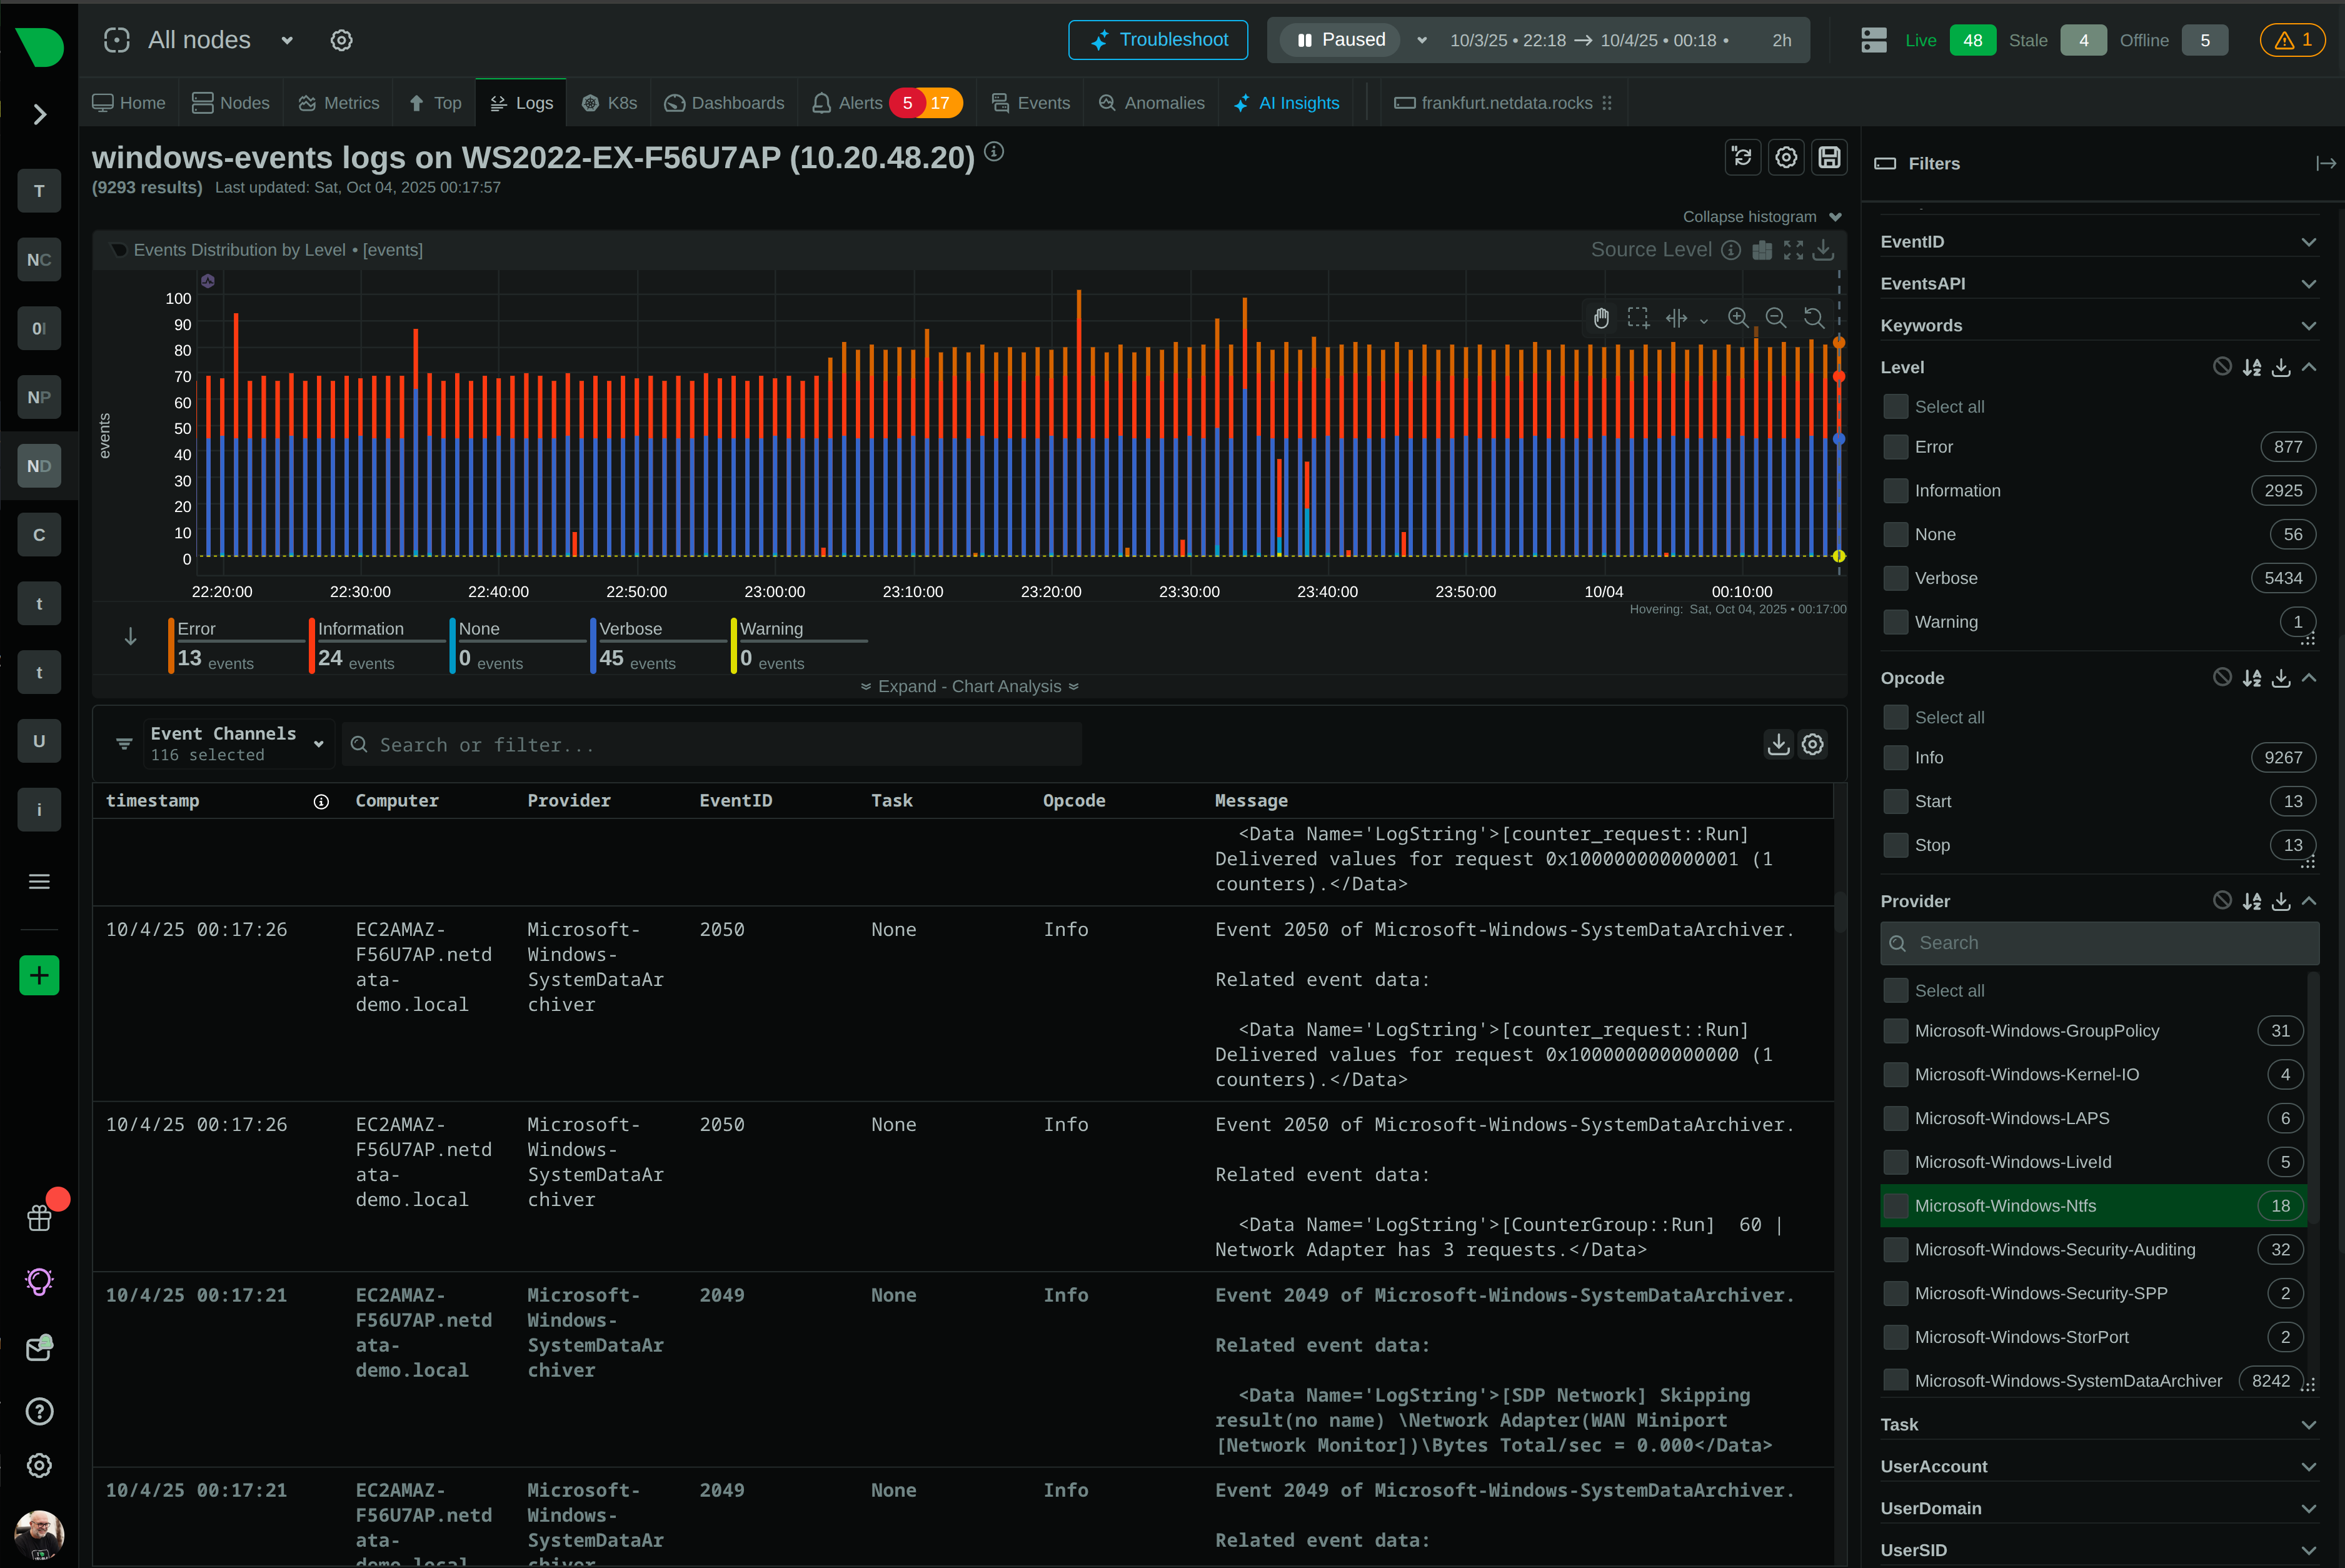
Key Advantages of Zero Pipeline Architecture
Fundamental benefits that transform log management economics and operations
Predictable Economics at Scale
Flat per-node pricing eliminates unpredictable per-GB charges. Keep 100% of logs without forced sampling or budget anxiety. Typical 90% cost reduction versus traditional solutions.
Console-Quality Performance
Sub-2-second query latency through direct file access and OS caching. Real-time ’tail’ mode provides live streaming. No pipeline processing delays or network round-trips.
Zero Infrastructure Burden
Leverage systemd-journal and Windows Event Log already running on every system. No clusters to manage, no indexes to maintain, no components to scale or upgrade.
Automatic Metric Correlation
Logs and metrics from same agent appear in synchronized views. Anomaly Advisor correlates unusual patterns automatically. No manual timestamp matching or tool switching.
Linear Horizontal Scaling
Each agent operates independently. Adding nodes doesn’t create bottlenecks or require architectural changes. Proven at 100,000+ node deployments with consistent performance.
Complete Data Sovereignty
All logs stay on your infrastructure in native formats. Zero data egress, native access control, Forward Secure Sealing for tamper detection. Export anywhere using standard tools.
Instant Discovery and Setup
60 seconds from installation to full log visibility. Automatic discovery of systemd-journal and Windows Event Logs. Zero configuration, no schemas, no pipeline setup required.
200× More Accurate Analysis
Analyzes 1 million log entries before sampling versus 5,000 for traditional tools. Every field automatically indexed. Full-text search across all fields with field statistics and histograms.
Distributed Query Federation
Netdata Cloud federates queries across all agents in parallel. Results aggregate in milliseconds. No central bottleneck or single point of failure. Infinite read scalability.

April 22, 2026
Nagios Plugins Collector: Run Your Existing Checks and Custom Scripts Inside Netdata
Netdata can now execute Nagios-compatible plugins and custom scripts in any language, tracking check states, execution metrics, and automatically charting performance data with built-in alerting.
April 20, 2026
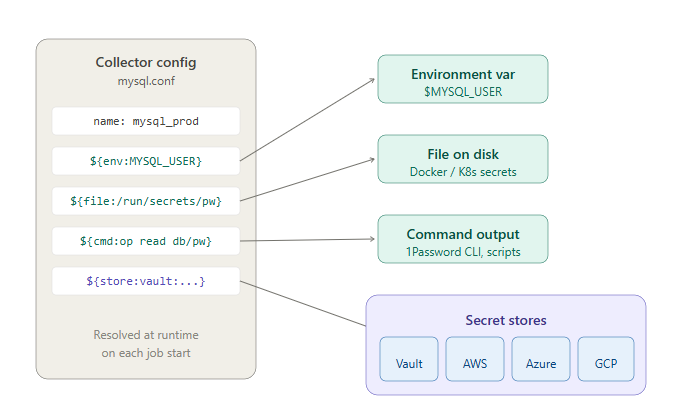
Secrets Management: Get Credentials Out of Your Netdata Configuration Files
Netdata now supports referencing secrets from environment variables, files, commands, and external secret stores like HashiCorp Vault, AWS Secrets Manager, Azure Key Vault, and GCP Secret Manager directly in collector configurations.
April 16, 2026
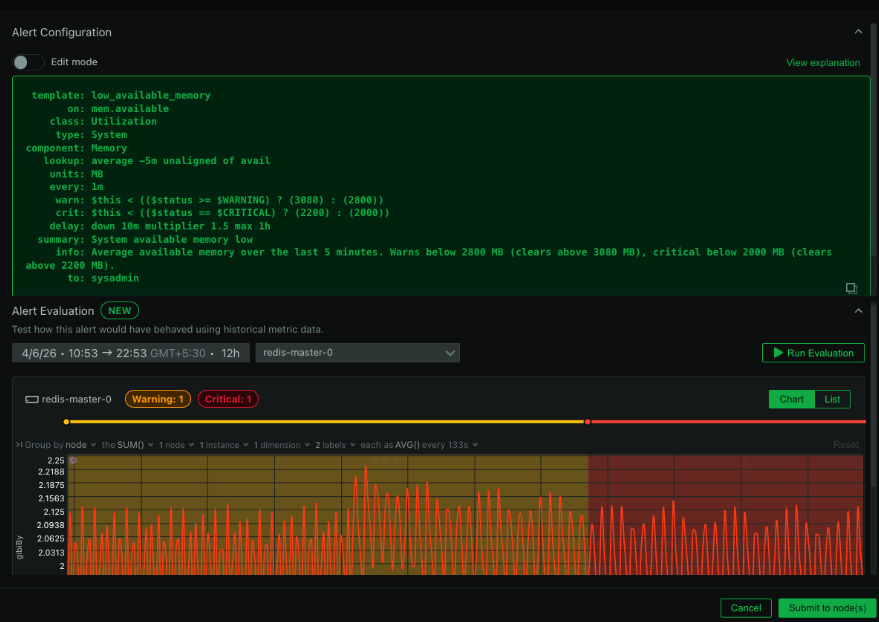
Smarter Alert Management: Test on Historical Data, Review Transitions, and Preview Silencing Schedules
Three new alerting capabilities in Netdata: evaluate alert definitions against historical metrics before deploying, review alert transition timelines, and preview recurring silencing schedules before saving.