









 For Developers
Ship Faster With Infrastructure That Speaks Your Language
Stop losing 23 minutes every time you context-switch to debug production. Netdata brings real-time infrastructure visibility directly into your workflow—with AI that answers questions in plain English, zero configuration overhead, and per-second precision that catches issues before they escalate.


Developer-First Observability
Built for the way you actually work
Instant Feedback Loops
See the impact of your code changes in real-time with per-second metrics and sub-2-second latency—no more waiting for dashboards to refresh.

Zero Query Languages
Point-and-click analysis with NIDL framework—no PromQL, no SQL, no custom DSL. Filter and slice data as naturally as browsing files.
AI That Understands Context
Ask ‘What broke?’ in plain English via AI Chat or IDE integration. Get root cause analysis in seconds, not hours of manual investigation.

Native IDE Integration
Query metrics, logs, traces, and alerts without leaving VS Code, Cursor, or JetBrains. Model Context Protocol brings full observability into your editor.
Deploy in 60 Seconds
One-line install with automatic service discovery. No configuration files, no dashboard building, no threshold tuning—just instant visibility.

Catch What Others Miss
Per-second granularity reveals microbursts, transient spikes, and cascading failures that 30-second monitoring completely misses.
Trusted by developers at innovative companies worldwide








































Eliminate Context Switching Tax
Debug Production Without Leaving Your IDE
23 min saved per switch
Explore IDE Integration


Replace SSH With Browser-Based Debugging
10+ console tools unified
See Console Replacement


Ask Questions in Your Language
80% MTTR reduction
Try AI Troubleshooting

See Every Second That Matters
10-60× faster than competitors
Learn About Real-Time

Instrument Once With OpenTelemetry
One agent for metrics, logs and traces
Explore Distributed Tracing


Developer Experience Comparison
Built for Developers, Not Operations Teams
See how Netdata eliminates the friction that slows down development velocity
Capability
Netdata
Traditional Monitoring
Time to First Dashboard
✅ 60 seconds
One-line install, auto-generated dashboards
⚠️ 2-4 weeks
Manual setup, dashboard building, configuration
Query Language Required
✅ None
Point-and-click NIDL framework
❌ PromQL/SQL/DSL
1-2 weeks learning curve
IDE Integration
✅ Native MCP
VS Code, Cursor, JetBrains, Claude
❌ Not Available
Must leave IDE to investigate
AI Troubleshooting
✅ Natural Language
Ask questions, get instant answers
⚠️ Limited
Generic suggestions, paid add-ons
Data Granularity
✅ Per-Second
Catch transient issues, microbursts
⚠️ 10-60 Seconds
Miss 90% of short-lived problems
Console Tool Replacement
✅ Built-In
top, iostat, netstat in browser
❌ SSH Required
Manual terminal access needed
Alert Configuration
✅ 400+ Pre-Configured
Component-level, adaptive thresholds
⚠️ Manual Setup
1-2 weeks threshold tuning
Cost Model
✅ Predictable per node
Per-node pricing, no per-metric charges
❌ Volume-based charges
Custom metrics fees, per-seat costs
Developer Workflow Integration
Code and Monitor in One Place
Model Context Protocol brings full observability into VS Code, Cursor, JetBrains, and Claude Code. Connect to Netdata Cloud MCP for infrastructure-wide access or directly to Agent/Parent MCP for local access. Query metrics, investigate alerts, analyze logs, and look into traces without breaking flow state.
Zero context switching
Explore MCP Integration

Why Developers Choose Netdata
Built for the way developers actually work

Reclaim 2 Hours Daily
Eliminate context switching between IDE, dashboards, logs, and SSH. Unified interface with IDE integration saves 23 minutes per switch—typically 4-5 switches per day.
Junior Engineers Get Senior Visibility
ML-based anomaly detection and AI troubleshooting democratize expertise. No need to know what’s ’normal’—Netdata’s 18 models per metric learn your infrastructure automatically.

Catch Issues Before Escalation
Per-second monitoring reveals transient problems that 30-second tools miss entirely. See microbursts, cascading failures, and brief spikes that impact user experience.

Ask Questions in Plain English
No PromQL, no SQL, no custom query languages. AI Chat understands natural language questions and provides instant answers with supporting data and recommendations.

Ship Faster With Confidence
Real-time feedback loops enable rapid iteration. Deploy changes, see immediate impact, iterate—all within seconds. No more waiting for dashboards to refresh or metrics to aggregate.

Predictable Developer-Friendly Pricing
Predictable per-node pricing for infrastructure monitoring, with no charges for metrics volume, Logs Monitoring (querying logs in place), users, data retention or containers and no surprise bills from custom metrics or high cardinality.

August 17, 2026
Chart Annotations For Deploys, Incidents & Changes
Netdata Cloud now lets you pin notes to a specific moment on a chart — deployments, incidents, config changes, maintenance windows — shared across your whole Space and one click away from a root-cause correlation.

February 3, 2026
Howard Conference & Expo 2026: Smarter Observability
Meet Netdata at the Howard Conference & Expo 2026 in Fairhope to see how real-time observability beats traditional monitoring. Book a meeting now!
December 23, 2025
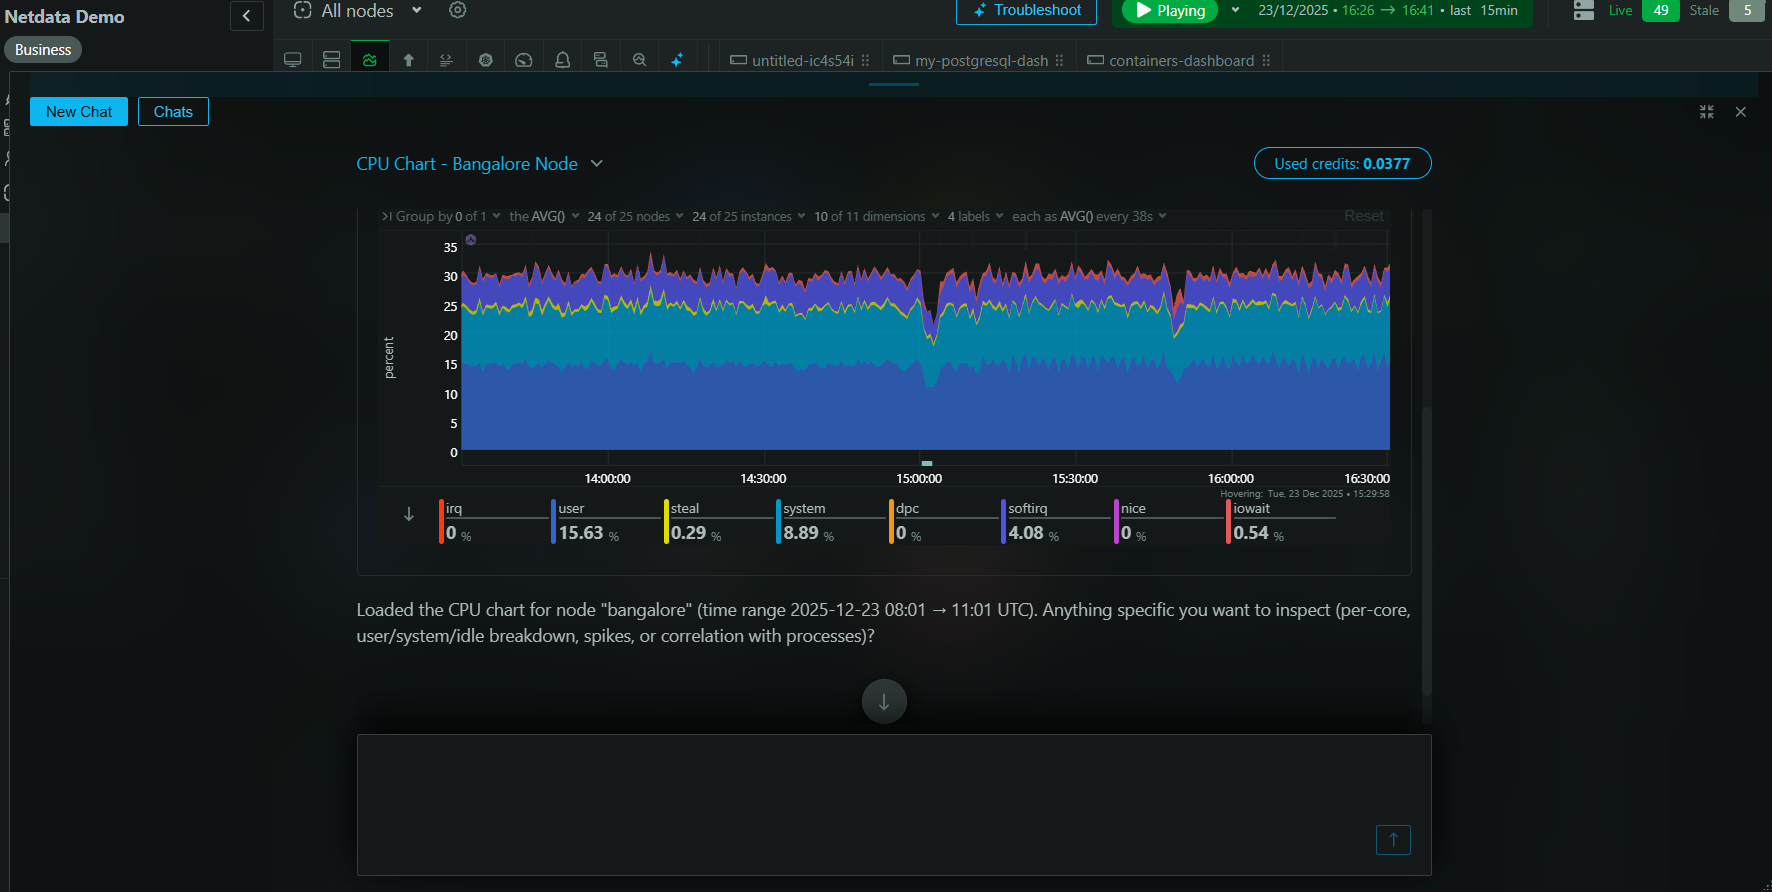
Introducing Real-Time Conversations with Netdata AI
Engage in live, interactive dialogue with your infrastructure using Netdata AI, generating charts, logs, and visualizations on the fly. Try it today!