










 GCP Monitoring & Observability
See Every Second of Your GCP Infrastructure
While others sample at 10-60 second intervals, Netdata captures every metric every second - revealing the microbursts, transient spikes, and cascading failures that traditional monitoring completely misses. Get complete GCP visibility with 90% lower costs and zero configuration.


Why GCP Teams Choose Netdata
The observability platform built for modern cloud infrastructure
True Real-Time Visibility
Per-second metrics with sub-2-second latency reveal issues 10-60× faster than traditional monitoring - catch problems before they cascade.
Predictable Per-Node Pricing
Flat per-node pricing with P90 billing protection. No surprise bills from metrics volume or container counts, and no charges for Logs Monitoring (querying logs in place) - 90% cost reduction vs alternatives.
ML-Powered Anomaly Detection
18 unsupervised models per metric achieve 99% false positive reduction in anomaly detection. Anomaly Advisor surfaces root cause in top 30-50 results.
60-Second Deployment
Zero configuration required. Auto-discovers GCE, GKE, Cloud Run, Cloud Functions, Cloud SQL - complete dashboards and alerts work instantly.
No Per-Metric Charges
Collect 3,000-20,000 metrics/second per node with no charges for metrics volume, Logs Monitoring (querying logs in place), users, data retention or containers. Direct systemd-journal access eliminates log pipelines - 200× query accuracy.

Multi-Cloud Excellence
Same agent works identically on GCP, AWS, Azure, and on-premises. Unified dashboards across all clouds without platform-specific configuration.
Trusted by DevOps teams worldwide








































Transform Your GCP Monitoring Experience
Eliminate Cost Unpredictability
90% Cost Reduction
See Pricing Details


Catch Issues Before They Cascade
10-60× Faster Detection
Learn About Real-Time Monitoring


Precision Anomaly Detection
99% False Positive Reduction
Explore ML Anomaly Detection


Deploy in 60 Seconds
Zero Configuration
View Installation Guide


Kubernetes Without Complexity
No per-pod charges
Kubernetes Monitoring Guide


Logs Without Pipelines
90% Log Cost Reduction
Discover Zero-Pipeline Logs


How Netdata Compares
Netdata vs Traditional GCP Monitoring
See why organizations achieve 90% cost savings and 80% faster MTTR with Netdata’s edge-native architecture.
Capability
Netdata
Traditional Monitoring
Data Granularity
✅ Per-Second
Captures every metric every second
⚠️ 10-60 Seconds
Misses transient issues and microbursts
Time to Value
✅ 60 Seconds
One-line install, auto-discovery, instant dashboards
⚠️ Days to Weeks
Manual configuration, dashboard building, training
Pricing Model
✅ Predictable Per-Node
Flat rate, P90 billing, no metrics volume charges
❌ Complex Volume-Based
Surprise bills, per-metric fees, unpredictable
ML Anomaly False Positives
✅ <1%
18 ML models per metric, consensus-based
⚠️ Higher Rates
Traditional thresholds, less precision
MTTR
✅ 80% Faster
Anomaly Advisor, AI troubleshooting, root cause in top 30-50
⚠️ Manual Investigation
Scattered tools, no ML, longer resolution
Resource Overhead
✅ <5% CPU, 150-200MB RAM
Most energy-efficient (UofA study)
⚠️ Higher Overhead
Significant performance impact
Kubernetes Pricing
✅ Billed Per Node
No per-container (per-pod) charges
❌ Per-Container Charges
Costs explode with container count
Log Management
✅ Advanced
OS logs in place + any source via OpenTelemetry, 90% cost reduction
❌ Expensive Pipelines
Shipping, indexing, ingestion fees
Multi-Cloud Support
✅ Identical Everywhere
Same agent on GCP, AWS, Azure, on-prem
⚠️ Platform-Specific
Different tools per cloud, manual correlation
Data Sovereignty
✅ Edge Storage
Metrics, logs and traces stay on your infrastructure
❌ Cloud Centralized
Data egress, compliance concerns
Configuration Required
✅ Zero
Auto-discovery, algorithmic dashboards, pre-configured alerts
❌ Extensive
Manual service definitions, dashboard building, query languages
ML Anomaly Detection
✅ Included
18 models per metric, edge-based, no extra cost
⚠️ Premium Feature
Often requires expensive add-ons
Complete GCP Observability
Complete Compute Engine Visibility
Monitor every GCE instance with per-second metrics for CPU, memory, disk, network, and processes. Auto-discovery detects all instances instantly - no manual configuration required.
Per-second metrics, zero configuration
View GCE Monitoring


Key Benefits for GCP Teams
Why organizations choose Netdata for GCP monitoring

Predictable Costs
Flat per-node pricing with P90 billing protection. No surprise bills from metrics volume or container counts, and no charges for Logs Monitoring (querying logs in place) - 90% cost reduction vs alternatives.

True Real-Time
Per-second metrics with sub-2-second latency reveal issues 10-60× faster than traditional monitoring. Catch microbursts and transient spikes others miss completely.

ML-Powered Detection
18 unsupervised models per metric achieve 99% false positive reduction in anomaly detection. Anomaly Advisor surfaces root cause in top 30-50 results.

Instant Deployment
Zero configuration required. Auto-discovers GCE, GKE, Cloud Run, Cloud Functions, Cloud SQL - complete dashboards and alerts work in 60 seconds.

Unlimited Scale
Collect 3,000-20,000 metrics/second per node with no charges for metrics volume. Distributed architecture scales linearly - no central bottlenecks.

Data Sovereignty
All metrics, logs and traces stay on your GCP infrastructure. SOC 2 Type 2 certified, GDPR and HIPAA aligned. An air-gapped deployment option is available for metrics and logs monitoring.
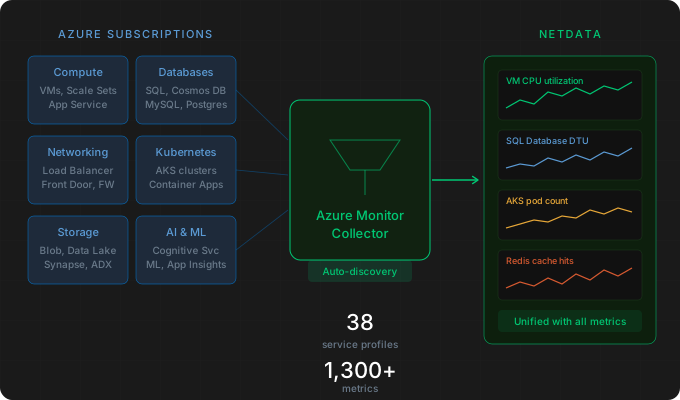
April 27, 2026
Azure Monitor Collector: Monitor Azure Infrastructure
Meet Netdata's Azure Monitor collector: automatic resource discovery, 38 service profiles, and 1,300+ metrics across subscriptions. Read the guide now!
February 3, 2026
Tech Show London 2026: Cloud & AI Observability Recap
Meet Netdata at Tech Show London 2026, ExCeL London, in the Cloud & AI zone to see intelligent, real-time observability in action. Book a meeting now!
May 16, 2023
Monitoring Multi-Cloud & Hybrid-Cloud Infrastructures
Discover the challenges & best practices for monitoring multi-cloud & hybrid-cloud environments. Achieve real-time insights & optimal performance with Netdata.