









 Troubleshooting Reimagined
Resolve Issues 80% Faster with Real-Time Intelligence
Stop wasting hours jumping between dashboards. Netdata delivers per-second visibility, ML-powered anomaly detection, and AI-guided root cause analysis - all in one unified platform with zero configuration.


Why Teams Choose Netdata for Troubleshooting
The fastest path from alert to resolution

See Problems Instantly
Per-second metrics capture transient issues invisible to 30-second monitoring. No more blind spots during critical incidents.

AI Finds Root Causes
Anomaly Advisor ranks thousands of metrics, surfacing the top 30-50 most relevant. AI Chat explains what broke and why in plain English.
Detect Anomalies Automatically
18 ML models per metric with 99% false positive reduction. Catch issues before they cascade into outages.
Troubleshoot Without Queries
Point-and-click analysis replaces PromQL. Slice any dataset by node, instance, dimension, or label - no specialized skills required.
Predictable Costs at Scale
Predictable per-node pricing for infrastructure monitoring, with no charges for metrics volume, Logs Monitoring (querying logs in place), users, data retention or containers. 90% cost reduction versus volume-based platforms.
Deploy in 60 Seconds
Zero configuration required. 800+ integrations auto-discovered, dashboards auto-generated, ML training automatic.
Trusted by operations teams worldwide








































Transform Your Troubleshooting Workflow
Catch Issues Before They Escalate
80% MTTR Reduction
Learn About Real-Time Monitoring


Get Answers in Minutes, Not Hours
Sub-2-Second Latency
Explore AI Troubleshooting


Unified View Across Your Entire Stack
800+ Integrations
See All Integrations


Scale Without Complexity or Cost Explosions
90% Cost Savings
Understand Edge Architecture



How Netdata Accelerates Troubleshooting
Built for Speed, Accuracy, and Simplicity
Compare Netdata’s troubleshooting capabilities against traditional monitoring approaches
Capability
Netdata
Traditional Monitoring
Data Granularity
✅ Per-Second
Captures 2-10 second anomalies
⚠️ 30-60 Seconds
Misses 90% of transient issues
Time to First Insight
✅ Sub-2 Seconds
Event to visualization latency
⚠️ 30-120 Seconds
Collection plus aggregation delays
Anomaly Detection
✅ Automatic on All Metrics
18 ML models, 99% FP reduction
⚠️ Manual Configuration
Selected metrics only, high false positives
Root Cause Analysis
✅ AI-Powered Correlation
Top 30-50 results contain answer
⚠️ Manual Investigation
Hours of dashboard jumping
Setup Complexity
✅ Zero Configuration
60-second deployment to insights
❌ Days to Weeks
Manual config, dashboard building
Query Language Required
✅ None (Point-and-Click)
NIDL framework, no PromQL
❌ PromQL/SQL Expertise
Months to master, steep learning curve
Context Switching
✅ Single Unified Interface
Metrics, logs, traces, anomalies together
❌ Multiple Tools
Average 4.4 tools, 5+ tabs per incident
Cost Model
✅ Per-Node Pricing
Per-node pricing, no per-metric charges
❌ Volume-Based Charges
Unpredictable, per-metric fees
Data Sovereignty
✅ Edge-Native Storage
All data stays on-premises
⚠️ Centralized Cloud
Data egress costs, compliance risks
Scalability
✅ Linear Scaling
100,000+ nodes proven
⚠️ Exponential Complexity
Central bottlenecks at scale
Troubleshooting Capabilities That Matter
Catch Issues Before They Cascade
18 unsupervised ML models per metric train automatically on your infrastructure's behavior. Consensus-based detection achieves 99% false positive reduction - only alerting when all models agree something is truly wrong.
Theoretical FP Rate: 10^-36
Learn About ML Detection


Key Troubleshooting Benefits
Why operations teams choose Netdata for faster incident resolution
80% Faster MTTR
Per-second visibility and AI-guided analysis reduce mean time to resolution from hours to minutes.

99% Fewer False Positives
Consensus-based ML detection with 18 models per metric delivers highly accurate anomaly identification.

90% Cost Reduction
Predictable per-node pricing with no charges for metrics volume, Logs Monitoring (querying logs in place), users, data retention or containers, versus volume-based platforms.

Zero Learning Curve
Point-and-click analysis replaces query languages. Junior engineers get senior-level insights.

60-Second Deployment
From installation to actionable insights in one minute. Zero configuration required.

Linear Scalability
Proven at 100,000+ nodes. Adding infrastructure doesn’t degrade performance or explode costs.

Data Sovereignty
Metrics, logs and traces stay on your infrastructure. Supports GDPR and HIPAA programs.

Traces in Context
OpenTelemetry traces land on the same agent as your metrics and logs, with a full waterfall for every request in the Netdata Cloud Traces tab.

August 17, 2026
Chart Annotations For Deploys, Incidents & Changes
Netdata Cloud now lets you pin notes to a specific moment on a chart — deployments, incidents, config changes, maintenance windows — shared across your whole Space and one click away from a root-cause correlation.
December 23, 2025
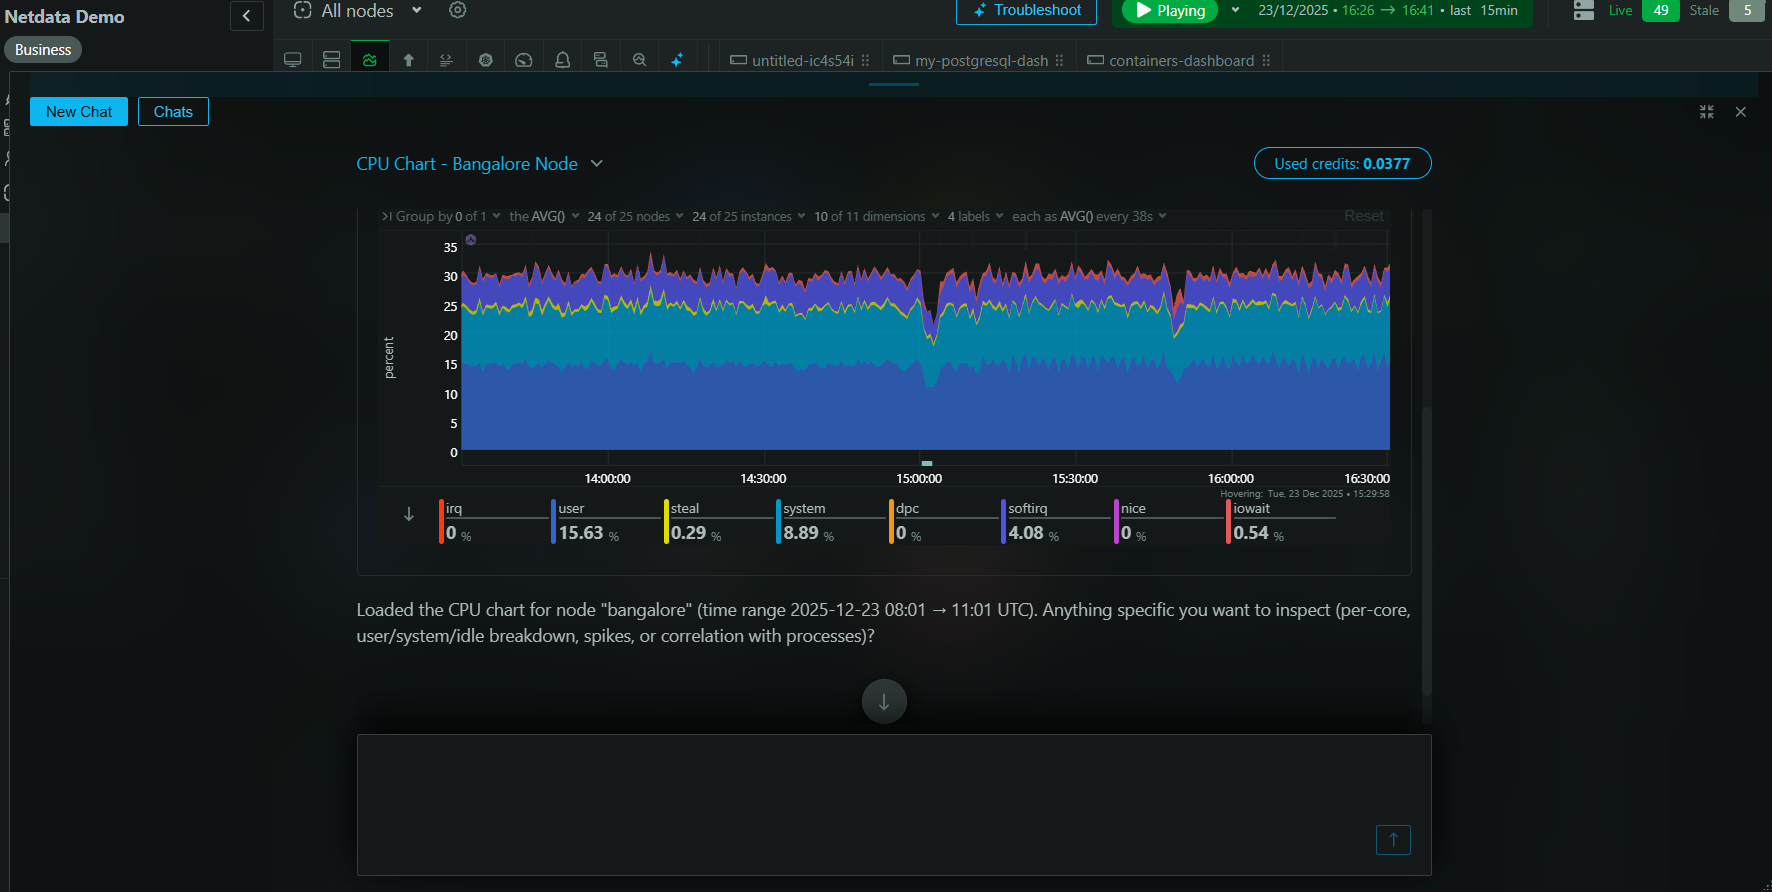
Introducing Real-Time Conversations with Netdata AI
Engage in live, interactive dialogue with your infrastructure using Netdata AI, generating charts, logs, and visualizations on the fly. Try it today!

August 4, 2025
Save Hours on Troubleshooting with Automated Investigations
Ask Netdata Anything, Get an Expert Analysis in Minutes - introducing conversational infrastructure troubleshooting powered by Netdata AI: Your Co-SRE.