










 Network Monitoring
See Network Issues Before They Impact Users
NPM-class network monitoring, unified with your whole stack: monitor SNMP devices and traps, analyze NetFlow/sFlow/IPFIX traffic, and map live topology — all in one real-time Network Monitor dashboard, with per-second data, ML anomaly detection, and zero configuration.


Network Monitoring That Works
Everything you need for comprehensive network visibility

Per-Second Detection
Catch issues invisible to minute-averaged monitoring. 77% of enterprises prioritize real-time capabilities - Netdata delivers sub-2-second latency from event to insight.
ML-Powered Anomaly Detection
18 ML models per metric with consensus detection achieve 99% false positive reduction. Detect real network anomalies with ML-based insights.
NetFlow Traffic Analysis
Analyze NetFlow, sFlow, and IPFIX flow records with traffic maps and top-talker breakdowns. See where bandwidth goes and who’s talking to whom, and spot traffic anomalies - no packet capture required.
Topology & Connection Maps
Visualize live network topology and per-process TCP/UDP connections, plus device topology from SNMP (LLDP/CDP/BGP). Map dependencies and trace how traffic actually flows.
Zero Configuration
Auto-discovers all network interfaces, SNMP devices, and containers. 59% of enterprises plan tool replacement due to complexity - Netdata deploys in 60 seconds.
Hybrid Cloud Visibility
Unified view across on-premises, cloud, and container environments. 61% run hybrid architectures requiring unified visibility - Netdata provides it.
Network Security Insights
Monitor TCP connections, firewall states, and anomaly patterns. Detect encrypted traffic anomalies and connection issues without deep packet inspection.
Predictable Cost Model
Per-node pricing with ML anomaly detection included. 90% cost savings vs. traditional NPM tools. No surprise bills from metrics volume.
Trusted by Network Teams Worldwide








































Topology, Flows, Traps, and Devices - Not Generic Dashboards
Live Network Topology
LLDP / CDP / BGP / OSPF topology
Explore the Topology Viewer

NetFlow Traffic Analysis
NetFlow / sFlow / IPFIX
Explore the NetFlow Analyzer
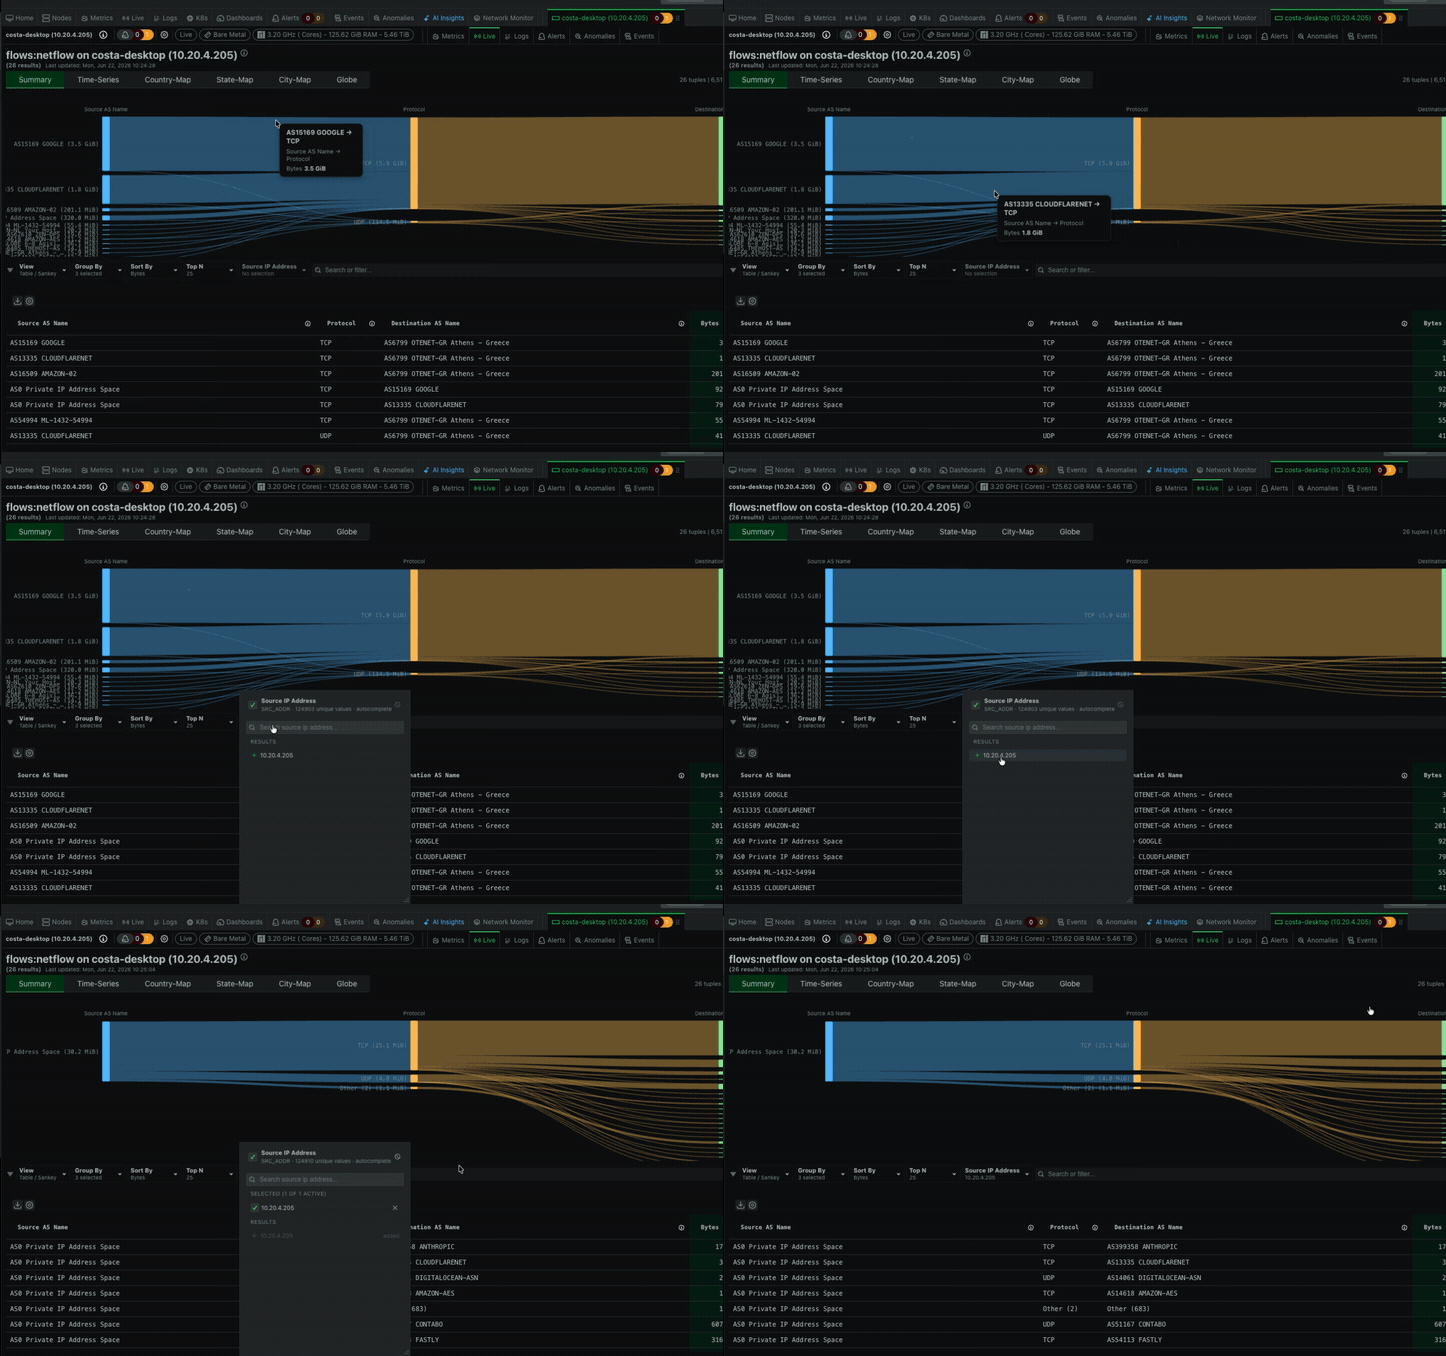
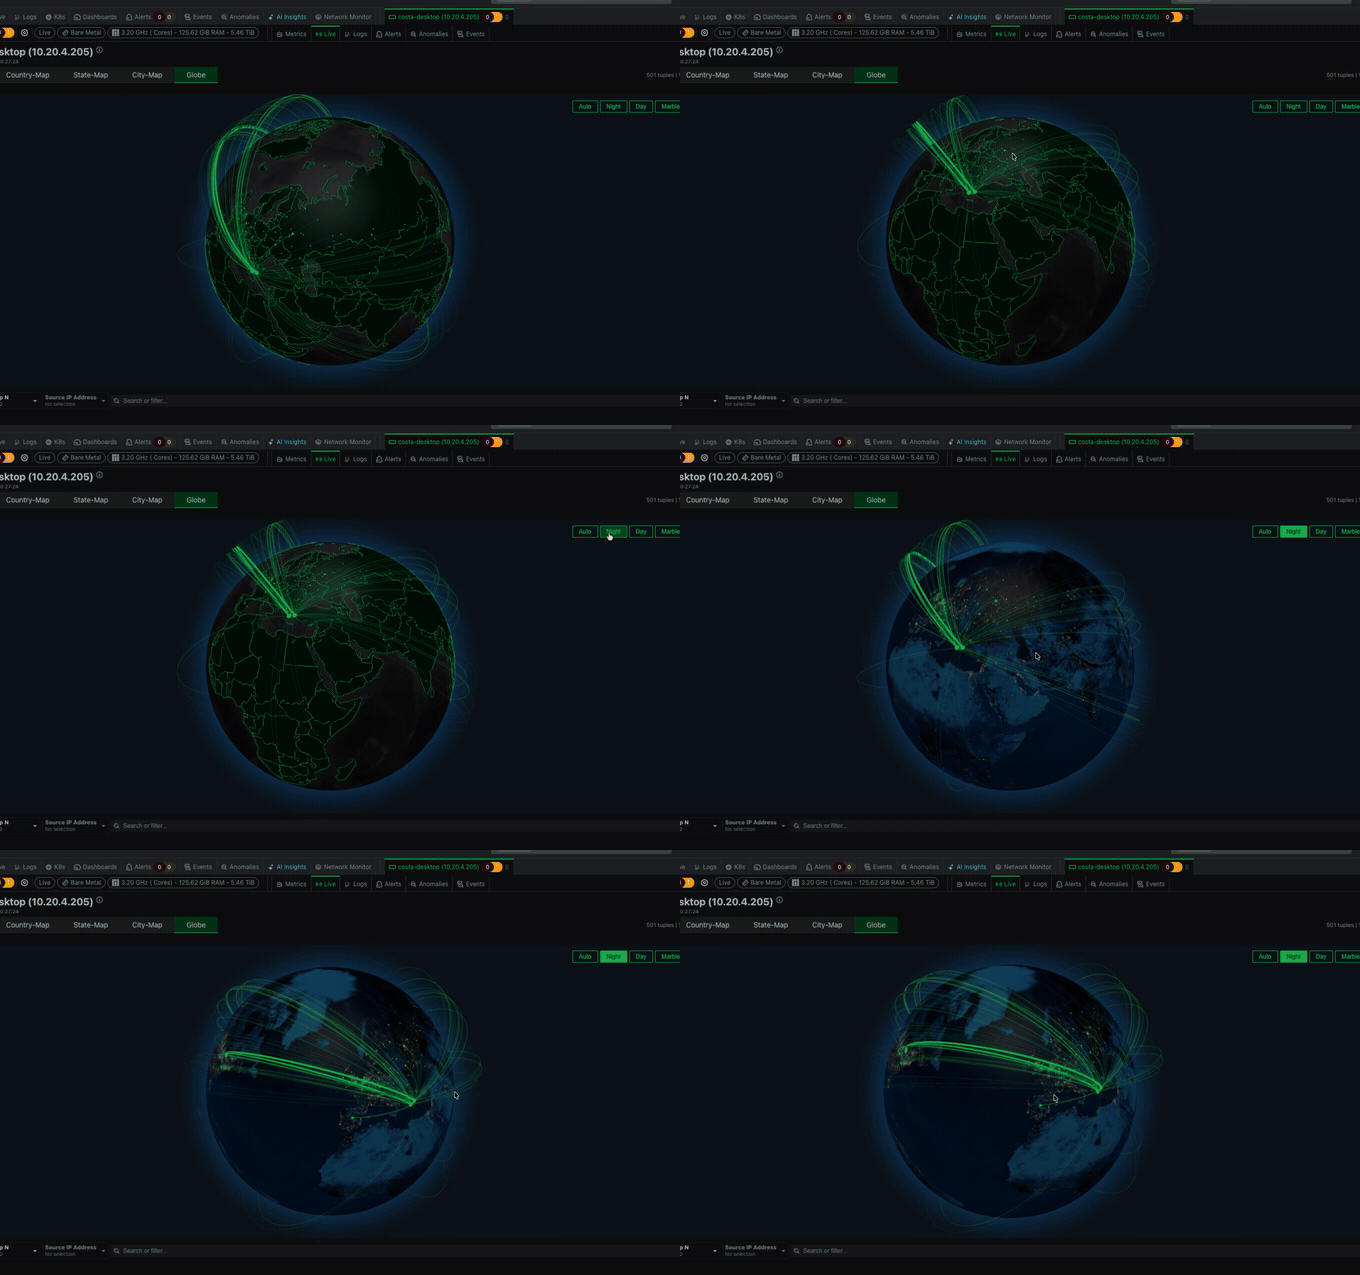
Global Traffic, Mapped
Geo-IP + ASN enrichment
See Flow Visualizations
SNMP Trap Monitoring
150,000+ trap definitions
Explore SNMP Trap Monitoring

SNMP Device Monitoring
100+ vendor profiles
Explore SNMP Device Monitoring


Feature Comparison
Network Monitoring Capabilities
Netdata now delivers NPM-class network monitoring — SNMP devices and traps, NetFlow/sFlow/IPFIX flow analysis, and live topology — with the real-time data, ML, and unified full-stack visibility traditional NPM tools lack.
Capability
Netdata
Traditional NPM
Real-Time Collection
Data granularity
✅ Native
Per-second capable; SNMP limited by device response
⚠️ Limited
10-60 second intervals typical
ML Anomaly Detection
AI-powered insights
✅ Native
18 models per metric, consensus detection
⚠️ Add-on
Premium tiers or third-party required
Auto-Discovery
Zero configuration
✅ Native
Multi-layer discovery framework
⚠️ Manual
Device-by-device setup required
SNMPv3 Support
Secure protocol
✅ Native
100+ vendor profiles, USM/VACM, traps
✅ Native
Standard support across vendors
Flow Analysis (NetFlow/sFlow/IPFIX)
Traffic & top talkers
✅ Native
NetFlow, sFlow, IPFIX with flow maps
⚠️ Add-on
Often a separate flow module/license
Topology & Connection Maps
Dependency visualization
✅ Native
Live connections plus LLDP/CDP/BGP
✅ Native
Core NPM strength
Hybrid Cloud Visibility
Multi-environment correlation
✅ Native
Unified view via Netdata Cloud
⚠️ Partial
Gaps in multi-cloud coverage
Cost Model
Predictable pricing
✅ Per-node
No charges for metrics volume
⚠️ Variable
Per-host, per-element, or volume-based
Explore the Network Views
Device & Connection Topology
A live map of switches, routers, and firewalls built from LLDP, CDP, FDB, STP, ARP, OSPF, and BGP, with selectable map confidence, inference strategy, focus, and hop depth. Pair it with the per-process connection map for application-to-device visibility.
Explore the Topology Viewer


Network Monitoring That Works
Key capabilities that make Netdata the choice for modern network teams
Real-Time Collection
Per-second capable at scale; SNMP frequency based on device capacity

ML Anomaly Detection
18 models per metric with 99% false positive reduction

NetFlow Traffic Analysis
NetFlow, sFlow, and IPFIX flow records with traffic maps

Topology & Connections
Live connection maps plus LLDP/CDP/BGP device topology

Zero Configuration
Auto-discovers interfaces, devices, and containers instantly

Hybrid Cloud Support
Unified visibility across on-prem and cloud environments

Security Insights
Monitor TCP states, firewall patterns, and anomalies

Predictable Pricing
Per-node model with ML anomaly detection included
Frequently Asked Questions

June 24, 2026
Real Time Network Monitoring: Topology, NetFlow, SNMP
See Netdata's NPM-class network monitoring: live topology, NetFlow and sFlow analysis, SNMP across 200+ profiles, and trap handling. Read the guide now!
September 26, 2023
Netdata QoS Classes monitoring
Learn how Netdata monitors Linux QoS classes with per-class traffic visibility to understand and troubleshoot network shaping. Read the full guide now!

November 28, 2022
Monitor & Troubleshoot ISP Performance With Netdata
Use Netdata to monitor internet quality & ISP performance. Run speed tests & troubleshoot issues. Visualize metrics like speed, latency & jitter with ease!