













 Docker Monitoring
Finally, Docker Monitoring as Simple as Docker Itself
You chose Docker for simplicity. Your monitoring should match. One command to install. Instantly see CPU, memory, disk, and network for every container - per second. Auto-discovers containers the moment they start. No dashboards to build, no queries to write. ML detects problems before your users notice. 90% cheaper than commercial tools.


Docker Monitoring That Works the Way You Do
See what matters. Fix problems fast. No complexity.

One Command Install
Run one line and you’re monitoring. Every container appears automatically. Dashboards ready instantly. This is how monitoring should work.
See Inside Every Container
Know exactly which container is hogging CPU or leaking memory. Per-container metrics for CPU, memory, disk I/O, and network. Per second.
Catch What Others Miss
Most tools check every 15-60 seconds. Netdata checks every second. See the 5-second CPU spike that crashes your app - before users complain.

ML Finds Problems For You
18 ML models per metric learn what ’normal’ looks like. When something’s off, you know instantly. No threshold tuning required.
Logs Right There
Container logs alongside metrics - no switching tools. Search, filter, correlate. See exactly what happened when that spike occurred.
No Per-Container Billing
Monitor 5 containers or 500 on the same host - same price. No surprise bills when you scale up. 90% cheaper than commercial tools.
Trusted by teams running Docker everywhere








































Docker Monitoring Without the Headaches
Know Which Container is the Problem
Per-container visibility
Learn about container metrics

See Problems as They Happen
1-second granularity
Explore real-time monitoring


Containers Auto-Discovered Instantly
docker compose up and your containers appear in the dashboard. No configuration files, no service registration, no manual steps. Start a new container - it’s monitored. Stop it - it’s gone. Simple as that.Zero configuration
See auto-discovery

Troubleshoot Without SSH
docker exec, no SSH. Historical data too - see what was happening yesterday at 3am.Browser-based debugging
Explore troubleshooting


ML Learns Your Containers
80% faster troubleshooting
Discover ML detection

Logs and Metrics Together
Instant correlation
View logs features



Netdata vs Traditional Docker Monitoring
Why Docker Teams Switch to Netdata
Traditional monitoring tools add complexity Docker was supposed to eliminate. Netdata brings simplicity back.
Capability
Netdata
Traditional Tools
Setup Time
✅ One Command
Monitoring in under 5 minutes
❌ Hours to Days
cAdvisor + Prometheus + Grafana setup
Data Frequency
✅ Every Second
See transient spikes that cause crashes
⚠️ Every 15-60 Seconds
Averages hide critical events
Container Pricing
✅ Billed Per Node
No per-container charges, 5 or 500 containers
❌ Per-Container
Costs explode as you scale
Dashboard Building
✅ Automatic
Ready instantly, no configuration
❌ Manual
Hours building Grafana dashboards
Query Language
✅ None Required
Point and click analysis
❌ PromQL
Steep learning curve
Anomaly Detection
✅ Built-in ML
18 models per metric, works day one
❌ Not Included
Static thresholds or separate tools
Container Logs
✅ Integrated
Metrics and logs in one view
⚠️ Separate Stack
ELK/Loki pipeline needed
Pre-Built Alerts
✅ 400+ Included
Container-specific thresholds
⚠️ Build Your Own
Manual alert configuration
Process Visibility
✅ Inside Containers
See which process causes problems
⚠️ Container-Level Only
Black box monitoring
Resource Overhead
✅ Under 5% CPU
Lightweight single agent
⚠️ Multiple Components
cAdvisor + exporters + agents
Everything You Need for Docker Monitoring
Every Container Metric
CPU usage, throttling events, memory consumption, cache, swap, disk reads/writes, network in/out, packet drops - for every container, every second. Automatic cgroups v1 and v2 support.
Per-second, per-container visibility
Explore metrics


Complete Docker Monitoring
Everything you need to keep your containers running smoothly

Per-Container Visibility
CPU, memory, disk, network for every container individually. Know exactly which one is the problem.

Per-Second Metrics
See transient spikes and issues that 15-60 second monitoring completely misses.

Auto-Discovery
New containers appear in dashboards instantly. No configuration required.

ML Anomaly Detection
18 models per metric learn normal behavior. Real problems surfaced, noise filtered.

Integrated Logs
Container logs alongside metrics. Click a spike, see the logs.

400+ Pre-Built Alerts
Container-specific alerts for CPU, memory, restarts, health checks.

Process Visibility
See inside containers - which process is using resources. No SSH required.

Predictable Pricing
Per-node, not per-container. Scale without surprise bills.

Data Stays Local
All metrics, logs and traces on your infrastructure. No data egress.
May 28, 2024
How to automate adding nodes to rooms in Netdata?
Different scenarios for placing Netdata Agents across rooms using Terraform
September 26, 2023
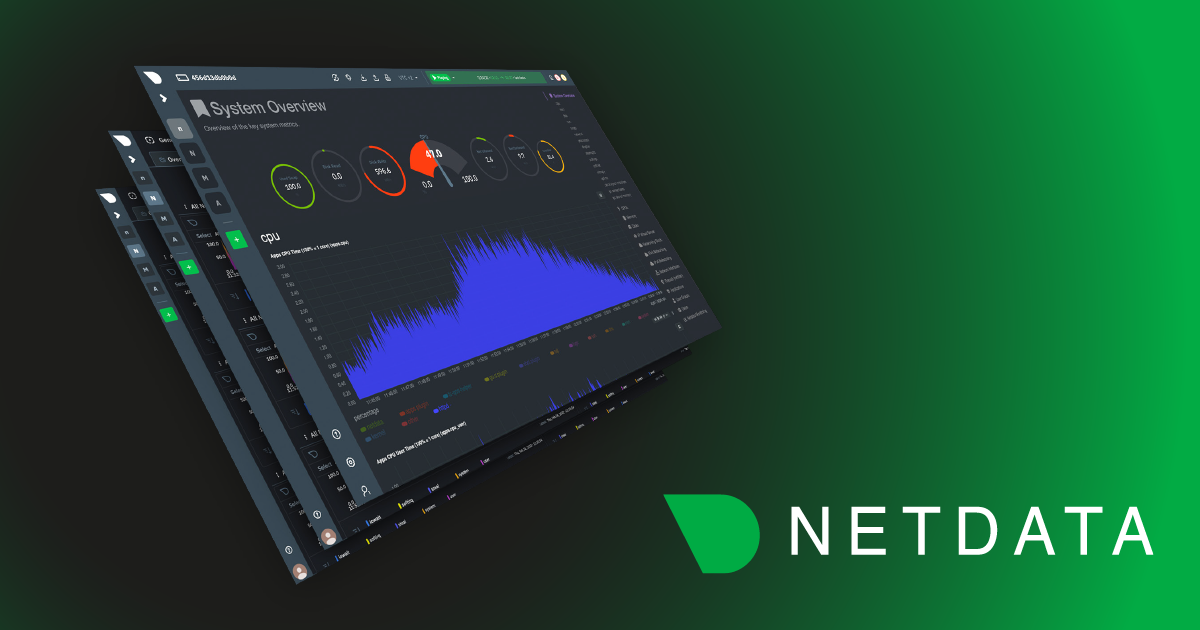
Netdata, Prometheus, Grafana Stack
Learn how to combine Netdata, Prometheus, and Grafana into one powerful monitoring stack for richer metrics and visualization. Read the full guide now!
May 2, 2023
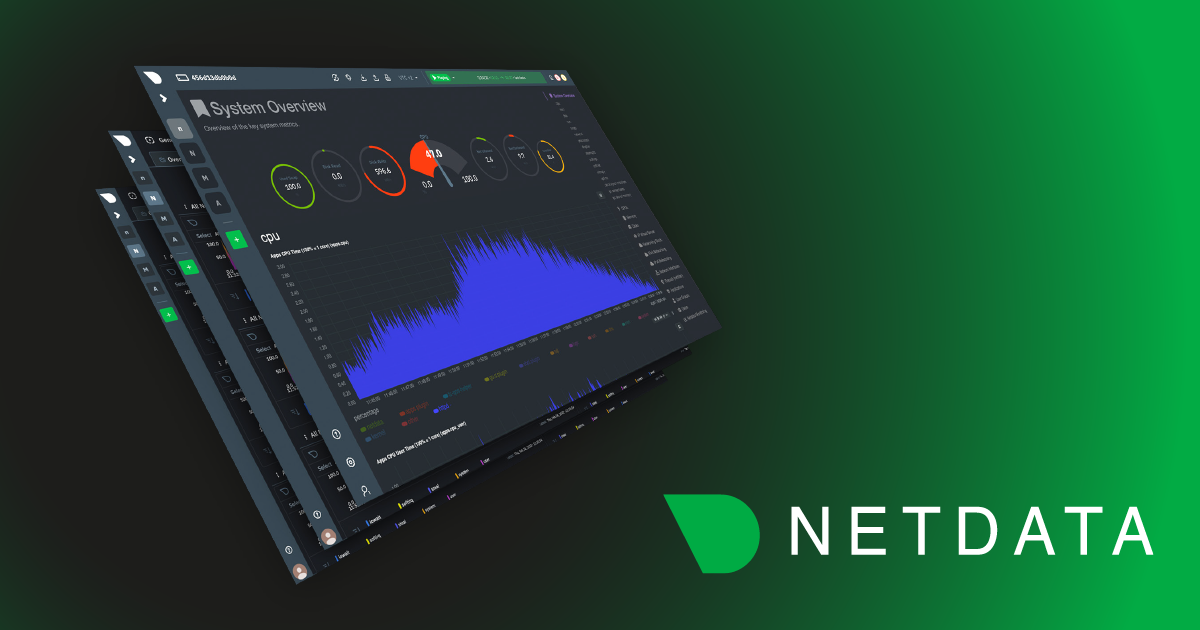
Linux CPU Consumption, Load & Pressure Explained
Understand Linux CPU consumption, load, and pressure metrics, and learn how to read them for smarter performance optimization. Read the full guide now!