









 Windows Server Monitoring
See Every Second of Your Windows Infrastructure
Transform Windows Server monitoring with per-second metrics, automatic discovery, and ML-powered insights. Monitor IIS, SQL Server, Active Directory, and more - without the complexity or cost of traditional solutions.


Why Teams Choose Netdata for Windows
The fastest path from installation to insight
Per-Second Precision
Capture every Windows metric at 1-second granularity - 10-60× faster than traditional monitoring. See transient issues others miss.
Zero Configuration
Install in 60 seconds. IIS, SQL Server, Active Directory auto-discovered. Dashboards and alerts work instantly - no manual setup.
ML Anomaly Detection
18 machine learning models per metric detect issues with 99% false positive reduction. Provides an unbiased view of infrastructure behavior.
90% Cost Savings
Predictable per-node pricing for infrastructure monitoring, with no charges for metrics volume, Logs Monitoring (querying logs in place), users, data retention or containers. No surprise bills from metrics volume or custom metrics.
Unified Platform
Monitor Windows, Linux, containers, and cloud from one interface. Eliminate tool sprawl and context switching.
Instant Troubleshooting
AI explains issues in plain language. Anomaly Advisor surfaces root cause in top 30-50 metrics. 80% MTTR reduction.
Trusted by DevOps teams worldwide








































Built for Windows Operations Teams
Catch Issues Before They Cascade
80% faster MTTR
See Real-Time Monitoring


Monitor Everything Automatically
60 seconds to full visibility
Explore Auto-Discovery


Troubleshoot in Your Language
Zero learning curve
Try AI Troubleshooting


Scale Without Complexity
Linear scalability
Learn About Scalability


Keep Your Data Sovereign
100% data sovereignty
Understand Security


Eliminate Tool Sprawl
One platform for everything
See Unified Monitoring


Netdata vs Traditional Windows Monitoring
Why Netdata Wins for Windows
See how Netdata’s edge-native architecture delivers superior Windows monitoring at a fraction of the cost.
Capability
Netdata
Traditional Tools
Data Collection
Metrics Granularity
✅ Per-Second
1-second collection, no sampling
⚠️ Per-Minute
10-60 second intervals, averaged
Time to First Dashboard
✅ 60 Seconds
Automatic discovery and generation
❌ Days to Weeks
Manual configuration required
IIS/SQL Auto-Discovery
✅ Automatic
Zero configuration needed
⚠️ Manual Setup
Requires configuration per service
Intelligence & Analysis
Anomaly Detection
✅ 18 ML Models
99% false positive reduction
⚠️ Basic Thresholds
Fixed thresholds, manual tuning
Root Cause Analysis
✅ AI-Powered
Natural language explanations
❌ Manual Investigation
Jump between tools and dashboards
Pre-Configured Alerts
✅ 400+ Templates
Component-level alerts included
⚠️ Manual Setup
Build and tune from scratch
Cost & Efficiency
Pricing Model
✅ Predictable Per-Node
No metrics volume charges
❌ Complex Metering
Per-host + per-GB + per-metric
Total Cost of Ownership
✅ 90% Savings
Transparent, predictable billing
❌ Unpredictable
Bills spike with data volume
Resource Overhead
✅ <5% CPU, 150-200MB RAM
Independently validated lowest
⚠️ Higher Overhead
More resources at scale
Scalability & Architecture
Scaling Model
✅ Linear
Add nodes without degradation
❌ Exponential Complexity
Central bottlenecks at scale
Data Storage
✅ Edge-Based
0.6 bytes/sample, on-premises
⚠️ Centralized
Cloud egress costs apply
High Availability
✅ Built-In
Active-active clustering
⚠️ Complex Setup
Requires additional infrastructure
Complete Windows Monitoring Coverage
Monitor Every IIS Website and App Pool
Automatic discovery of all IIS websites and application pools. Track requests, connections, errors, and uptime per-second. ML detects anomalies in traffic patterns and error rates.
25+ charts per website, zero configuration
Learn More


Why Windows Teams Love Netdata
Real results from production deployments

10× Faster Troubleshooting
Per-second metrics reveal issues invisible to minute-based monitoring. Anomaly Advisor surfaces root cause in top 30-50 metrics. 80% MTTR reduction documented.

90% Cost Savings
Transparent per-node pricing with no surprise bills from metrics volume spikes. Predictable costs that scale linearly with your infrastructure.

60-Second Deployment
Install with one PowerShell command. IIS, SQL Server, Active Directory auto-discovered. Dashboards and 400+ pre-configured alerts work instantly.

99% Fewer False Positives
18 ML models per metric with consensus-based detection. Only flag anomalies when ALL models agree. Unbiased view of infrastructure behavior.

Unified Platform
Monitor Windows, Linux, containers, and cloud from one interface. Eliminate tool sprawl. Time-synchronized views across metrics and logs.

AI Troubleshooting
Ask questions in plain English. AI explains root causes, correlates anomalies, and suggests fixes. Natural language queries via Model Context Protocol.
May 11, 2026
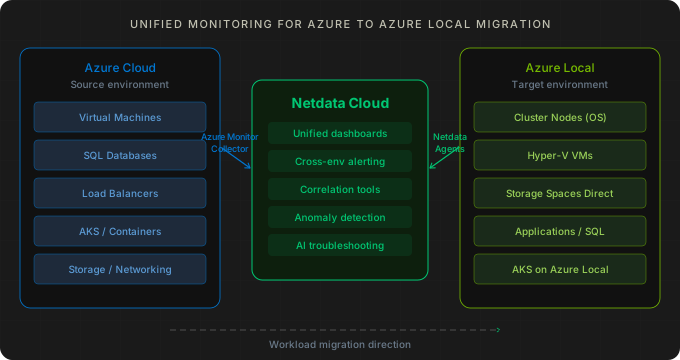
Azure Local Migration: Monitor Both Sides In One View
Monitor your Azure to Azure Local migration from one Netdata dashboard, watching cloud and on-prem infrastructure side by side. Read the full guide now!

November 8, 2024
Native Windows Agent: Real-Time Windows Monitoring
Discover Netdata's new native Windows agent, bringing powerful real-time monitoring, analytics, and seamless integration to Windows environments.

May 8, 2023
Release 1.39.0: A new era for monitoring charts.
Netdata v1.39.0 brings Charts v3.0, Windows support and virtual nodes. See what's new and upgrade your monitoring. Read the update today!