









 Distributed Tracing
Follow Every Request Across Every Service
Your checkout touches a dozen services. When it gets slow, you need the one span that took the time, and the state of the node that ran it. Send your OpenTelemetry traces to Netdata and see both in one place, with the spans kept on your own infrastructure.


What gets in the way of tracing microservices
Instrumenting with OpenTelemetry is the easy part. Running the backend, and connecting what a trace shows to what the infrastructure was doing, is where teams lose time.
Tracing needs its own backend
A collector, a storage cluster and a query service, each to size, upgrade and keep alive.
Netdata receives traces on the agent you already run
The same agent that collects metrics and logs stores and serves your spans.
Spans carry request data you would rather keep in-house
URLs, user IDs and payload attributes end up in span attributes.
Spans stay on your own infrastructure
Trace data is stored on the receiving agent’s disk, not in Netdata Cloud.
The trace says the database call was slow
Was it the query, or a node running out of memory or disk I/O?
Per-second node metrics and logs sit in the same UI
The Metrics and Logs tabs are next to the Traces tab, for the same nodes.
Your SDKs default to OTLP/HTTP
Many OpenTelemetry SDKs export OTLP/HTTP out of the box.
Turn on the OTLP/HTTP listener
Netdata accepts OTLP over HTTP (port 4318) once its listener is turned on in otel.yaml, next to gRPC (port 4317), which listens by default.
Built for Teams That Already Use OpenTelemetry
Keep your instrumentation. Change where the spans go.
OTLP Ingestion
Any OpenTelemetry SDK or Collector can send traces over OTLP (gRPC or HTTP) to the same agent endpoint that receives OTLP metrics and logs.

Duration Heatmap
See every trace bucketed by duration over time. Error spans show as red cells, so the requests worth opening stand out.

Focused Filters
Narrow the trace list by service, span name and minimum duration, or click a heatmap cell to jump to that bucket.

Cross-Service Waterfall
Open a trace to see every span across every service, in order, with timing, span kind and error highlighting.

Every Attribute Kept
Span details show status, timing, parent span and every attribute your instrumentation recorded, all indexed.

Your Infrastructure
Spans are stored on your own agents, with their own retention limits, optional S3 offload, and TLS or mutual TLS on ingestion.
Trusted by engineering teams running microservices








































A Tracing Workflow for Microservices
Point Your Services at Netdata
otel.yaml), or route spans through an OpenTelemetry Collector. In Kubernetes, a Collector DaemonSet or gateway that forwards OTLP/gRPC to a Netdata Agent or Parent gives you one place to query.No new tracing backend
Read the OTLP ingestion docs


Spot the Slow and Failing Requests
Every trace in one chart
See the Traces tab


Find the Span That Took the Time
Every span, every service
Explore microservices observability


Read What the Span Recorded
Every attribute indexed
See application performance monitoring


Check the Node Behind the Span
Same UI as metrics and logs
Explore Kubernetes monitoring


Tracing for Microservices
Netdata vs a Standalone Tracing Stack
What changes when your traces land on the same agent as your metrics and logs, and where a dedicated APM suite still goes further.
Capability
Netdata
Standalone Tracing Stack
Backend to Operate
✅ Simple
Traces handled by the existing agent
⚠️ Complex
Separate collector, storage and query tier
Instrumentation
✅ Good
OpenTelemetry SDKs or Collector over OTLP (gRPC or HTTP)
✅ Advanced
OpenTelemetry plus native vendor protocols
Where Spans Live
✅ Ideal
On your own agents’ disks
⚠️ Varies
Self-hosted cluster or vendor cloud
Infrastructure Context
✅ Ideal
Per-second metrics and logs, same UI
⚠️ Manual
Metrics and logs in other tools
Sampling
✅ Your Choice
Netdata stores every span it accepts
⚠️ Varies
Often sampled to control storage
Dependency Mapping
🔹 Network-Based
Application dependency map from live TCP and UDP connections, without instrumentation
✅ Good
Common in mature tracing and APM tools

October 5, 2026
Distributed Tracing In Netdata: OpenTelemetry Traces
Netdata now ingests OpenTelemetry traces over OTLP on the same Agent that collects your metrics and logs. Spans are stored and indexed on your own infrastructure and explored in the new Traces tab in Netdata Cloud.
May 20, 2026
Netdata Skills: Teach Your AI Coding Agent To Monitor
Meet netdata/skills, open-source agent skills that teach Claude Code, Cursor, and Copilot to instrument and troubleshoot infrastructure. Explore them now!
May 15, 2026
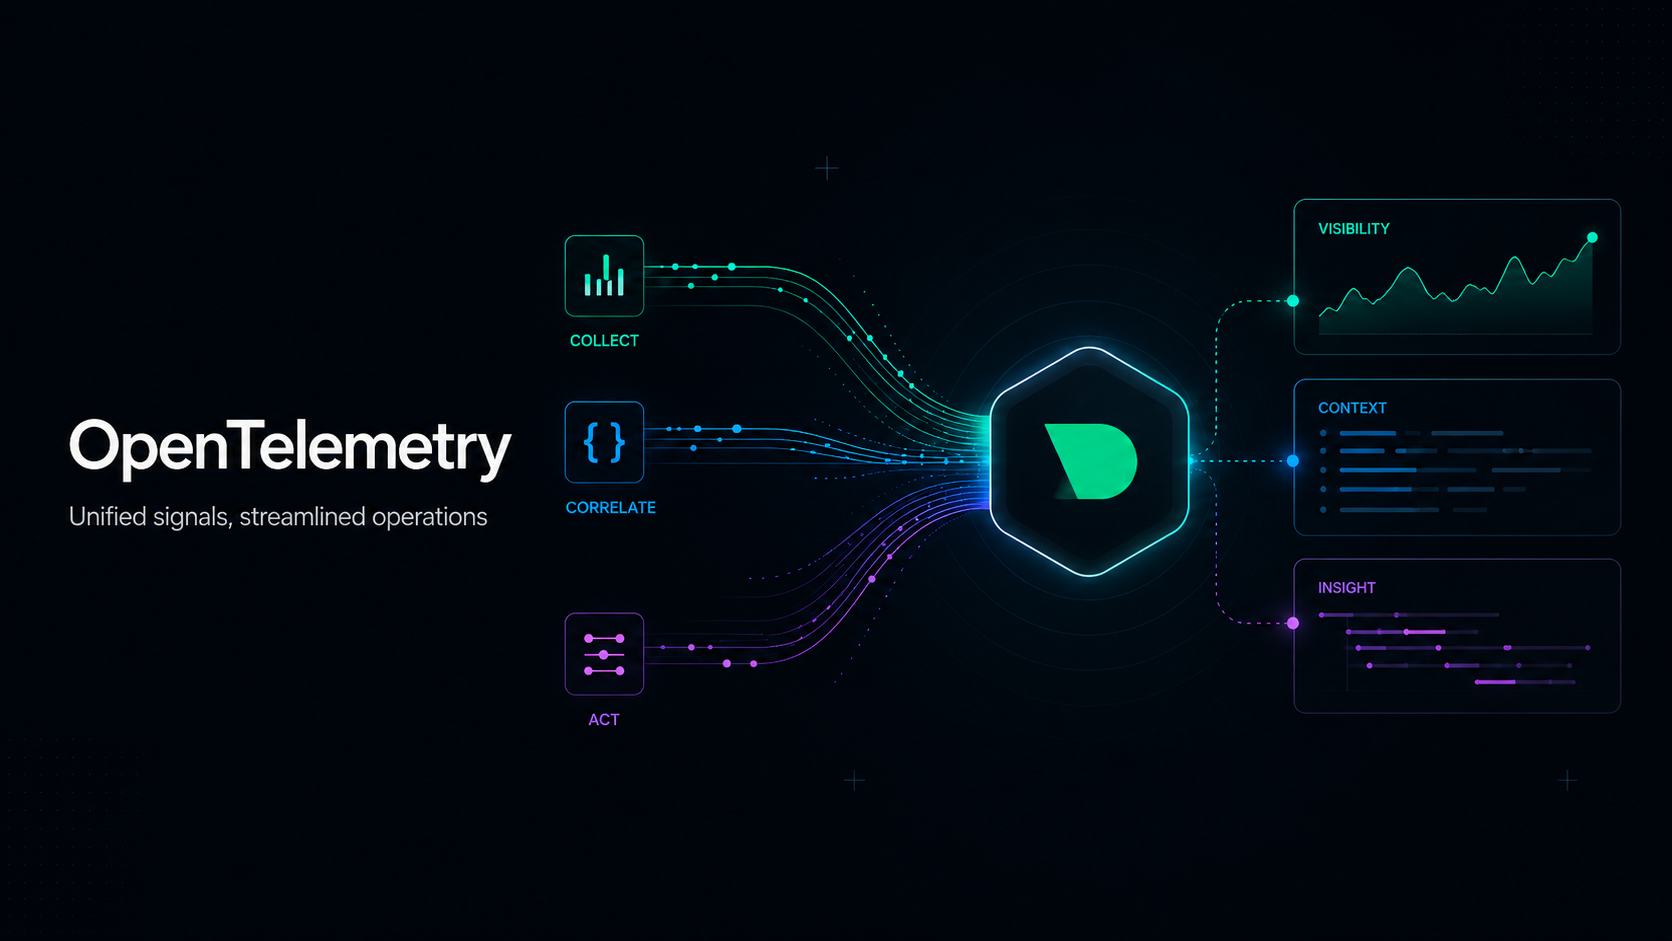
OpenTelemetry and Netdata, Today
Ingest OpenTelemetry metrics and logs into Netdata via OTLP for automatic charts, ML, and alerts alongside your existing data. Read the full guide now!
Frequently Asked Questions
