


Protect Every Transaction, Every Second
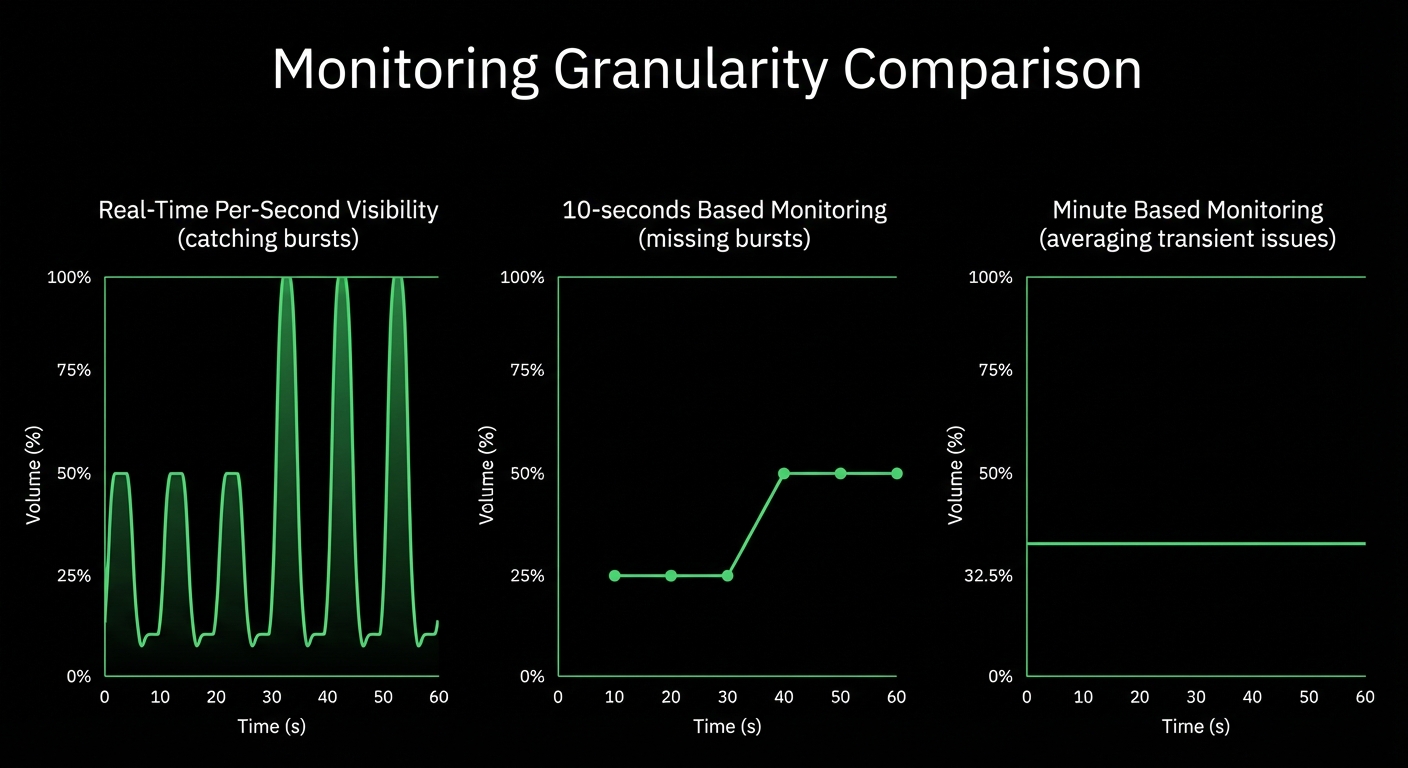
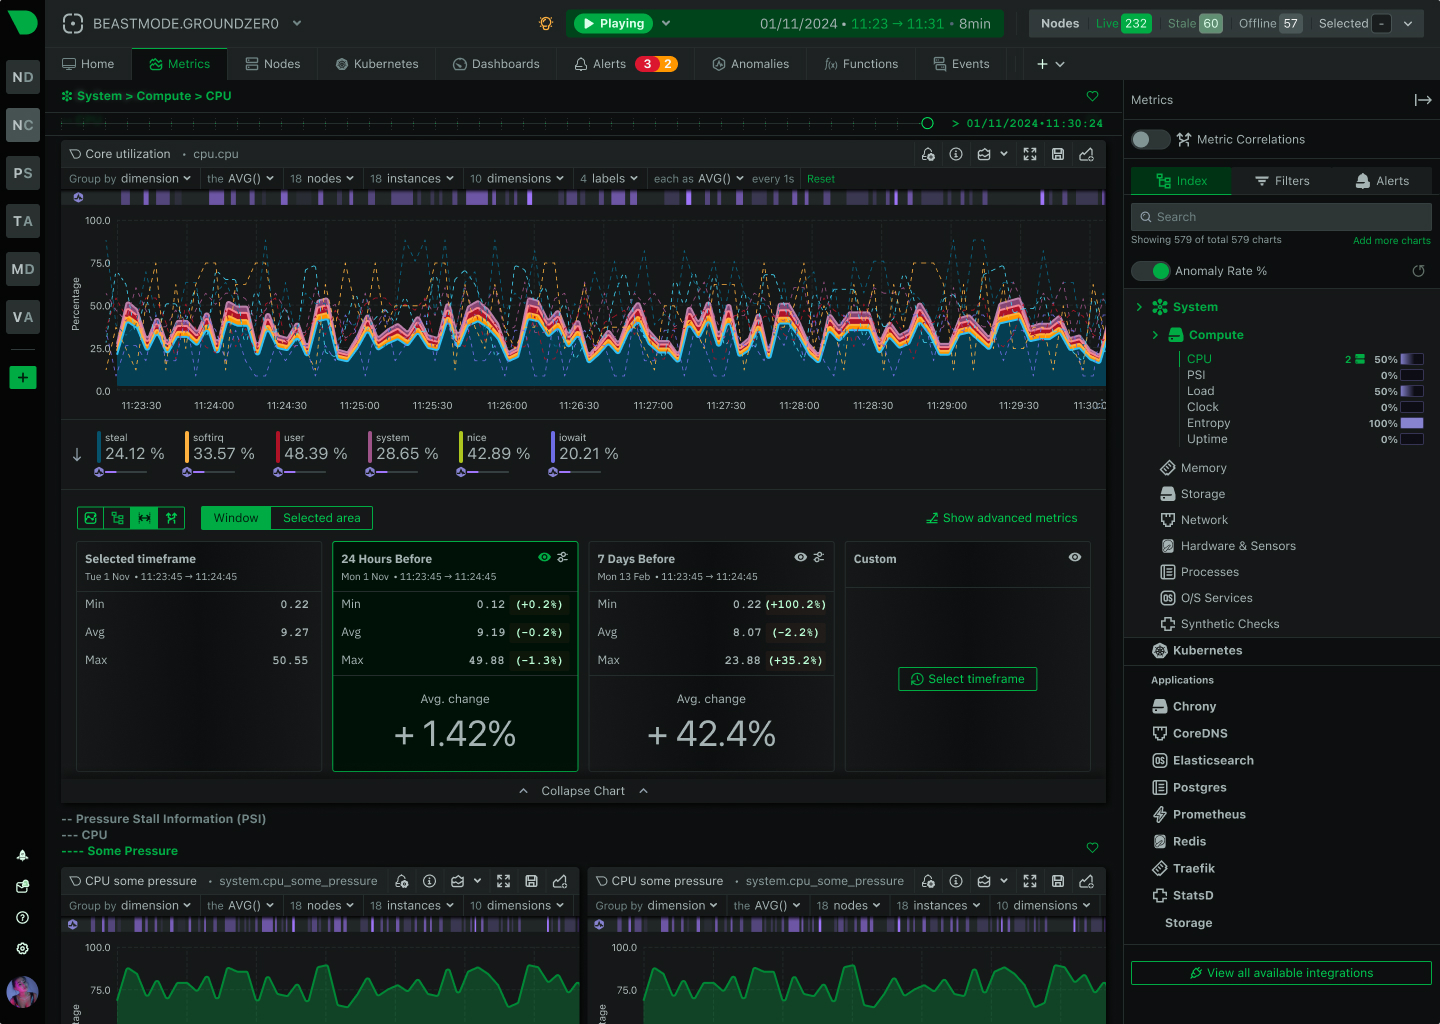
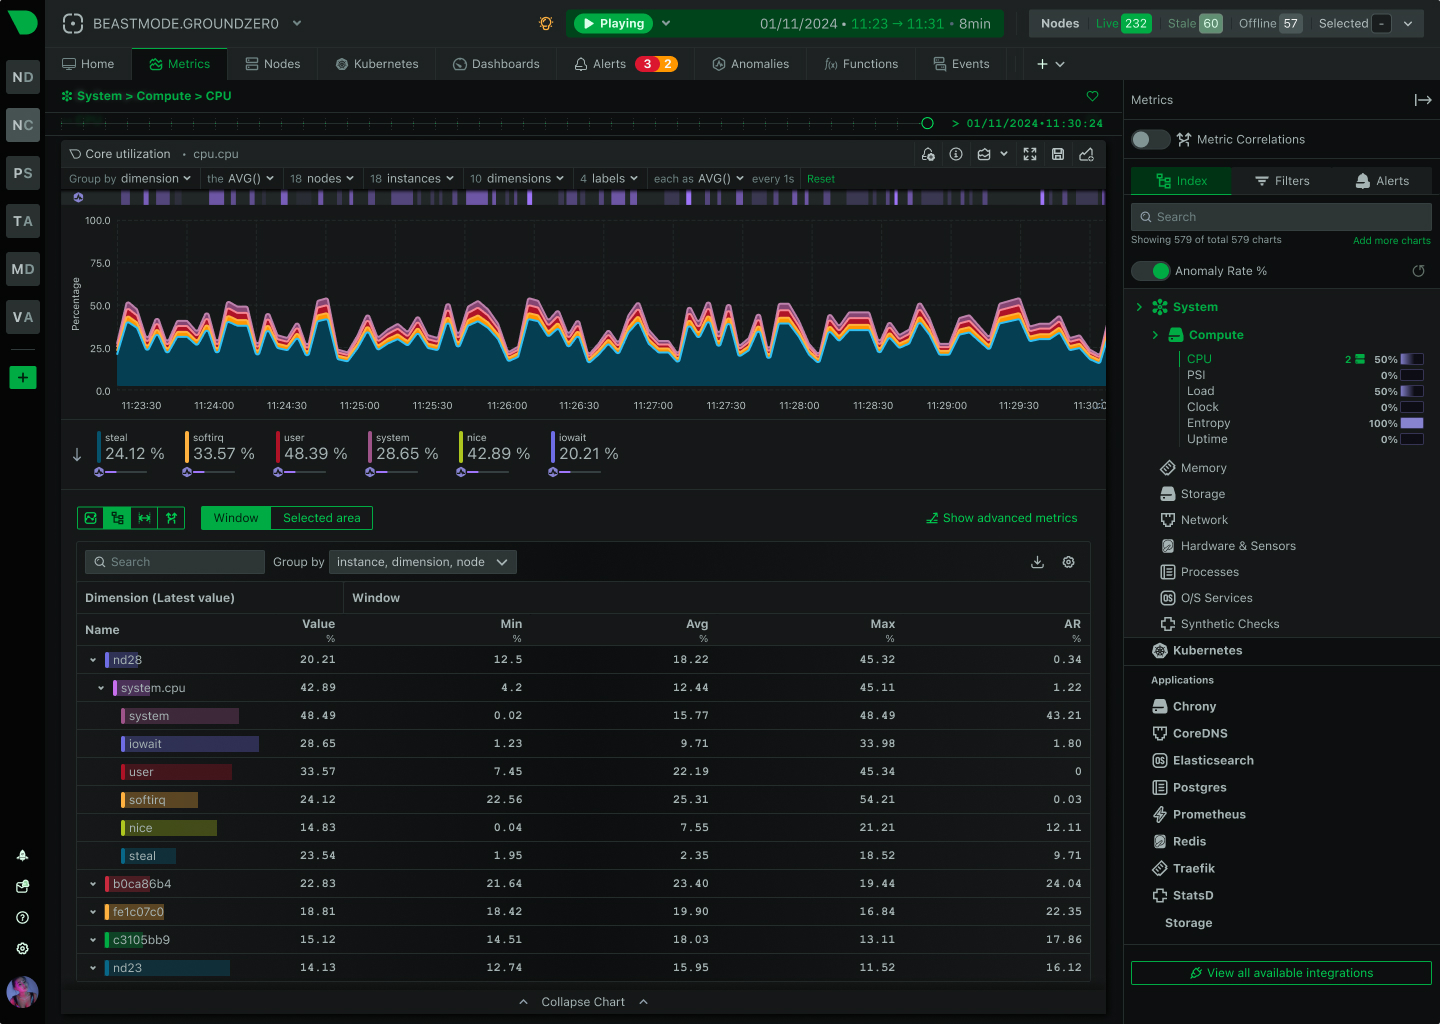
Retail operations demand instant visibility - from POS terminals to payment gateways, store networks to cloud infrastructure. Netdata delivers per-second monitoring with ML-powered anomaly detection, catching the 2-10 second issues that cost revenue while traditional 30-second monitoring stays blind.

Built for Retail’s Unique Demands
Six capabilities that transform retail operations
Catch Transient Failures
Per-second monitoring captures the 3-5 second POS freezes and brief payment delays that 30-second polling misses entirely - protecting your revenue stream during peak hours.
Predictable Costs at Scale
Flat per-node pricing with no surprise bills - monitor 1,000 stores with predictable costs versus unpredictable volume-based platforms. No charges for metrics, logs, or users.
PCI DSS Ready
Data sovereignty by design - all metrics and logs stay on-premises with unlimited retention via systemd-journal. Built for compliance with encrypted communication and comprehensive audit trails.
ML Anomaly Detection
18 unsupervised models per metric with consensus-based detection achieve 99% false positive reduction in anomaly detection - providing an additional signal for identifying unusual behavior patterns.
Multi-Location Mastery
Monitor 100s-1000s of stores with Spaces and Rooms - each location operates independently during network issues while Parents aggregate for unified visibility across your entire retail footprint.
Deploy in Minutes
Zero-configuration auto-discovery means install to first dashboard in under 60 seconds - no weeks of setup, no PromQL expertise, no manual threshold tuning. Junior engineers get senior-level visibility instantly.
Trusted by retail operations worldwide


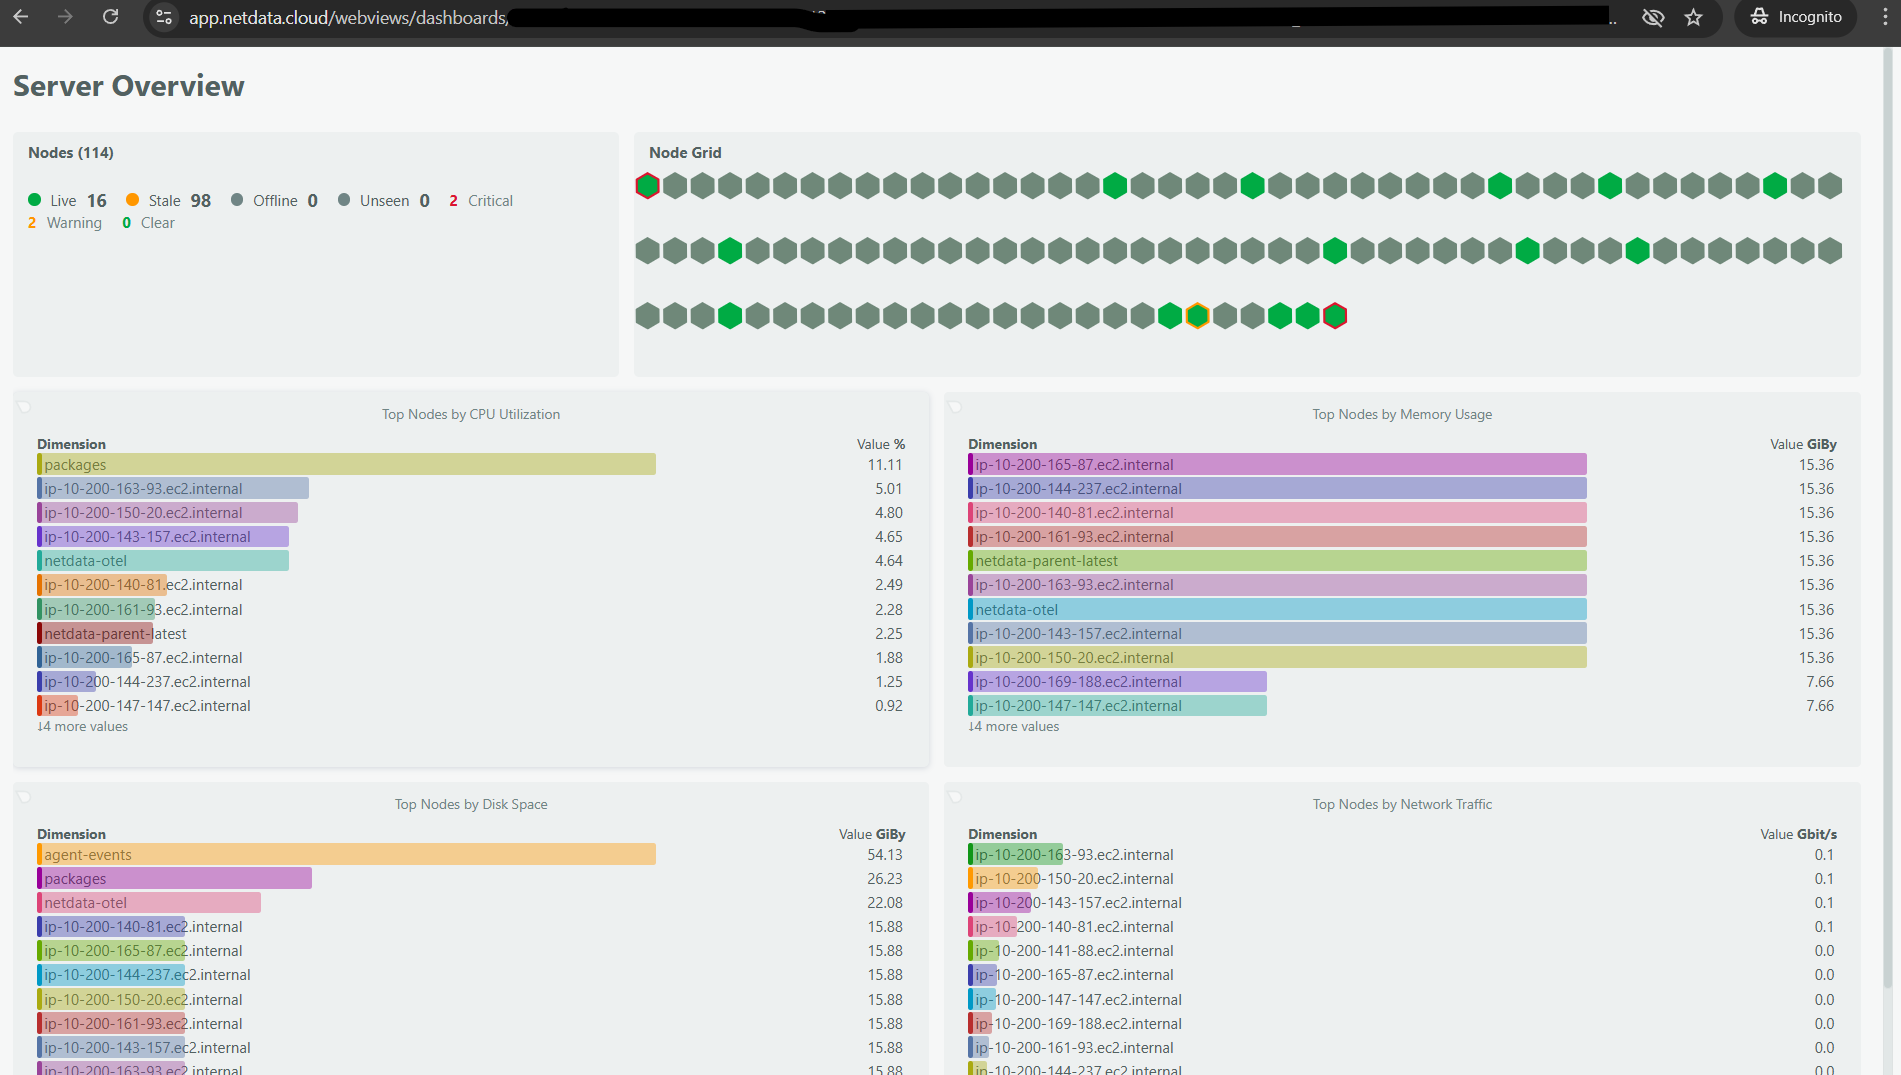
Real-Time Visibility Where Revenue Happens
Stop Losing Revenue to Invisible Outages
80% MTTR reduction with real-time visibility
See Per-Second Monitoring
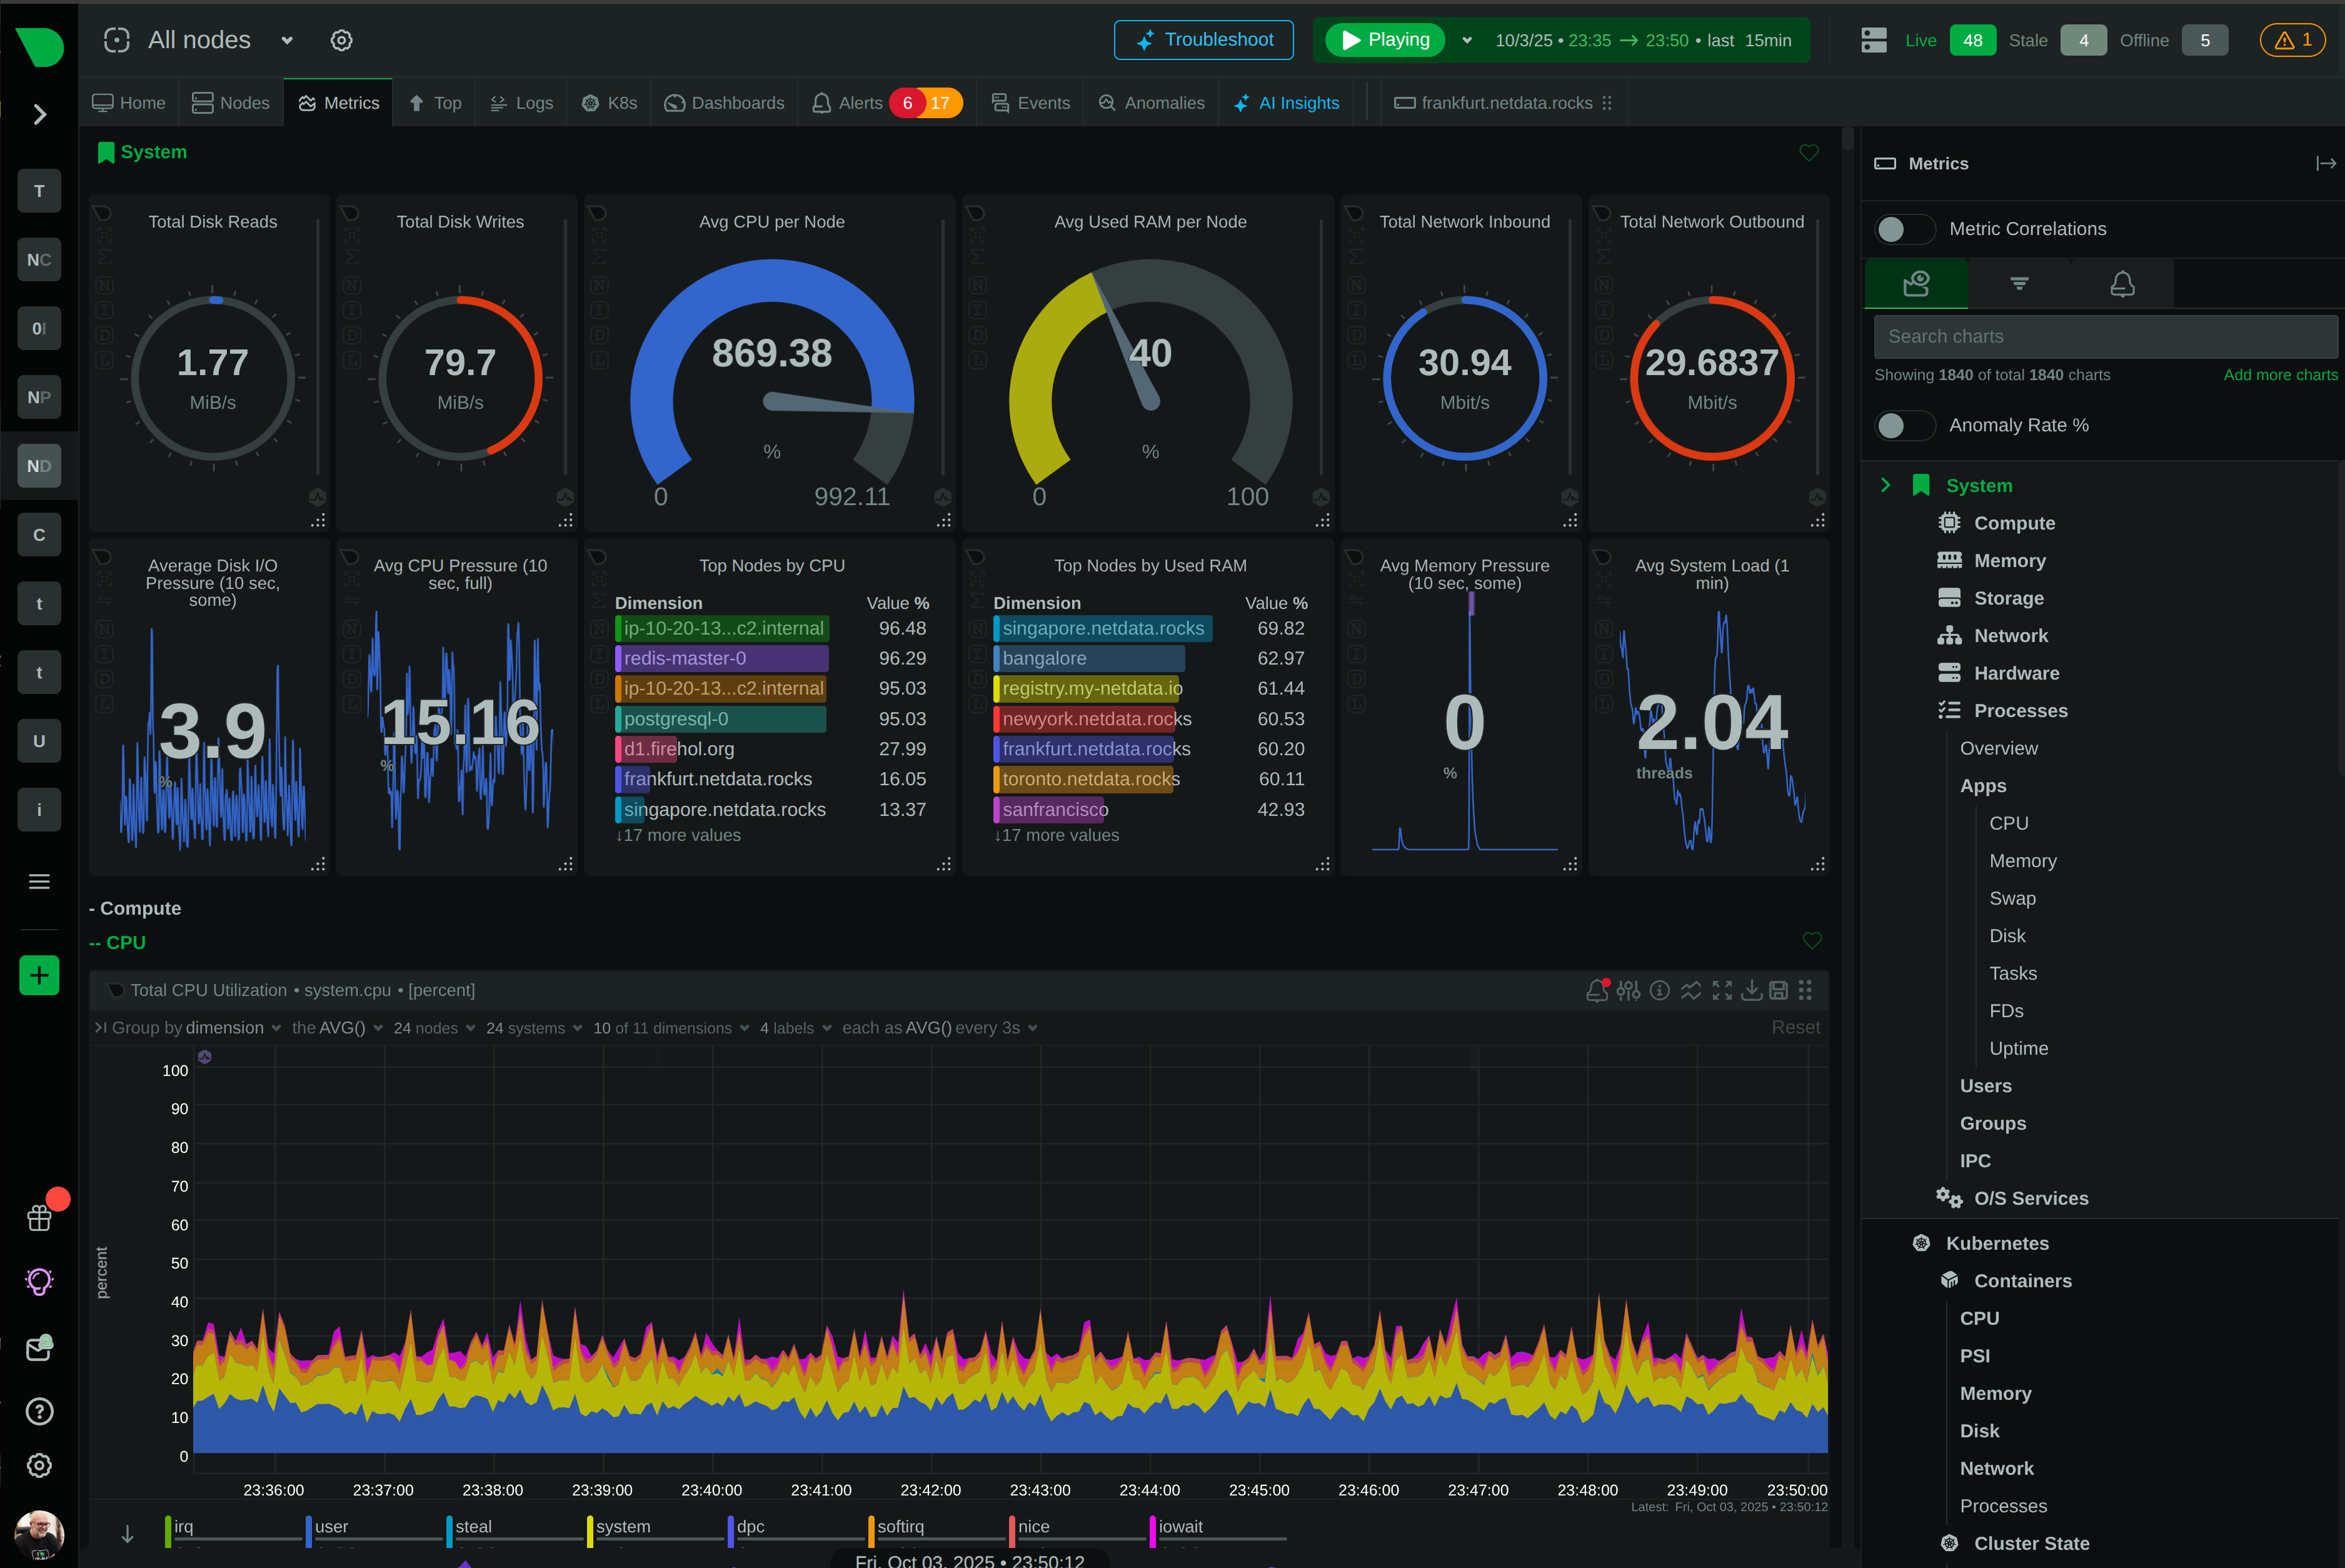
Consolidate Tools Without Sacrificing Coverage
90% cost reduction vs traditional monitoring stacks
Explore Unified Platform
Protect Payment Processing with Compliance-Ready Architecture
100% of payment-processing retailers must meet PCI DSS requirements
Review Security Design
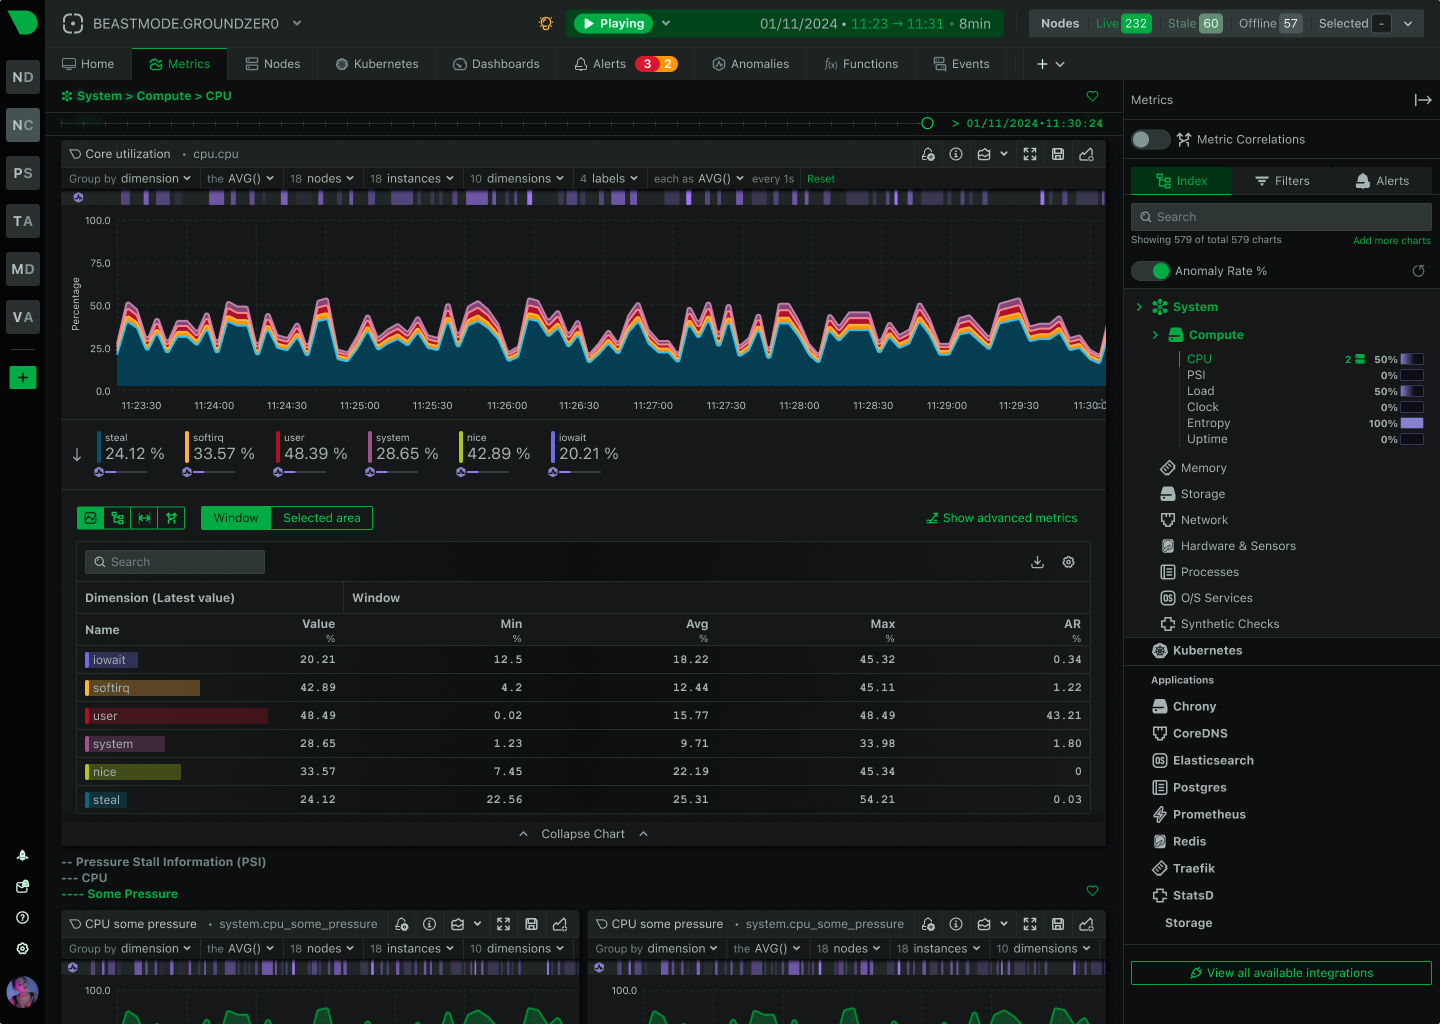
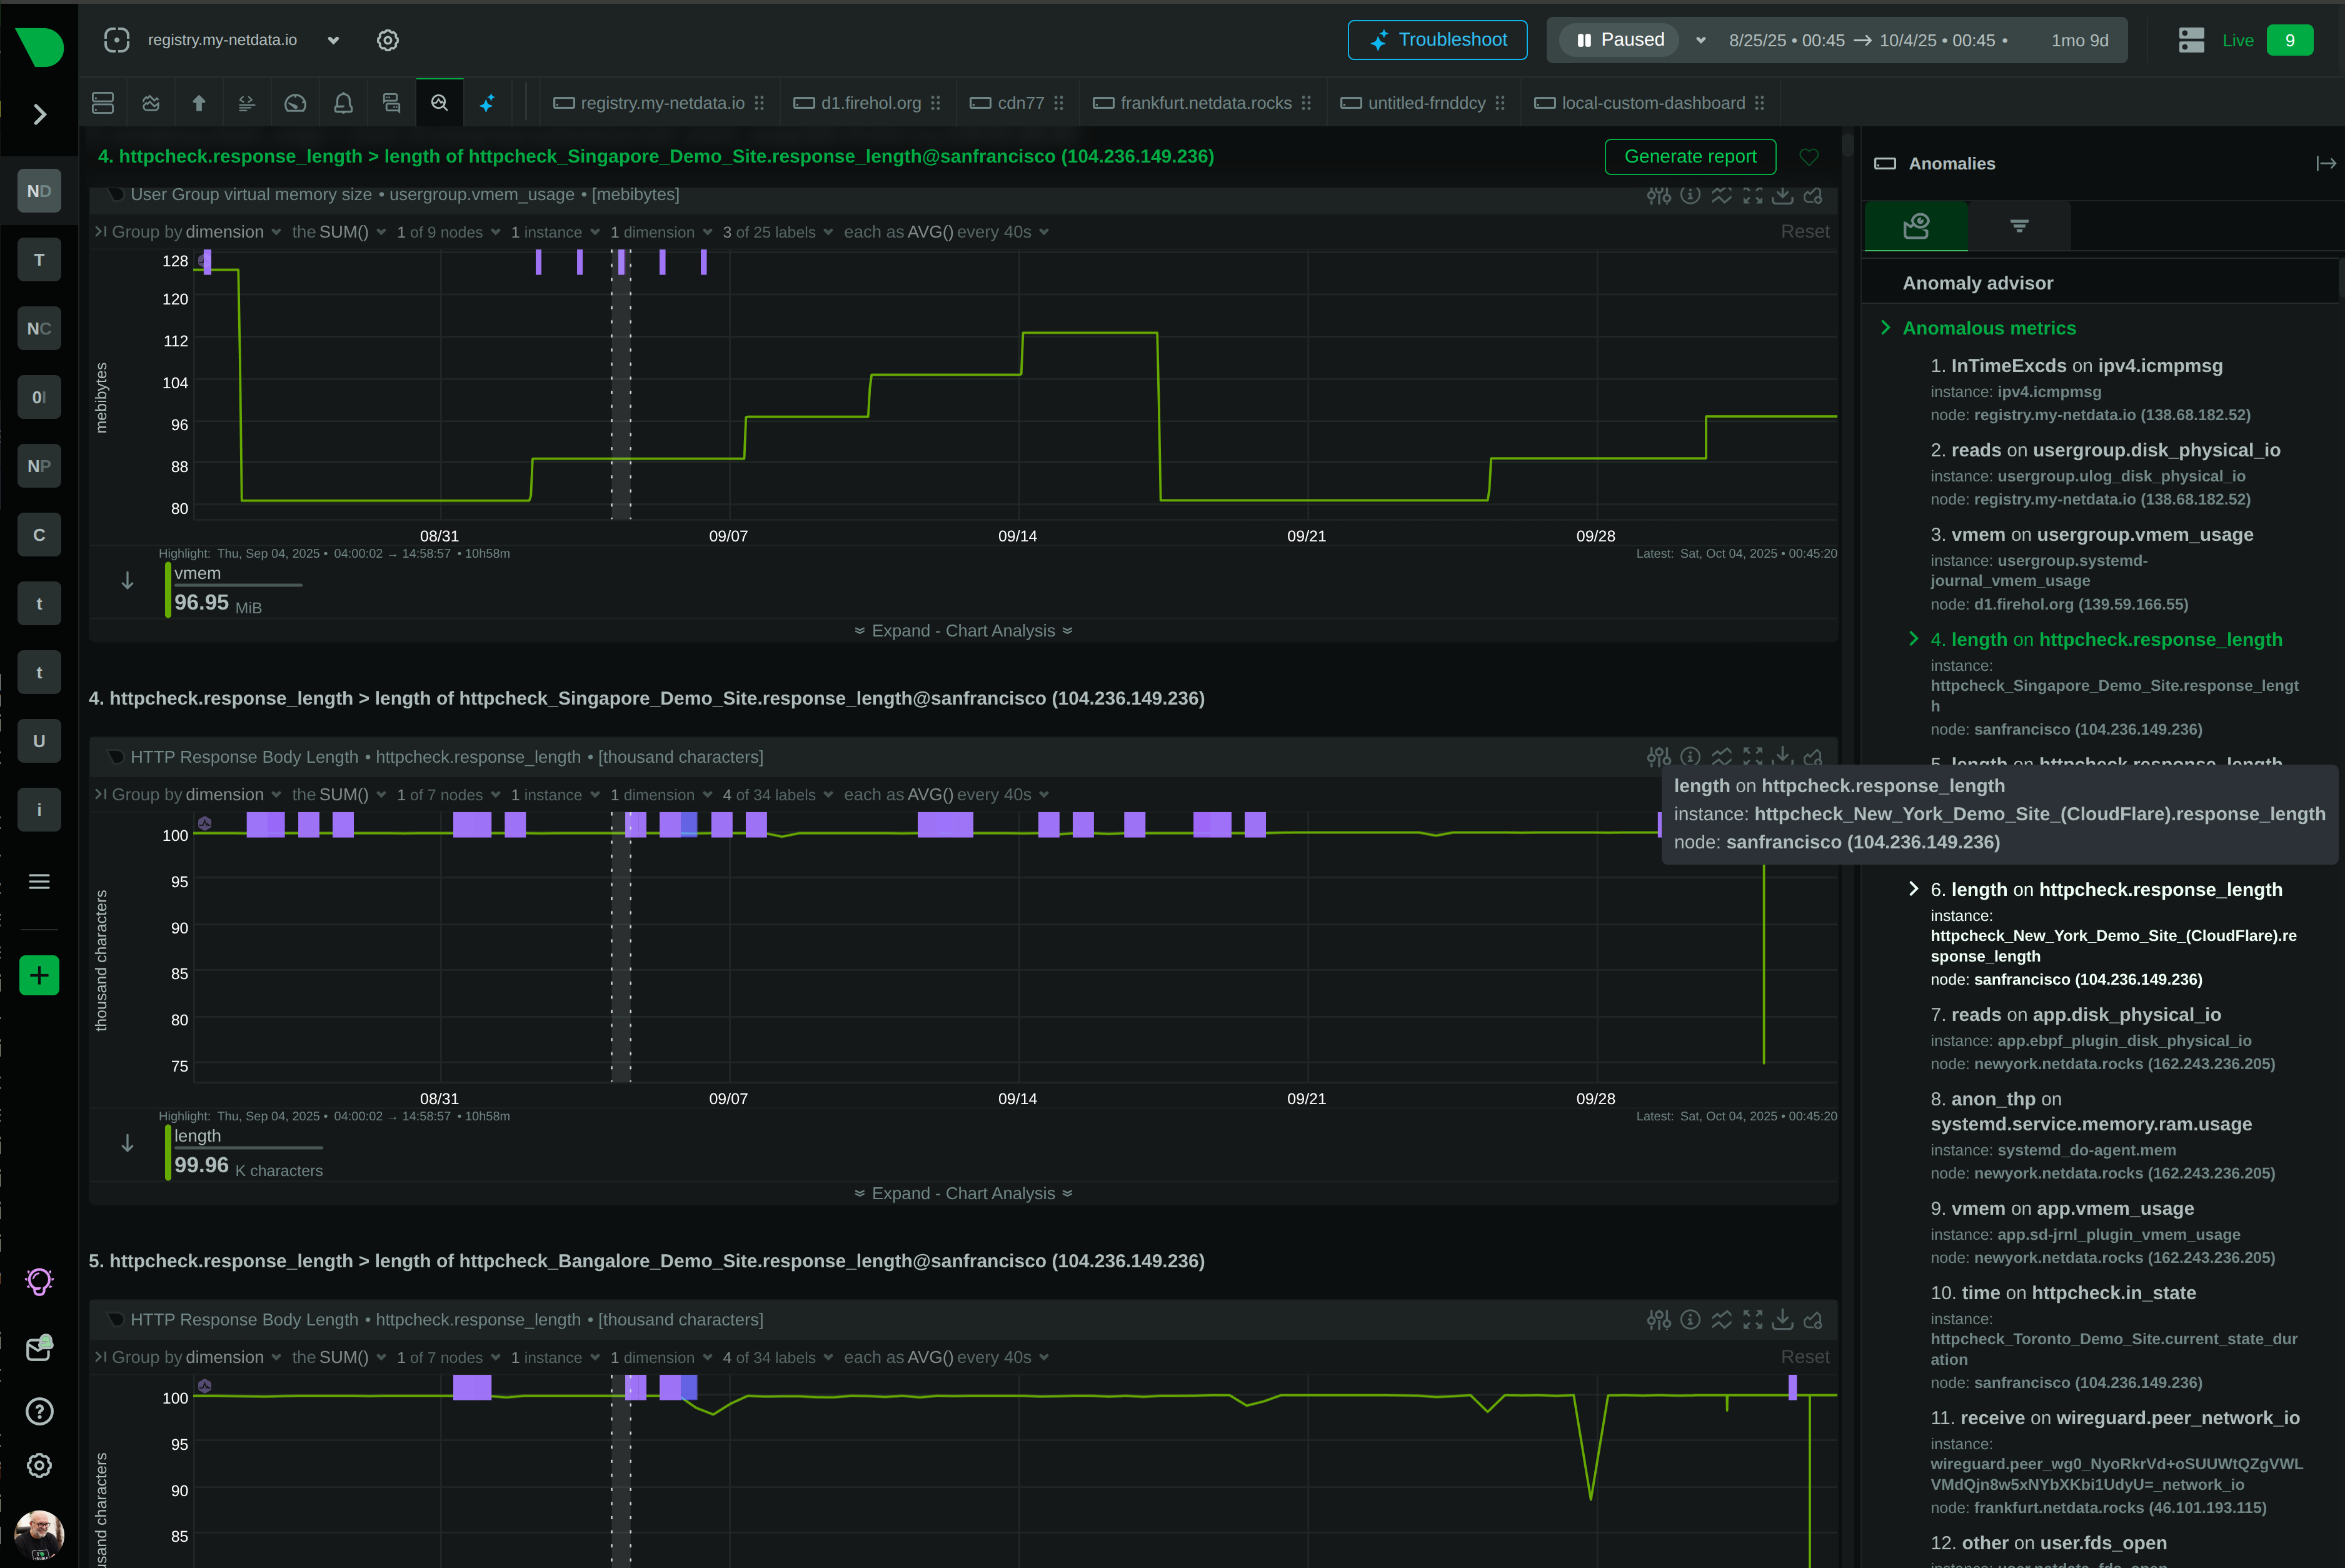
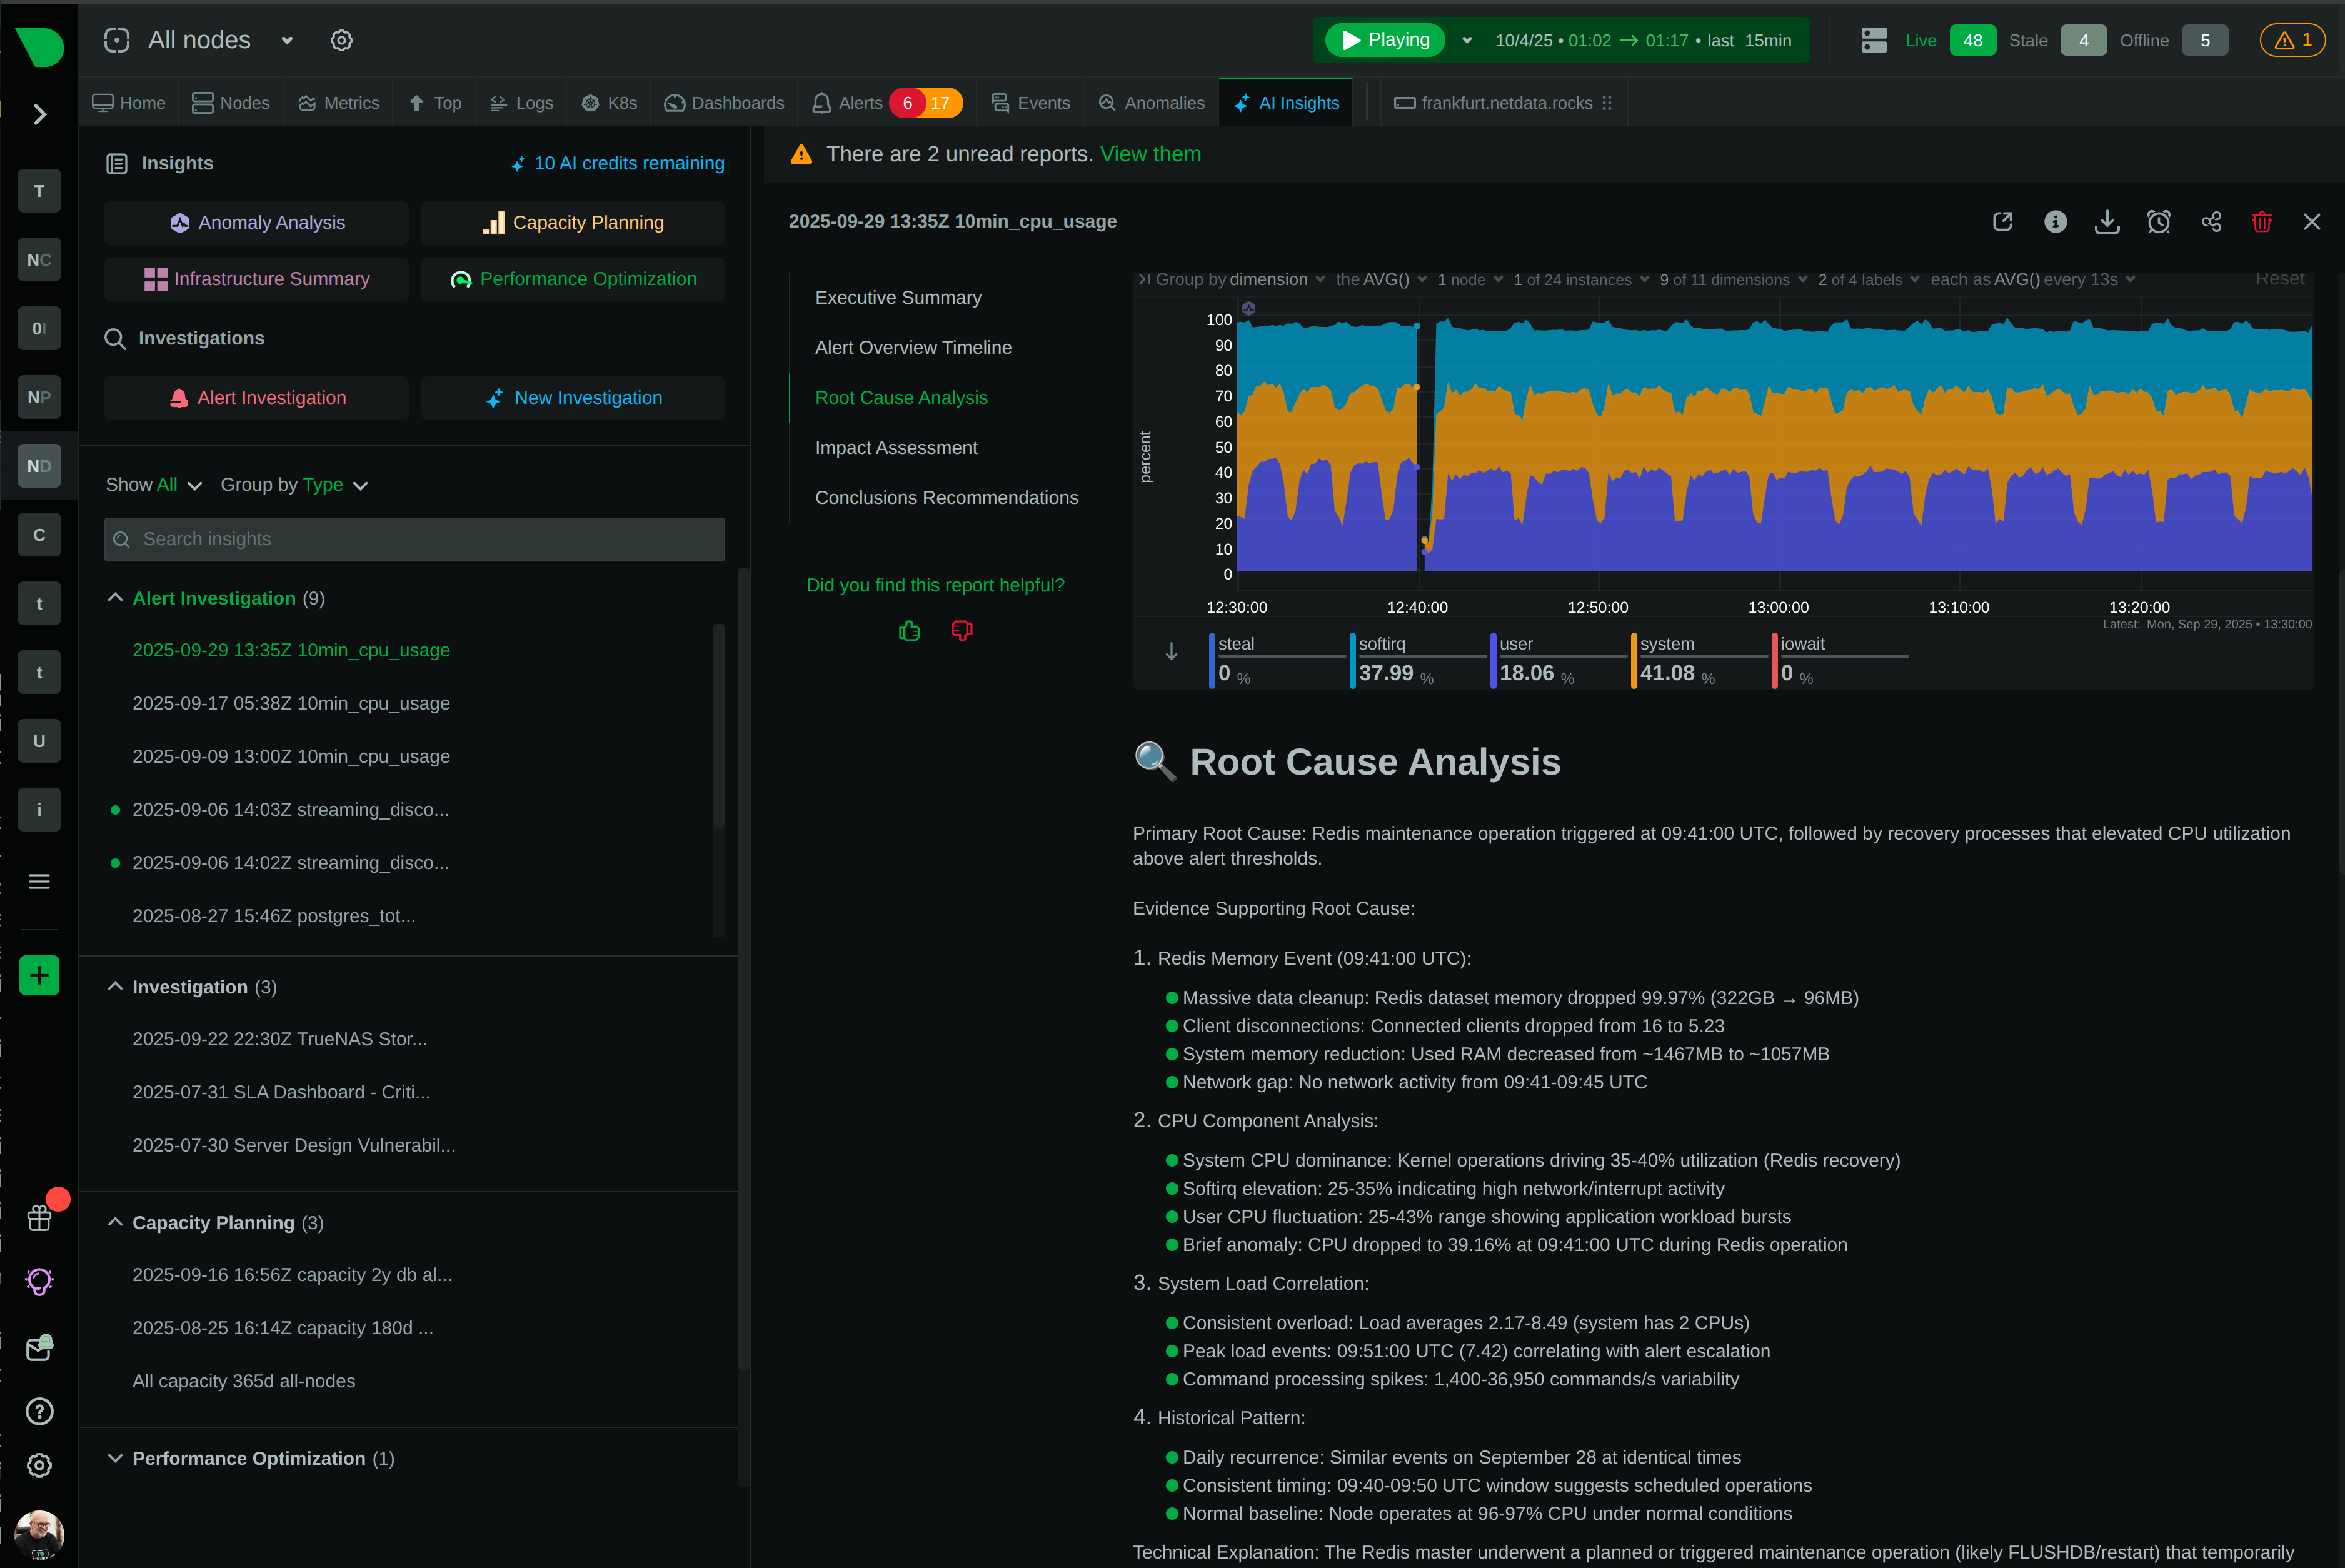
Detect Issues Before Customers Notice
Root cause identified in top 30-50 correlated metrics
Experience ML Detection
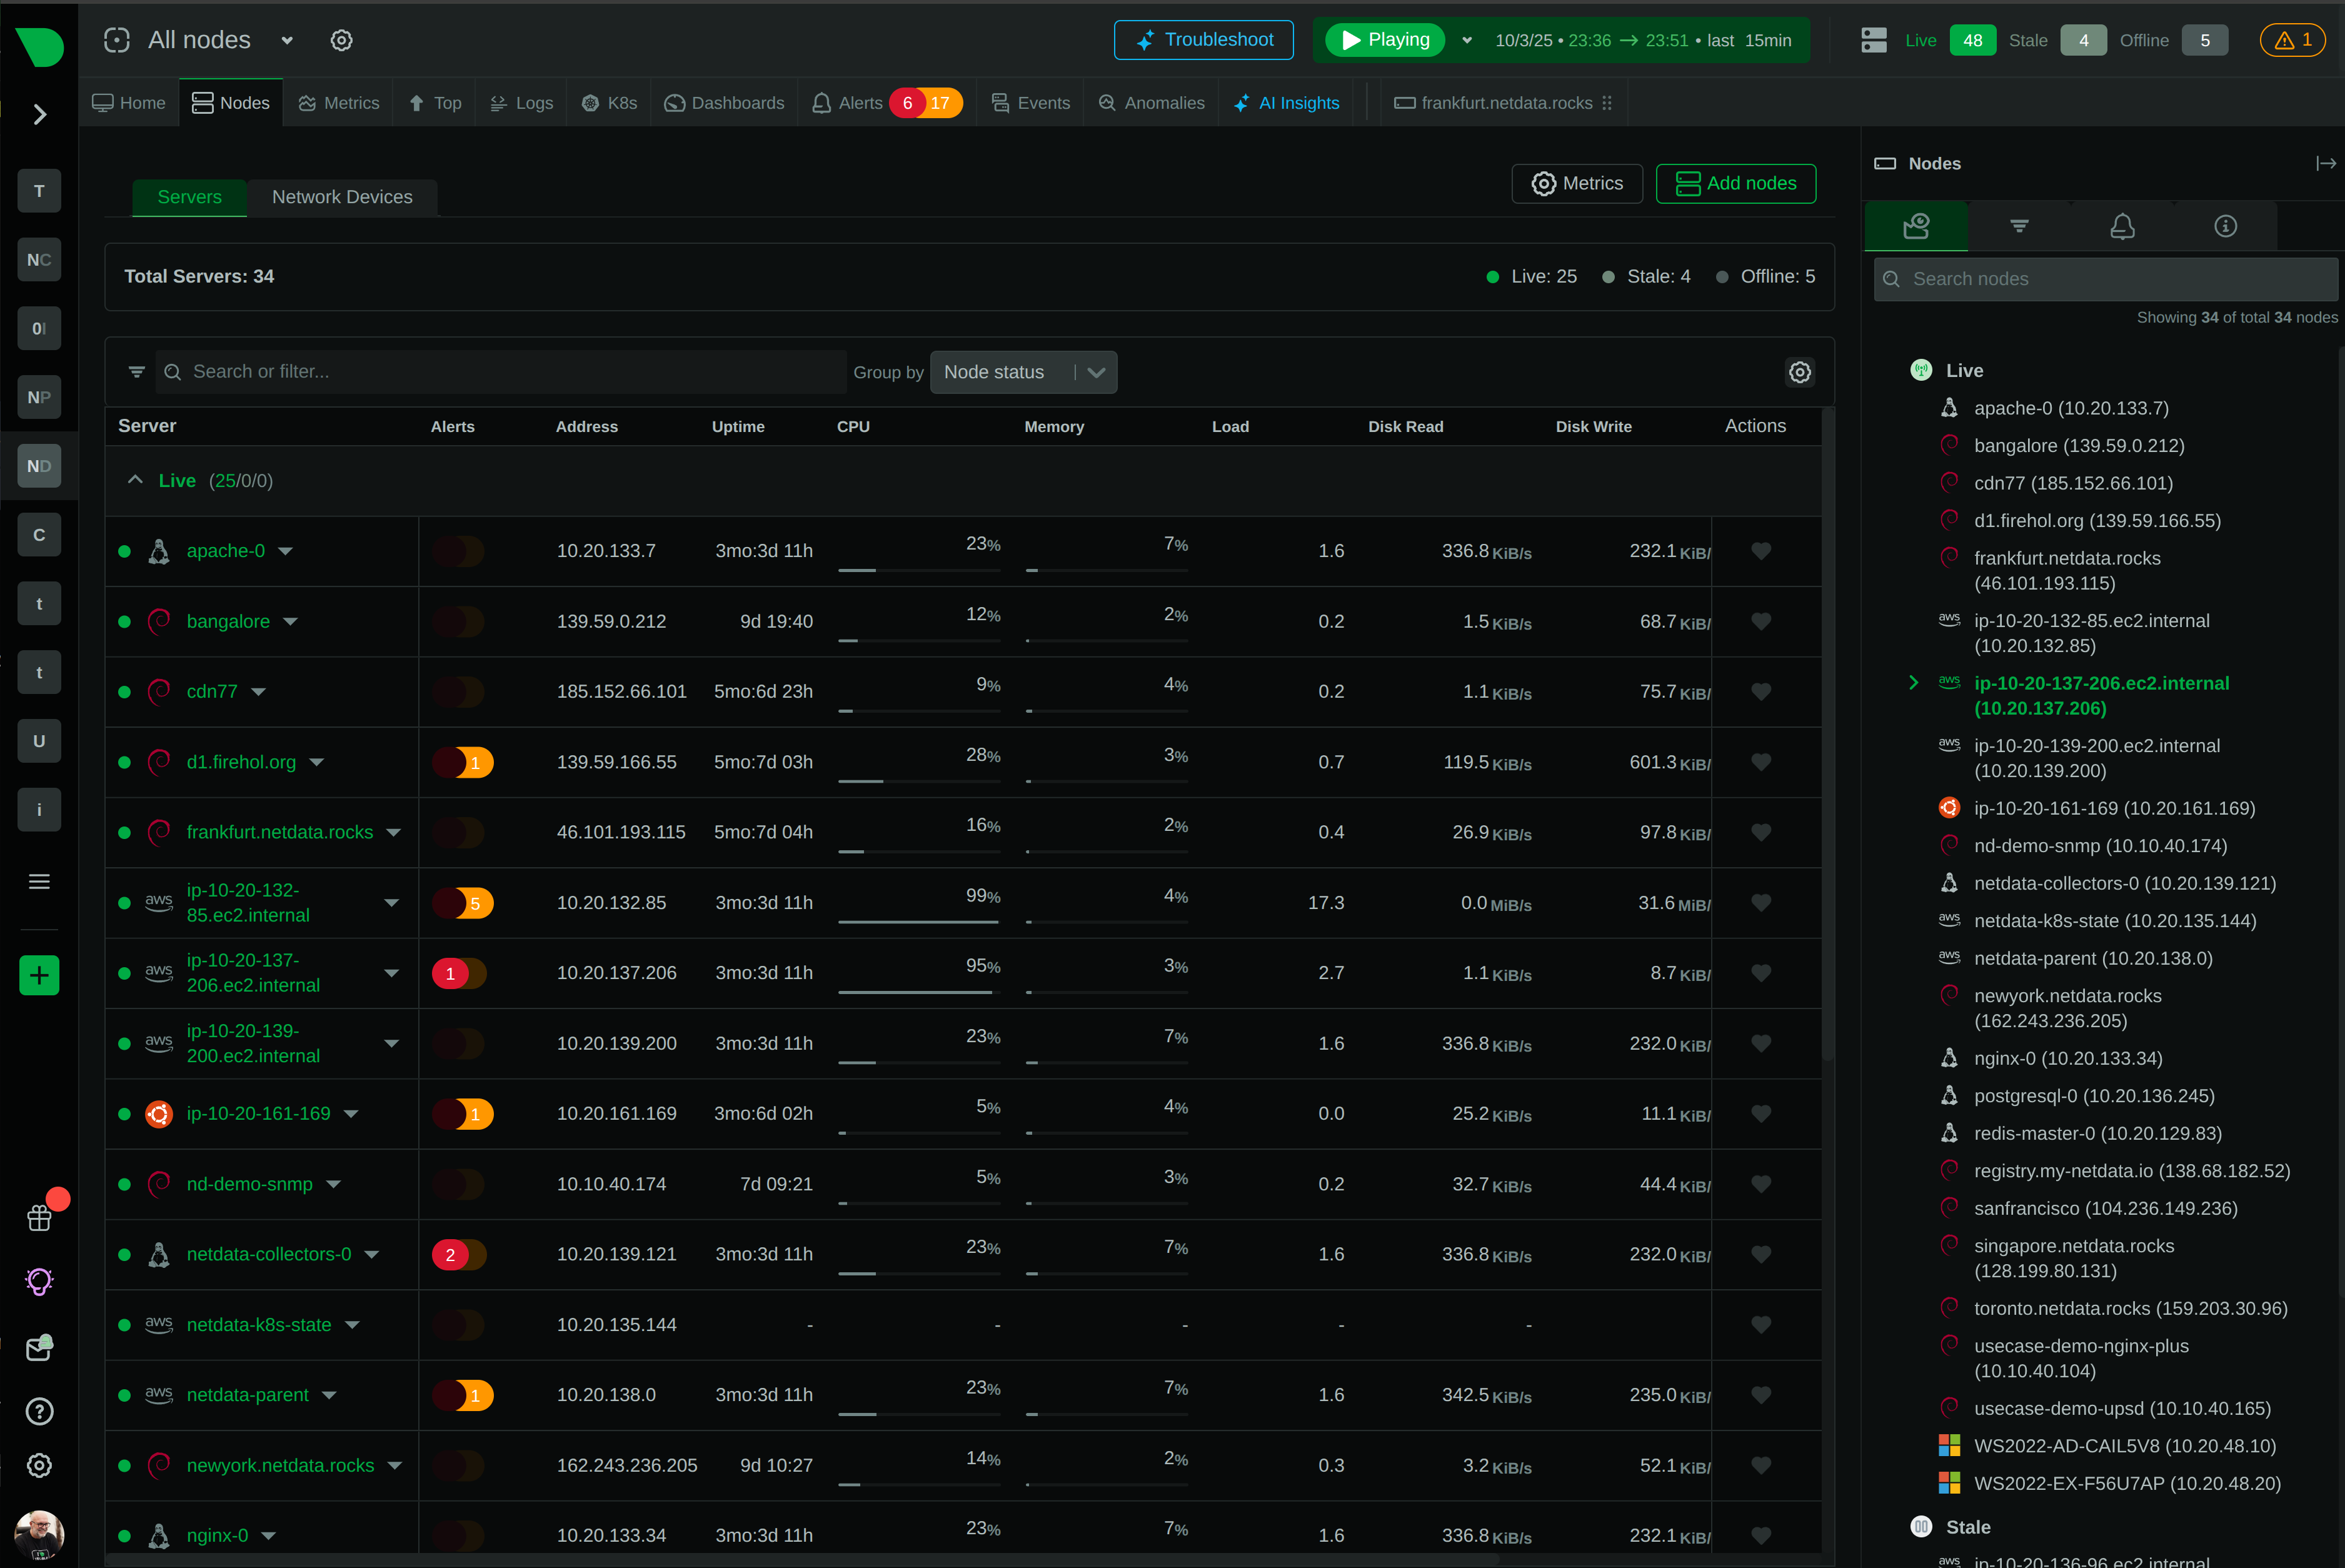
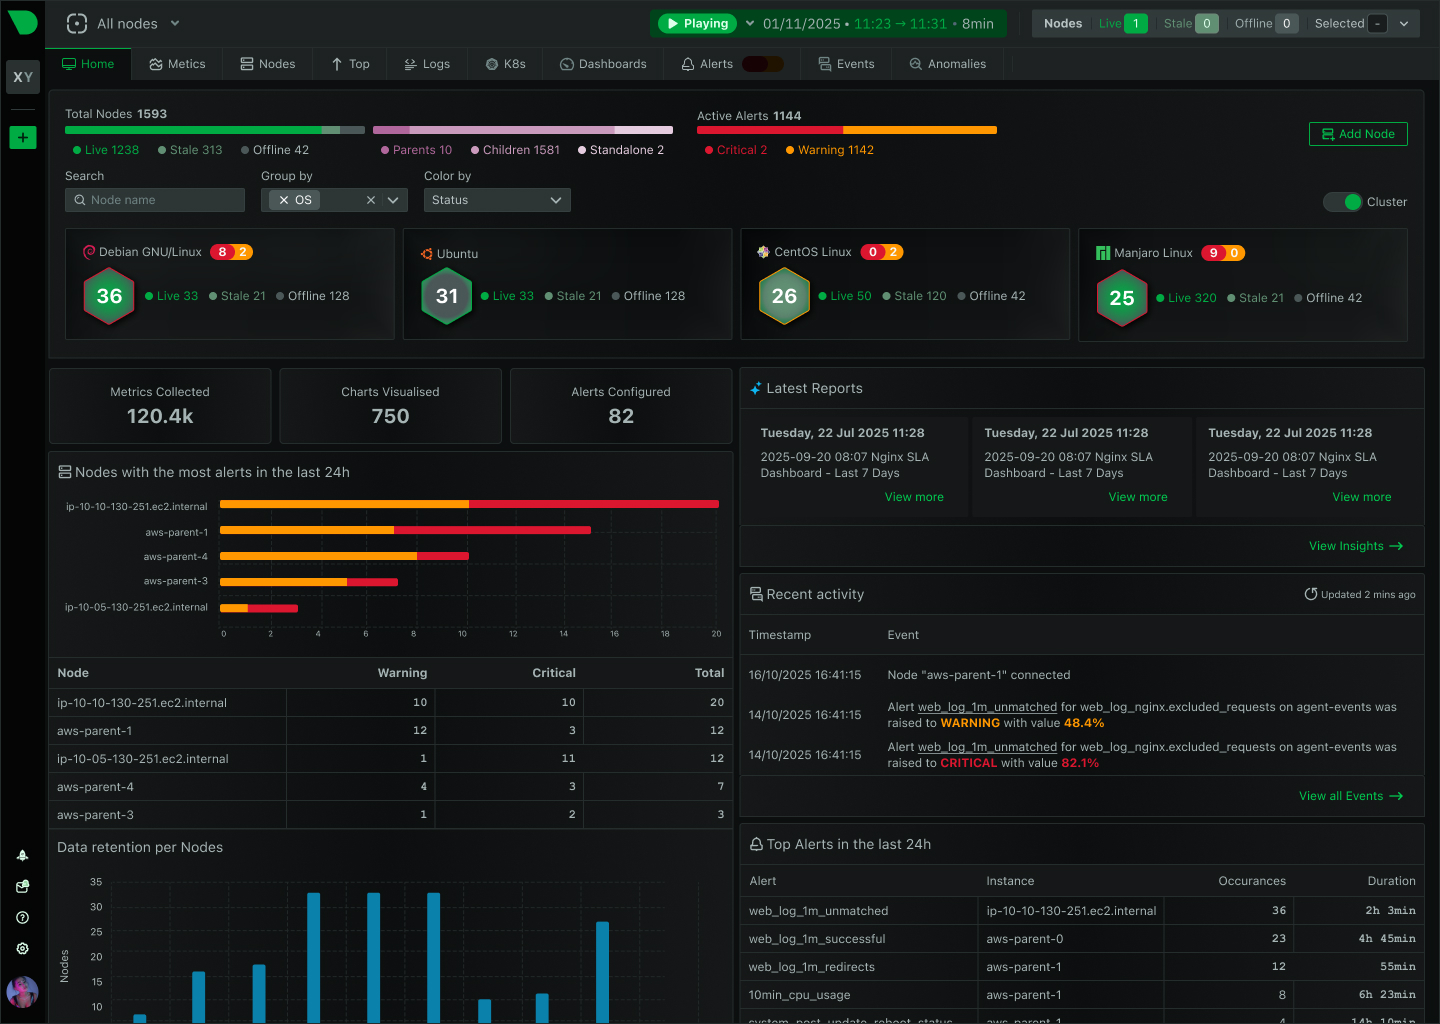
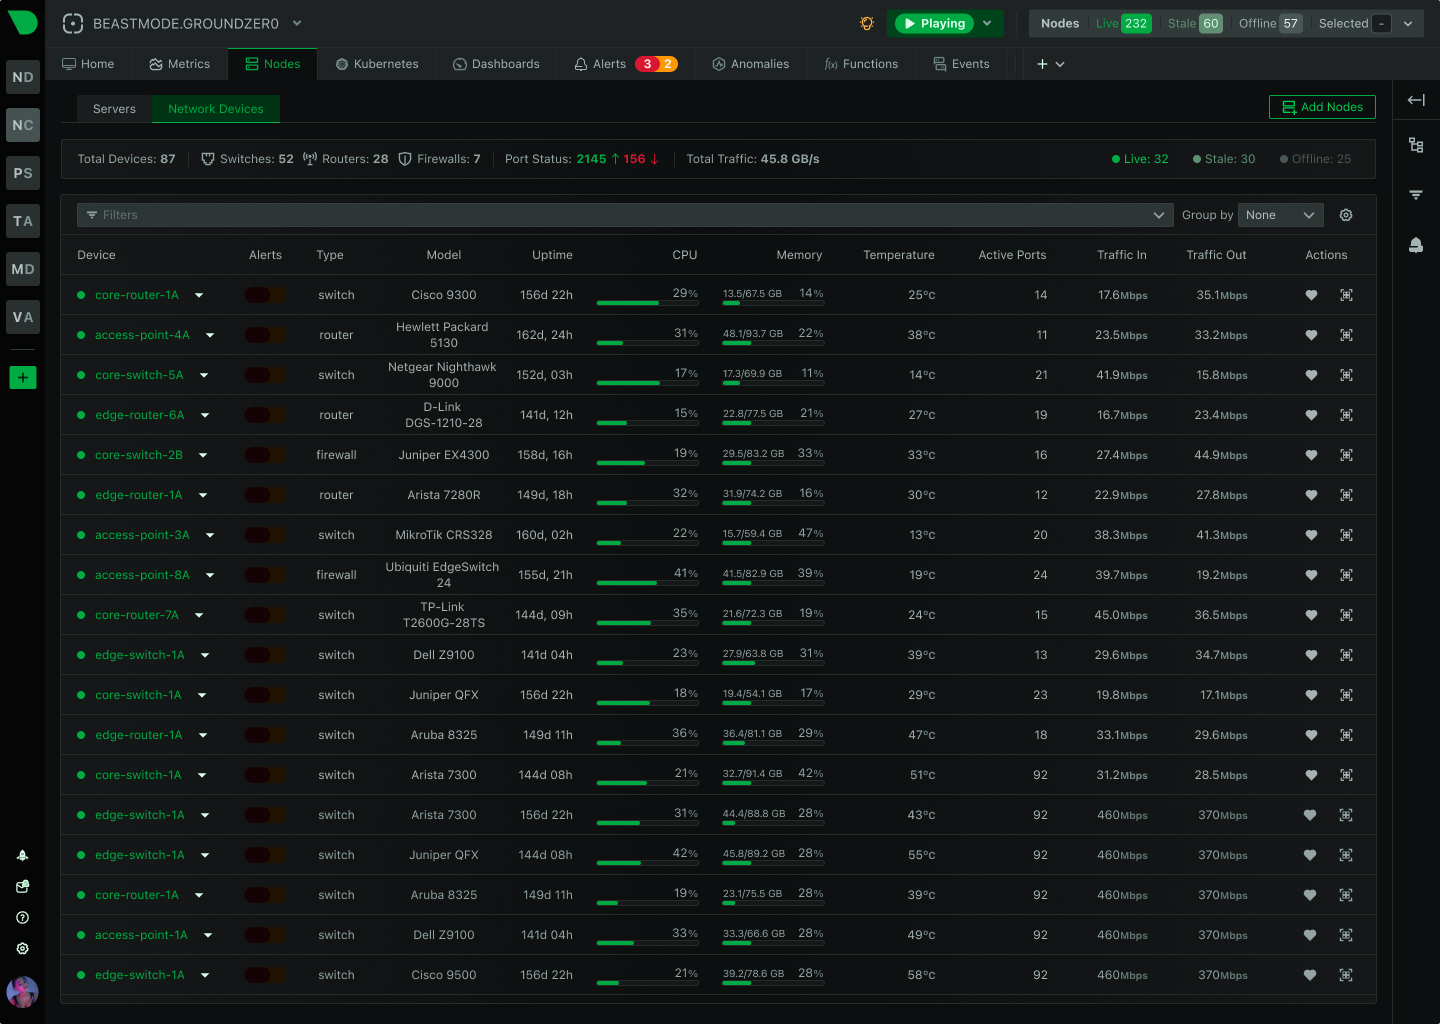
Scale from Single Store to Global Chain
Linear scalability from 1 to 100,000+ nodes
Understand Scalability
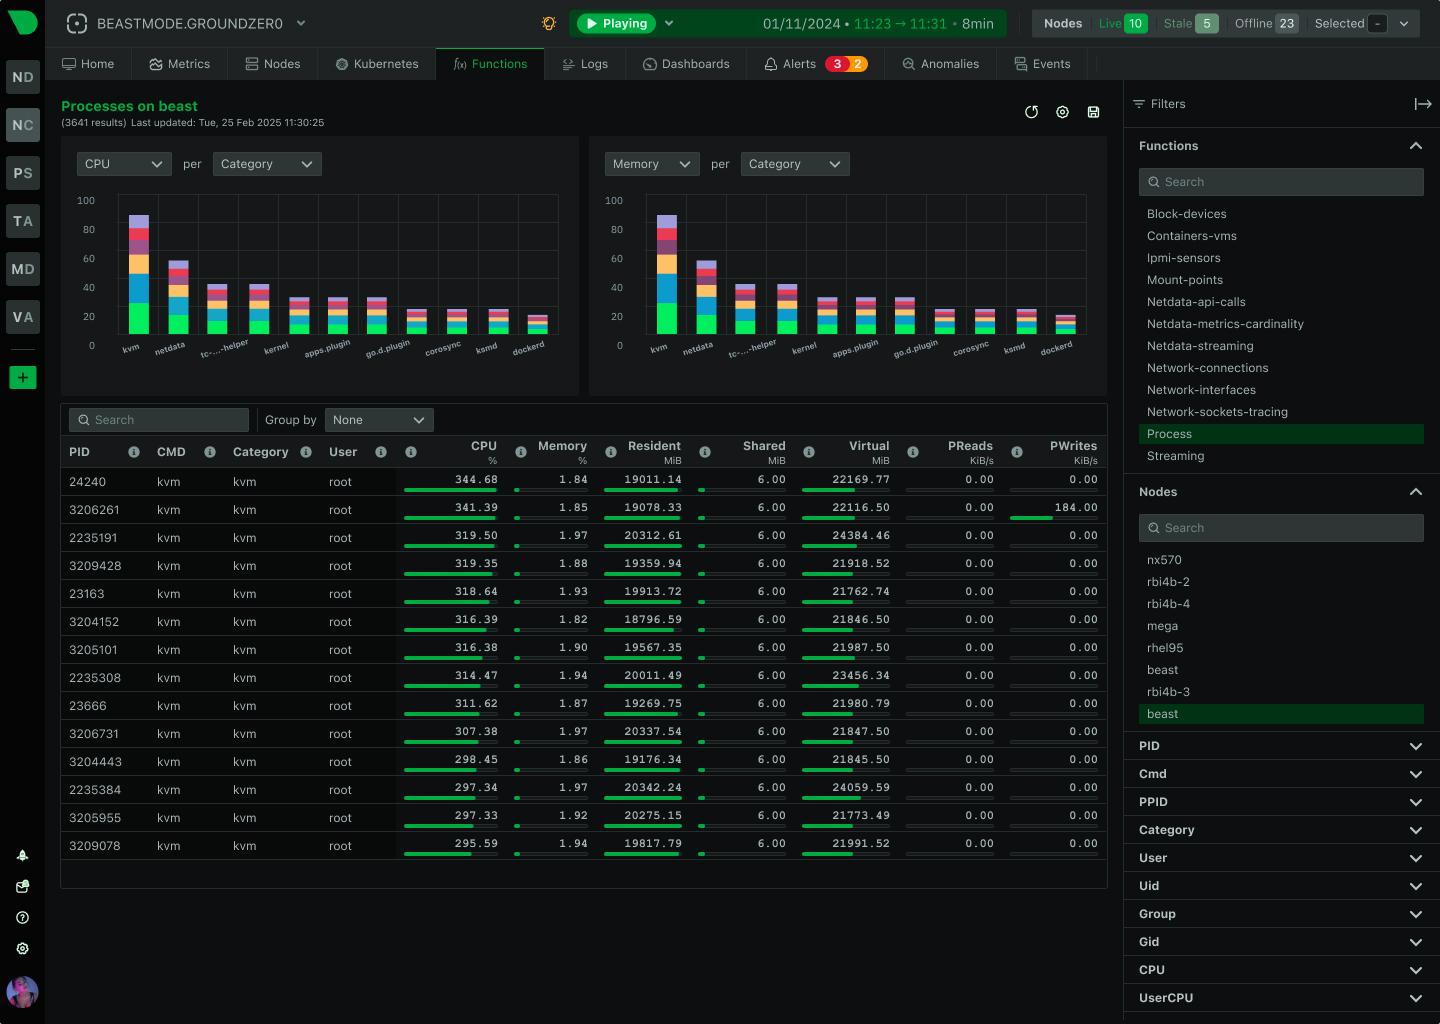
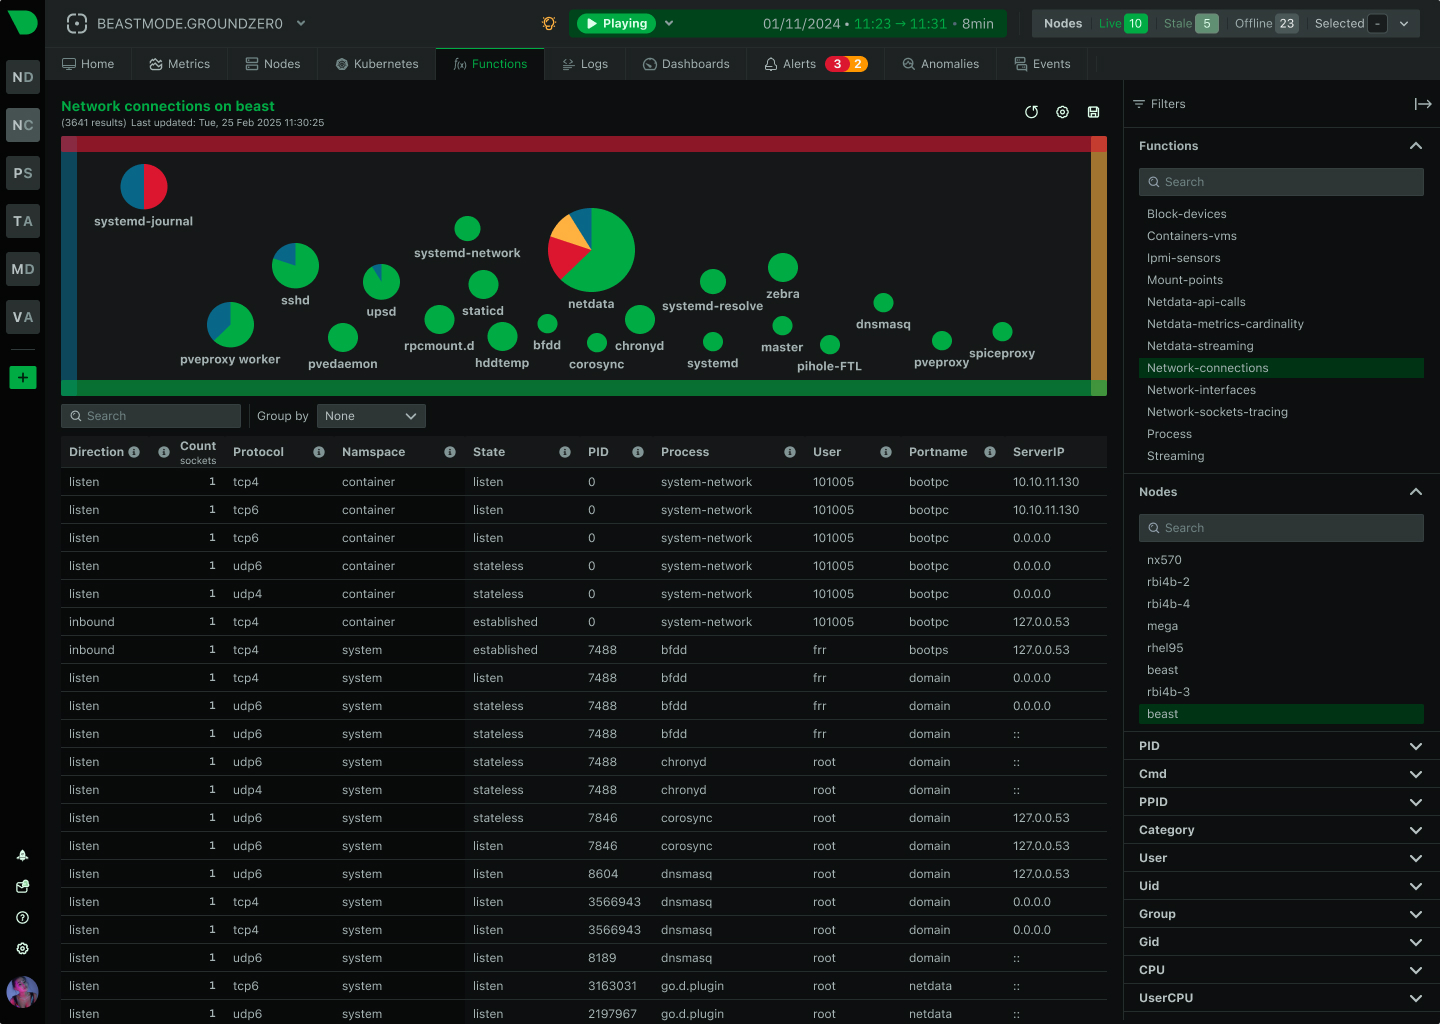
Troubleshoot Without SSH Access
80% faster MTTR with browser-based diagnostics
Try Netdata Functions

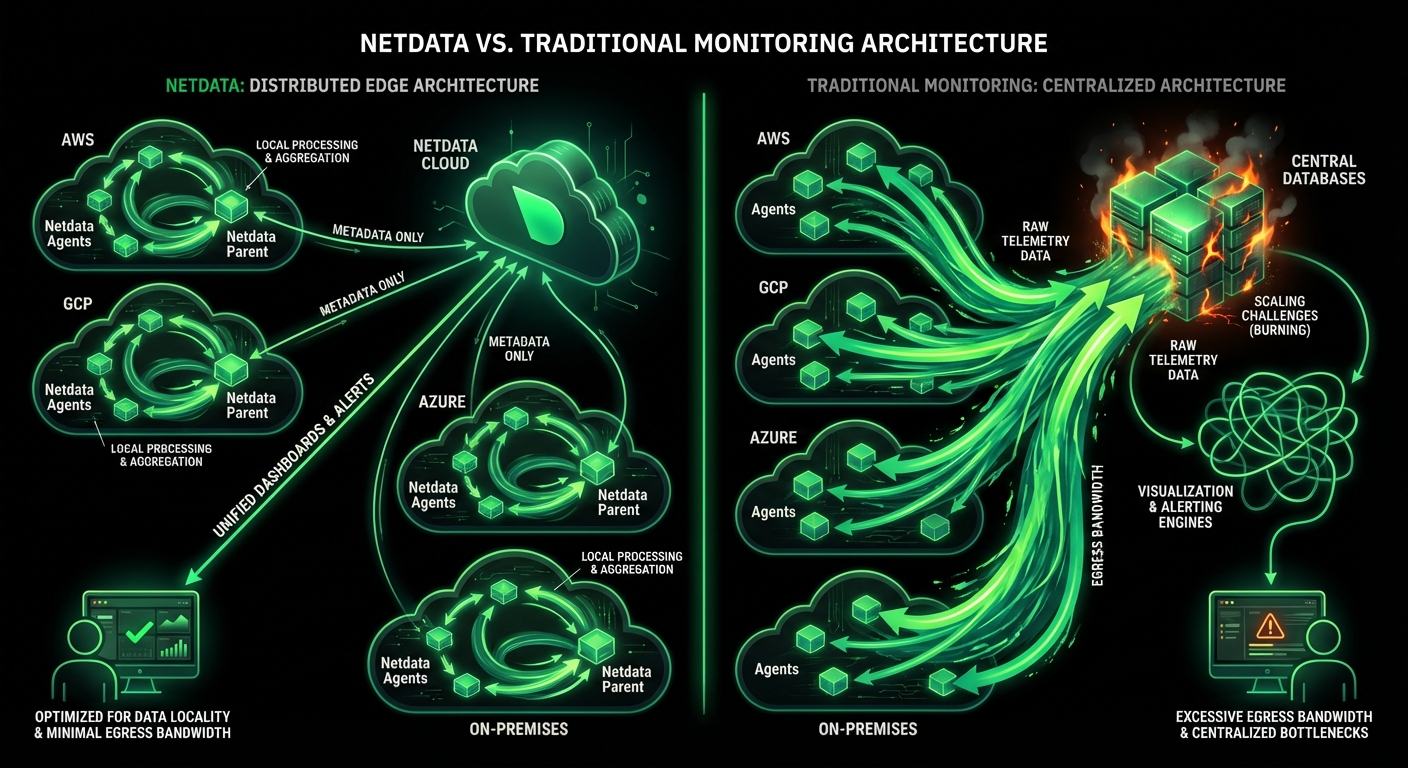
Netdata vs Traditional Retail Monitoring
Why Retail Teams Choose Netdata
Compare Netdata’s edge-native architecture against centralized monitoring platforms - see how per-second visibility, predictable pricing, and zero-configuration deployment transform retail operations.
Capability
Netdata
Traditional Monitoring
Data Collection Frequency
How often metrics are captured
✅ Per-Second
Captures 3-5 second POS issues
⚠️ 10-60 Seconds
Misses transient failures entirely
End-to-End Latency
Event to dashboard visibility
✅ Sub-2 Seconds
Real-time incident awareness
⚠️ 1-5 Minutes
Delayed detection costs revenue
Pricing Model
Cost structure and predictability
✅ Predictable Per-Node
Flat rate, no volume charges
❌ Volume-Based Pricing
Unpredictable, scales exponentially
Setup Time
Install to first dashboard
✅ Under 60 Seconds
Auto-discovery, zero config
⚠️ Days to Weeks
Manual configuration required
ML Anomaly Detection
Built-in unsupervised learning
✅ 18 Models/Metric
Consensus-based, 99% FP reduction
⚠️ Basic or Add-On
Often requires separate tools
Data Sovereignty
Where observability data lives
✅ On-Premises
PCI DSS compliant by design
❌ Cloud-Only
Data egress and compliance risk
Multi-Location Support
Distributed store management
✅ Spaces + Rooms
Physical and logical isolation
⚠️ Limited or Complex
Requires custom configuration
Log Management
Storage and retention costs
✅ Zero Pipeline
Direct journald access, unlimited
❌ Expensive Pipelines
Elasticsearch/Splunk infrastructure
Query Language
Skills required for analysis
✅ None Required
Point-and-click NIDL framework
⚠️ PromQL/SQL Required
Steep learning curve
Tool Consolidation
Number of products replaced
✅ 4-7 Tools
Metrics, logs, ML, alerts unified
⚠️ Fragmented Stack
Multiple separate tools typical
Retail Monitoring Across Every Channel
Monitor Every Transaction Point
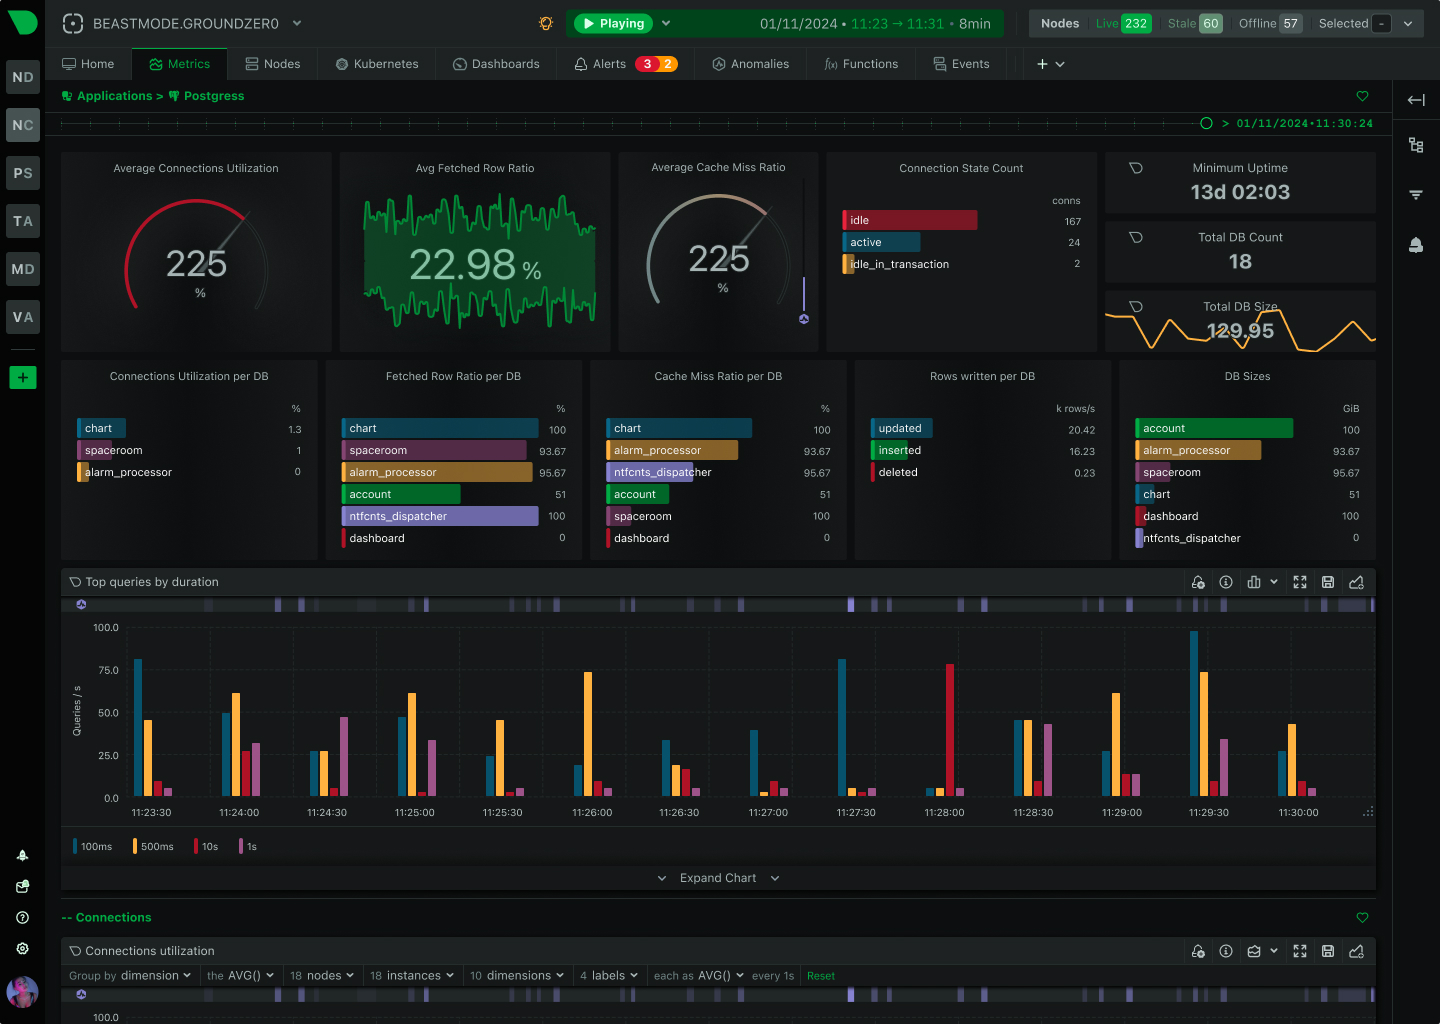
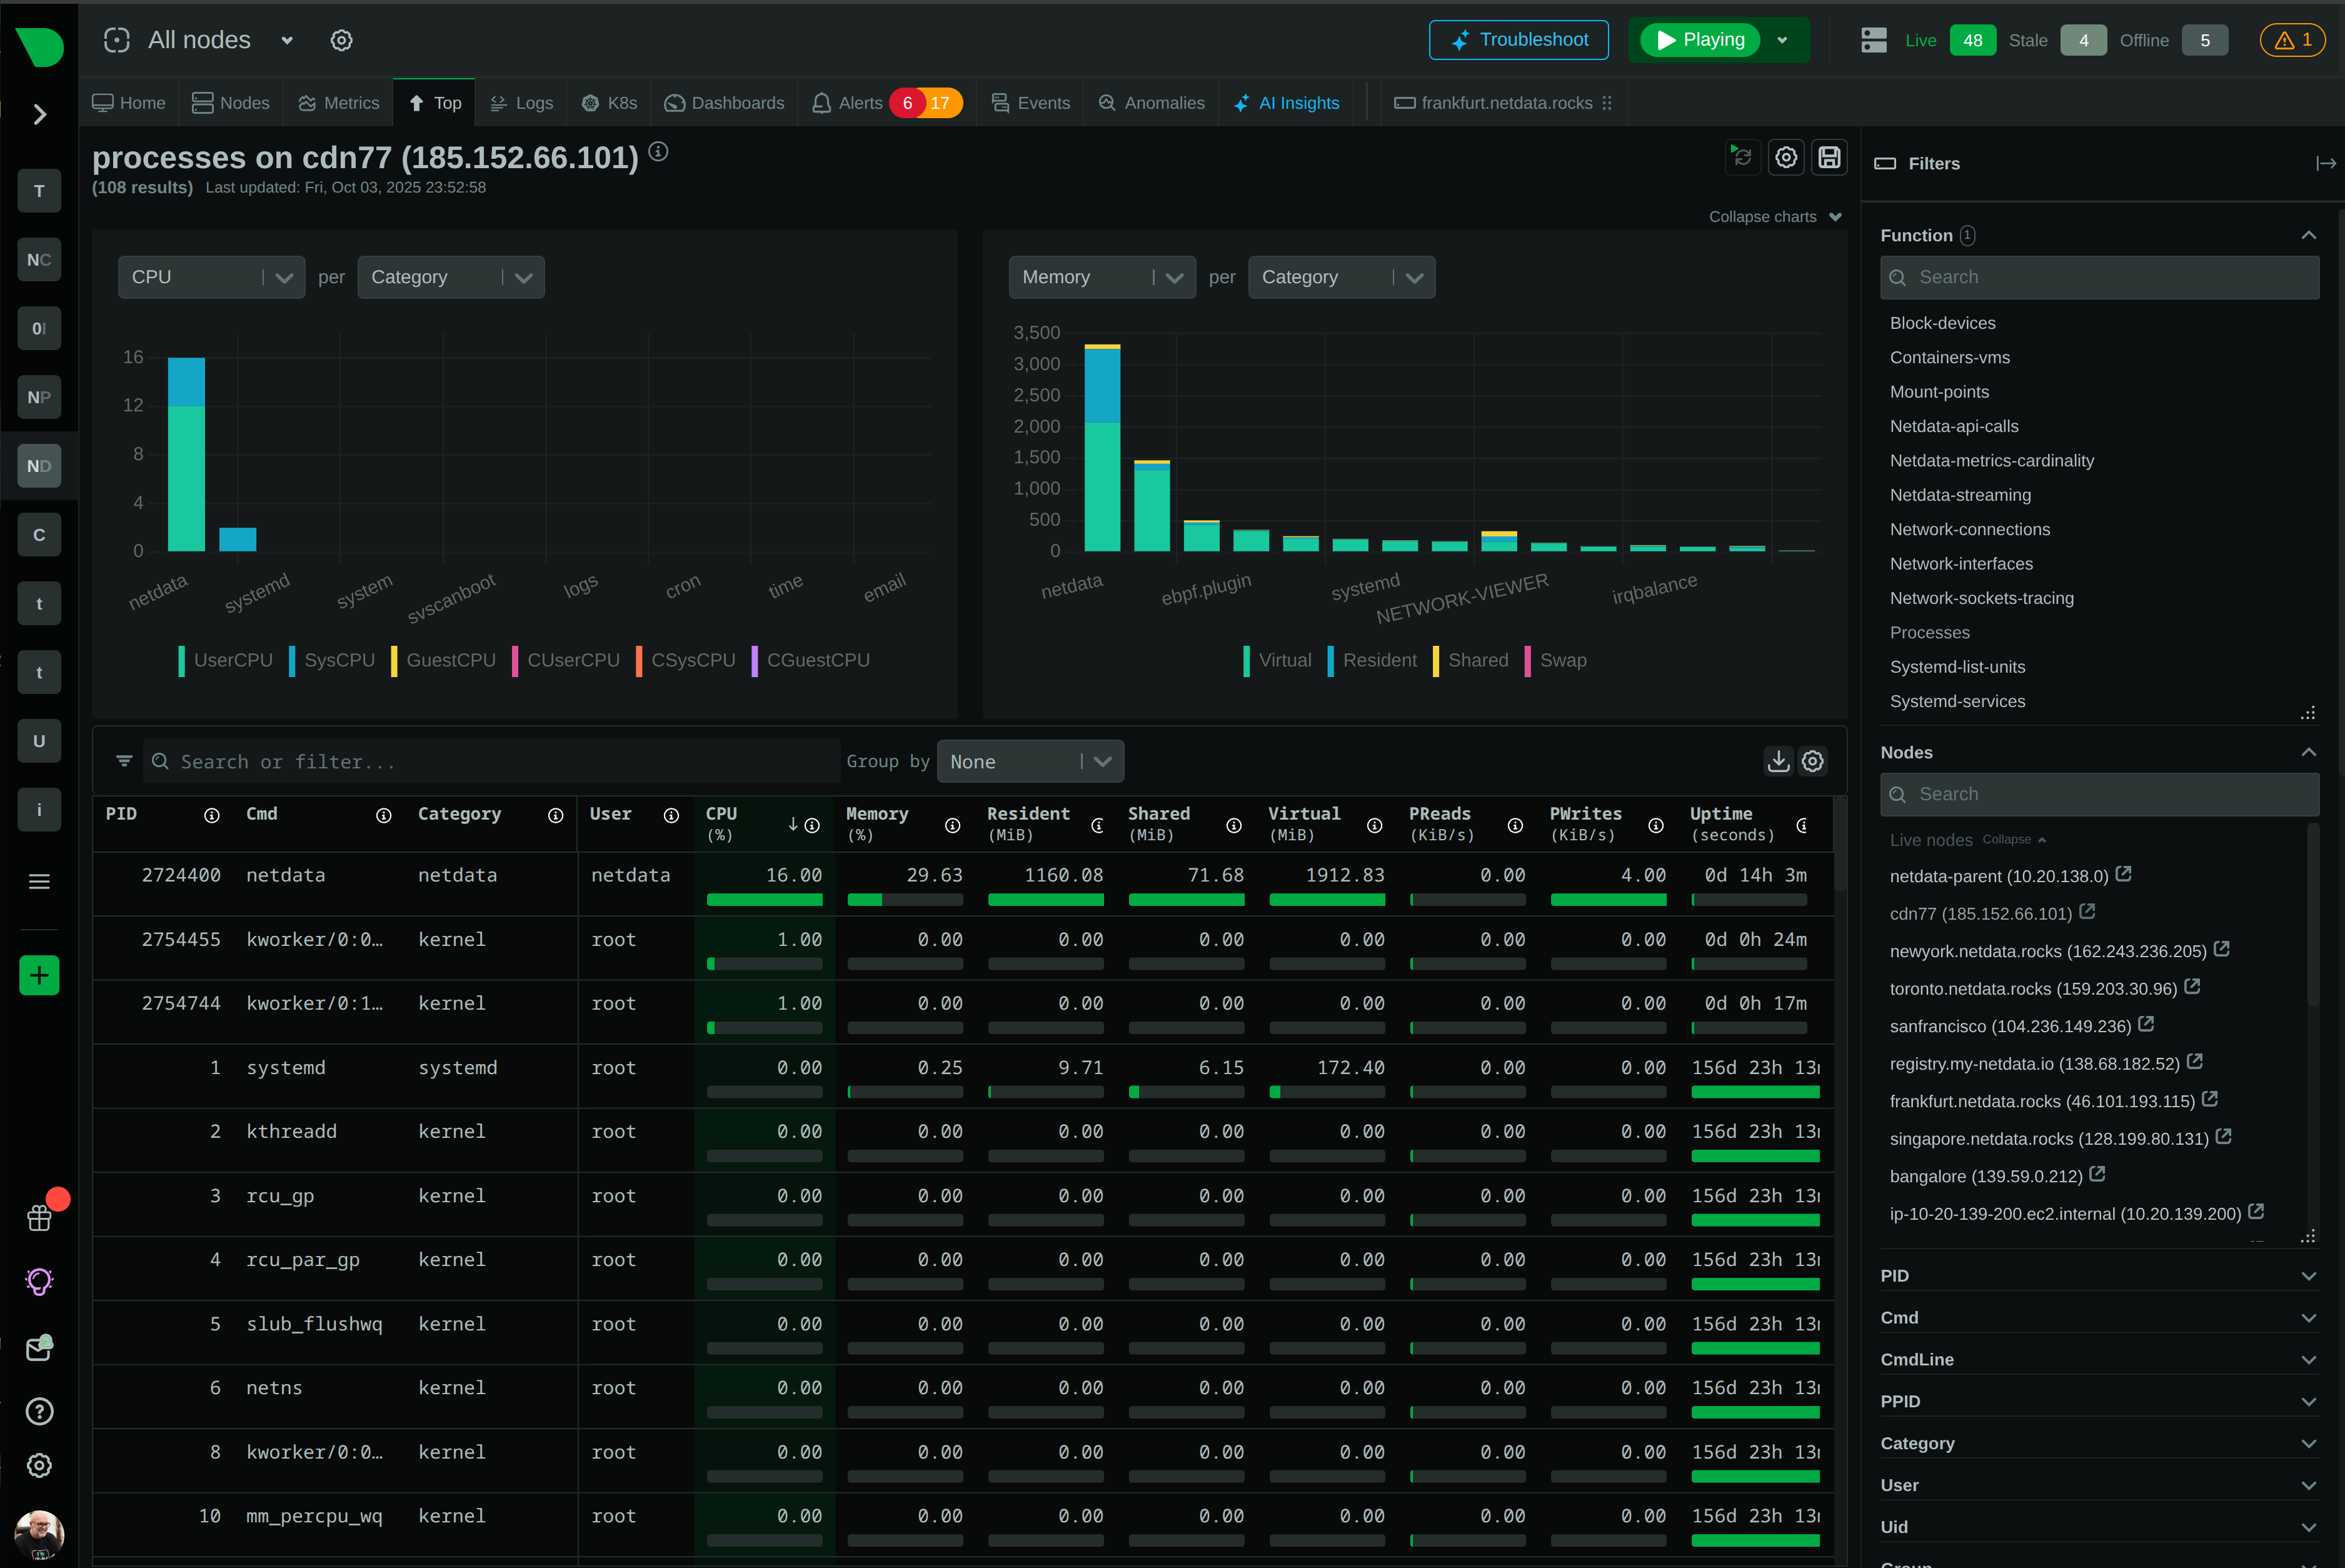
Complete visibility into POS infrastructure - Linux and Windows hosts, payment processing applications, database backends, and network connectivity. Per-second metrics capture brief freezes, payment delays, and resource exhaustion.
99.9% uptime SLA protection
Explore POS Monitoring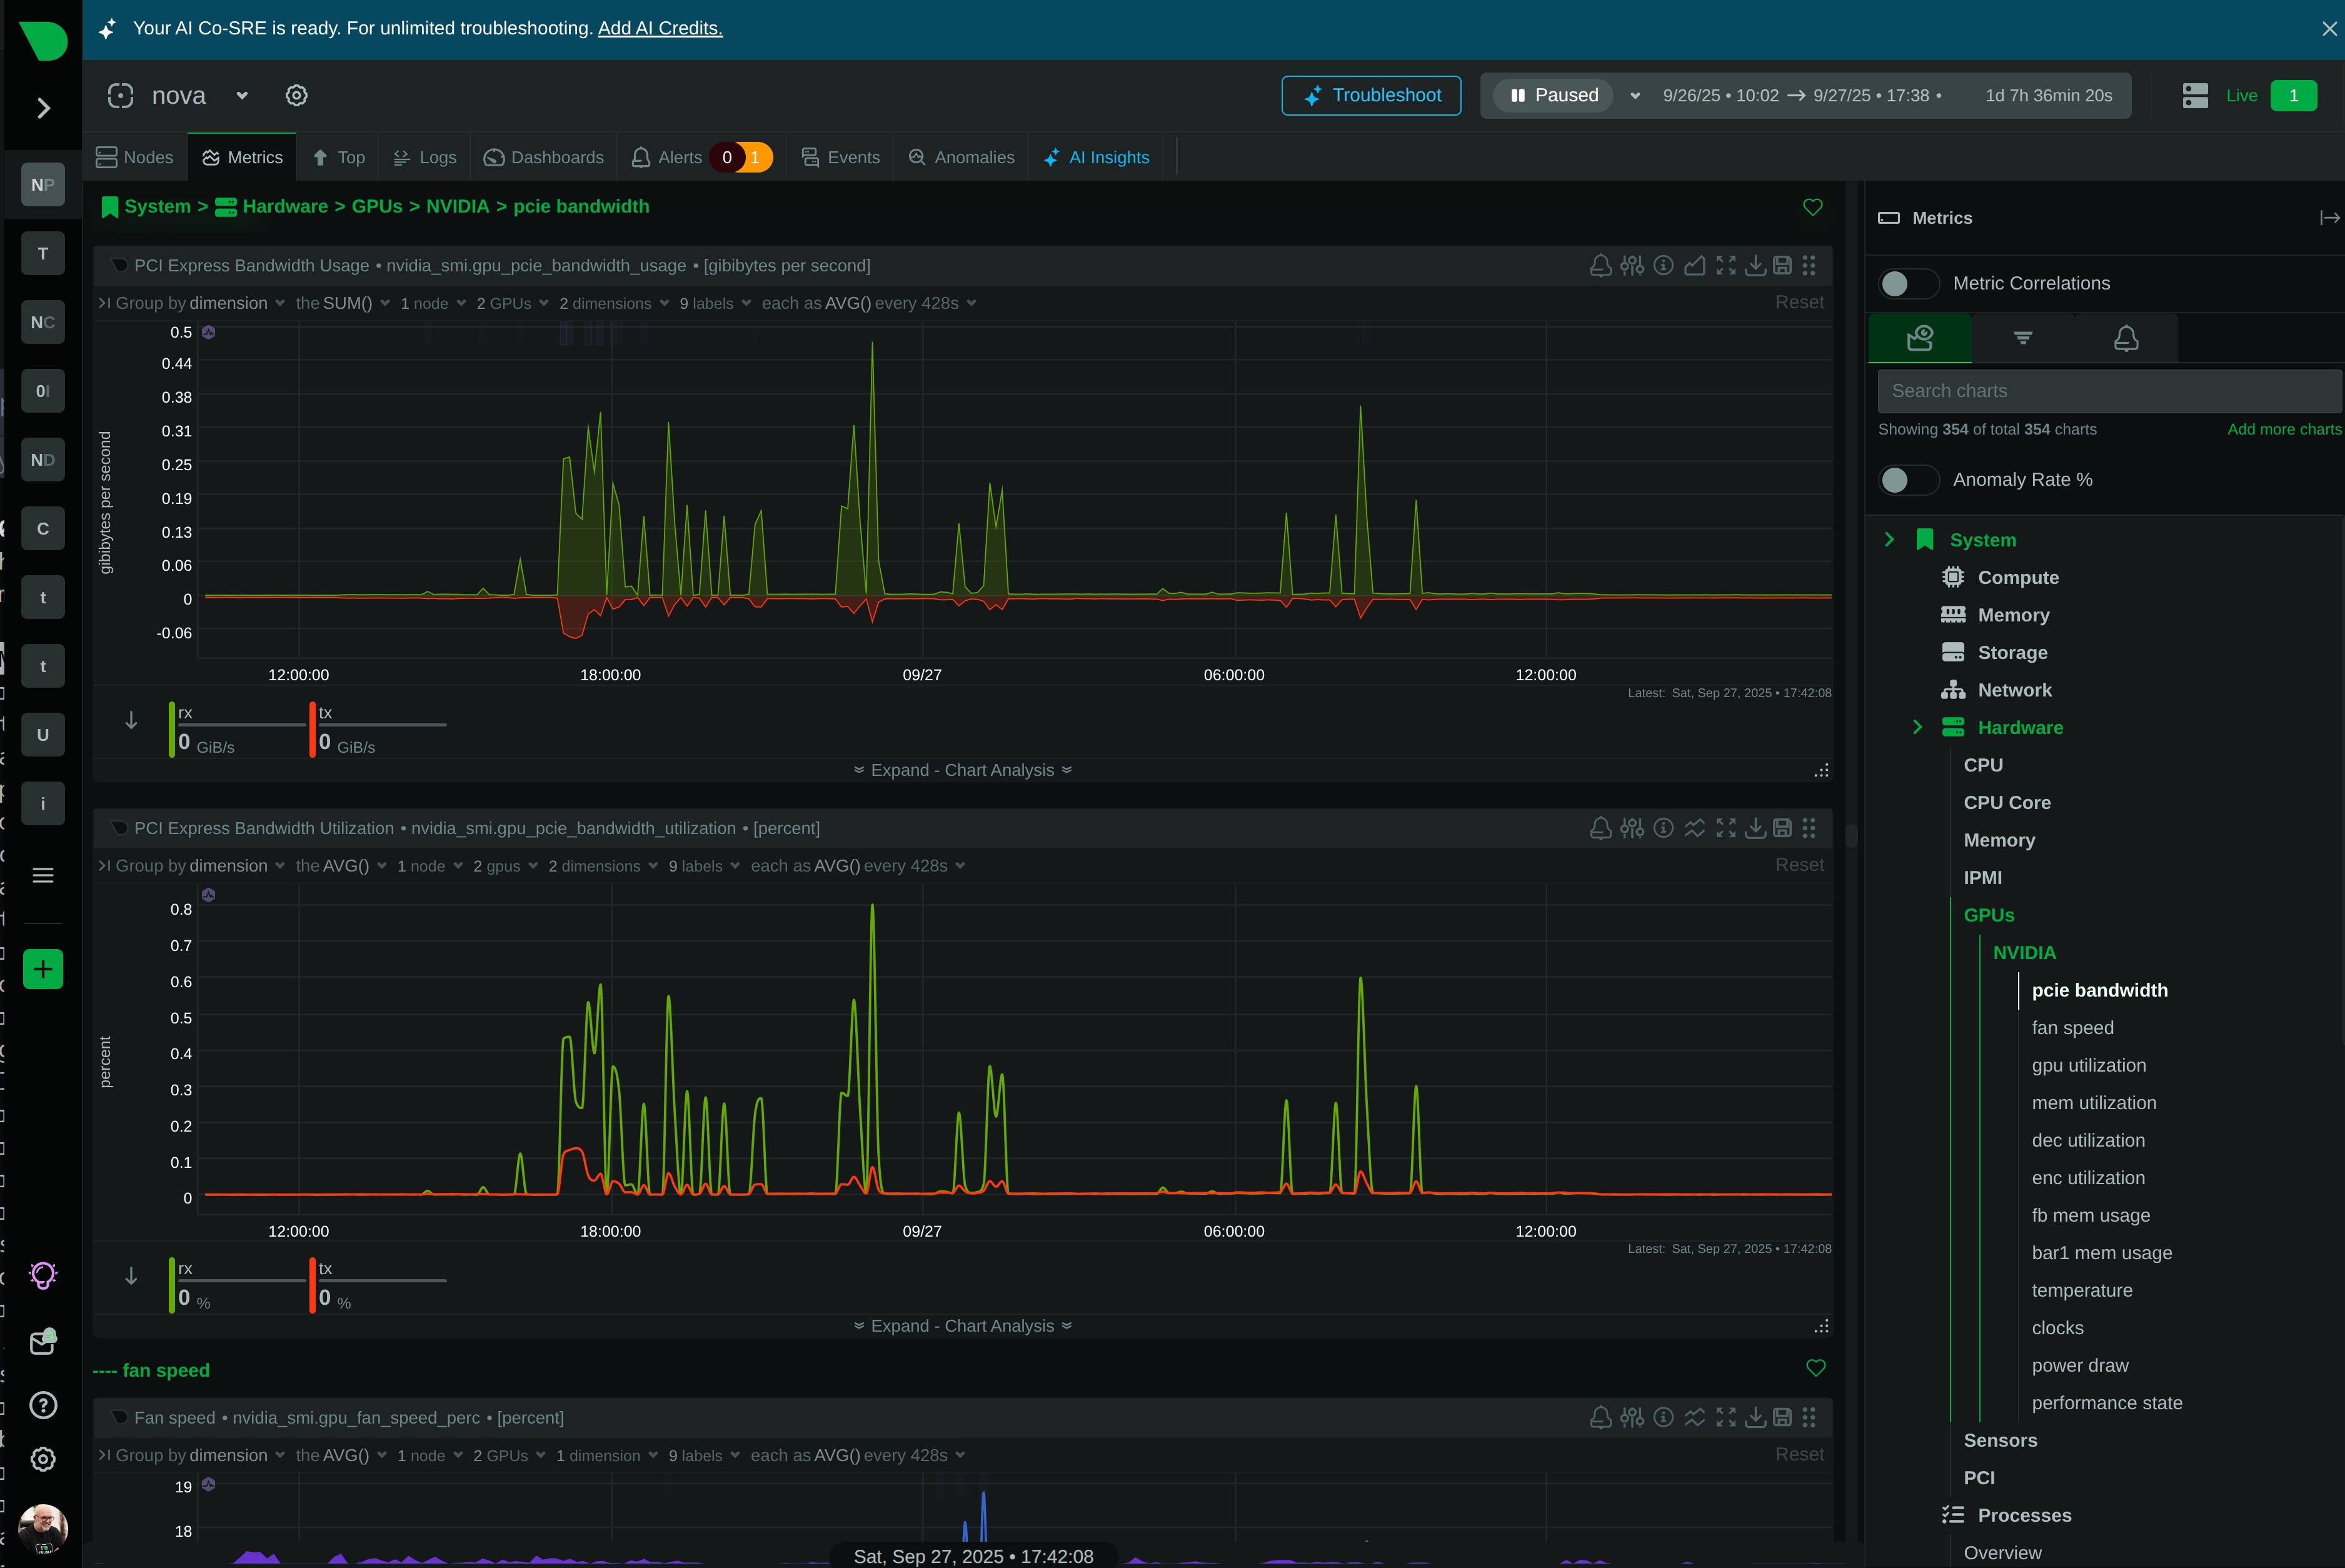
Why Retail Teams Choose Netdata
Six reasons Netdata transforms retail operations
Real-Time Revenue Protection
Per-second monitoring catches the 2-10 second POS freezes and payment delays that 30-second polling misses entirely, protecting your bottom line during peak hours.
Predictable Costs
Flat per-node pricing with no charges for metrics, logs, or users - monitor 1,000 stores with predictable costs versus unpredictable volume-based platforms. No surprise bills.
ML Anomaly Detection
18 unsupervised models per metric with consensus-based detection achieve 99% false positive reduction in anomaly detection - providing an additional signal for spotting unusual patterns.
Deploy in Minutes
Zero-configuration auto-discovery means install to first dashboard in under 60 seconds - no weeks of setup, no PromQL expertise, no manual tuning. Junior engineers get senior-level visibility.
PCI DSS Compliance Ready
Data sovereignty by design - all metrics and logs stay on-premises with unlimited retention. Encrypted communication, comprehensive audit trails, and security monitoring built for compliance.
Linear Scalability
Edge-native architecture scales from 5 stores to 5,000 without architectural changes - each location monitors independently while Parents aggregate for unified visibility across your entire footprint.

April 22, 2026
Nagios Plugins Collector: Run Your Existing Checks and Custom Scripts Inside Netdata
Netdata can now execute Nagios-compatible plugins and custom scripts in any language, tracking check states, execution metrics, and automatically charting performance data with built-in alerting.
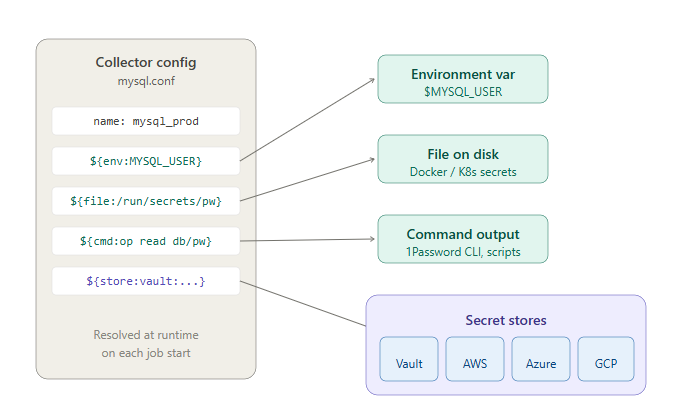
April 20, 2026
Secrets Management: Get Credentials Out of Your Netdata Configuration Files
Netdata now supports referencing secrets from environment variables, files, commands, and external secret stores like HashiCorp Vault, AWS Secrets Manager, Azure Key Vault, and GCP Secret Manager directly in collector configurations.
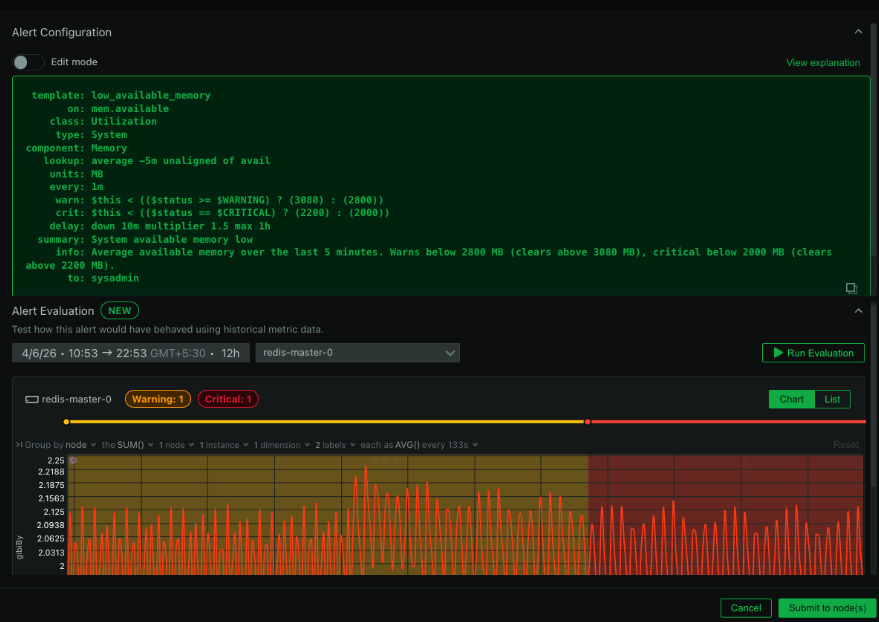
April 16, 2026
Smarter Alert Management: Test on Historical Data, Review Transitions, and Preview Silencing Schedules
Three new alerting capabilities in Netdata: evaluate alert definitions against historical metrics before deploying, review alert transition timelines, and preview recurring silencing schedules before saving.