









 Operations Centers & 24/7 NOC Teams
Maintain Enterprise Reliability with Lean Operations Teams
Netdata transforms 24/7 operations with per-second visibility, zero-configuration deployment, and AI-powered troubleshooting. Reduce MTTR by 80% and deliver consistent quality across all shifts - without specialized training or complex tools.


Built for Operations Excellence
Six capabilities that transform 24/7 operations
Instant Visibility
Per-second monitoring with sub-2-second latency reveals issues before they cascade. See problems as they happen, not minutes later.
AI-Powered Troubleshooting
Natural language queries and automated root cause analysis accelerate resolution. Junior engineers operate at senior-level effectiveness.
Intelligent Alerting
Component-level alerts with contextual information help teams focus on real issues. Pre-configured alerts for 400+ integrations provide immediate value.

Zero-Configuration Deployment
Production monitoring in under 60 seconds. No dashboards to build, no query languages to learn, no complex setup.
Skill-Independent Quality
Same powerful visibility for all team members regardless of experience. Consistent operations across all shifts.
Predictable Economics
Predictable per-node pricing with 90% cost reduction versus traditional platforms. No surprise bills, no metrics volume charges.
Trusted by operations teams worldwide








































Transform Your Operations Center
Improve Alert Quality
400+ pre-configured alerts
Learn about intelligent alerting


Accelerate Incident Resolution
80% MTTR reduction
Explore AI troubleshooting


Empower Every Team Member
Zero training required
See algorithmic dashboards

Replace SSH with Browser-Based Debugging
Console replacement
Discover Netdata Functions

Maintain Data Sovereignty
100% data sovereignty
Review security design
Scale Without Complexity
Linear scalability
Understand scalability


Operations Center Monitoring Comparison
Netdata vs Traditional NOC Tools
See how Netdata solves the critical challenges facing 24/7 operations centers
Capability
Netdata
Traditional Monitoring
Data Granularity
Collection frequency and visibility
✅ Per-Second
Catch transient issues others miss
⚠️ Per-Minute or Worse
Blind to most transient incidents
Time to Production
Setup and deployment speed
✅ Under 60 Seconds
Zero-configuration deployment
❌ 3-6 Months
Complex setup and tuning
Alert Quality
Actionability and context
✅ Advanced
Component-level alerts with context
❌ Basic
Generic threshold-based alerts
Skill Requirements
Training and expertise needed
✅ Zero Training
Point-and-click interface
❌ Weeks of Training
PromQL, LogQL, complex queries
MTTR Performance
Average incident resolution time
✅ 80% Reduction
AI-powered root cause analysis
⚠️ 30-60 Minutes
Manual investigation required
Cost Structure
Pricing predictability
✅ Per-Node Flat Rate
No metrics volume charges or surprises
❌ Volume-Based Pricing
Unexpected cost spikes common
Tool Consolidation
Number of platforms needed
✅ Single Platform
Metrics, logs, traces, diagnostics unified
❌ 8 Tools Average
Fragmented visibility
Data Sovereignty
Where observability data resides
✅ 100% On-Premises
Complete control, supports compliance
⚠️ Centralized Storage
Egress charges and risks
Shift Consistency
Quality across team members
✅ Skill-Independent
Same visibility for everyone
⚠️ Experience-Dependent
Senior engineers required
Operations Center Capabilities
See Problems as They Happen
Per-second monitoring with sub-2-second latency reveals transient issues invisible to minute-based tools. Catch microbursts, brief stalls, and cascading failures before they impact users.
10-60× faster than traditional monitoring
Learn about real-time monitoring
Operations Center Success Factors
Six capabilities that transform 24/7 operations effectiveness
Instant Incident Detection
Per-second monitoring catches transient issues that minute-based tools miss entirely. See problems as they happen, not after they cascade.

AI-Powered Resolution
Automated root cause analysis and natural language troubleshooting accelerate resolution. Junior engineers operate at senior-level effectiveness.

Actionable Alerts Only
Component-level alerts with contextual information help teams focus on real issues requiring immediate action.

Consistent Quality
Same powerful visibility for all team members regardless of experience. Maintain excellence across all shifts without specialized training.

Rapid Deployment
Production monitoring in under 60 seconds with zero configuration. No dashboards to build, no query languages to learn.

Predictable Economics
Predictable per-node pricing with 90% cost reduction versus traditional platforms. No surprise bills, no metrics volume charges.

August 17, 2026
Chart Annotations For Deploys, Incidents & Changes
Netdata Cloud now lets you pin notes to a specific moment on a chart — deployments, incidents, config changes, maintenance windows — shared across your whole Space and one click away from a root-cause correlation.
May 12, 2026
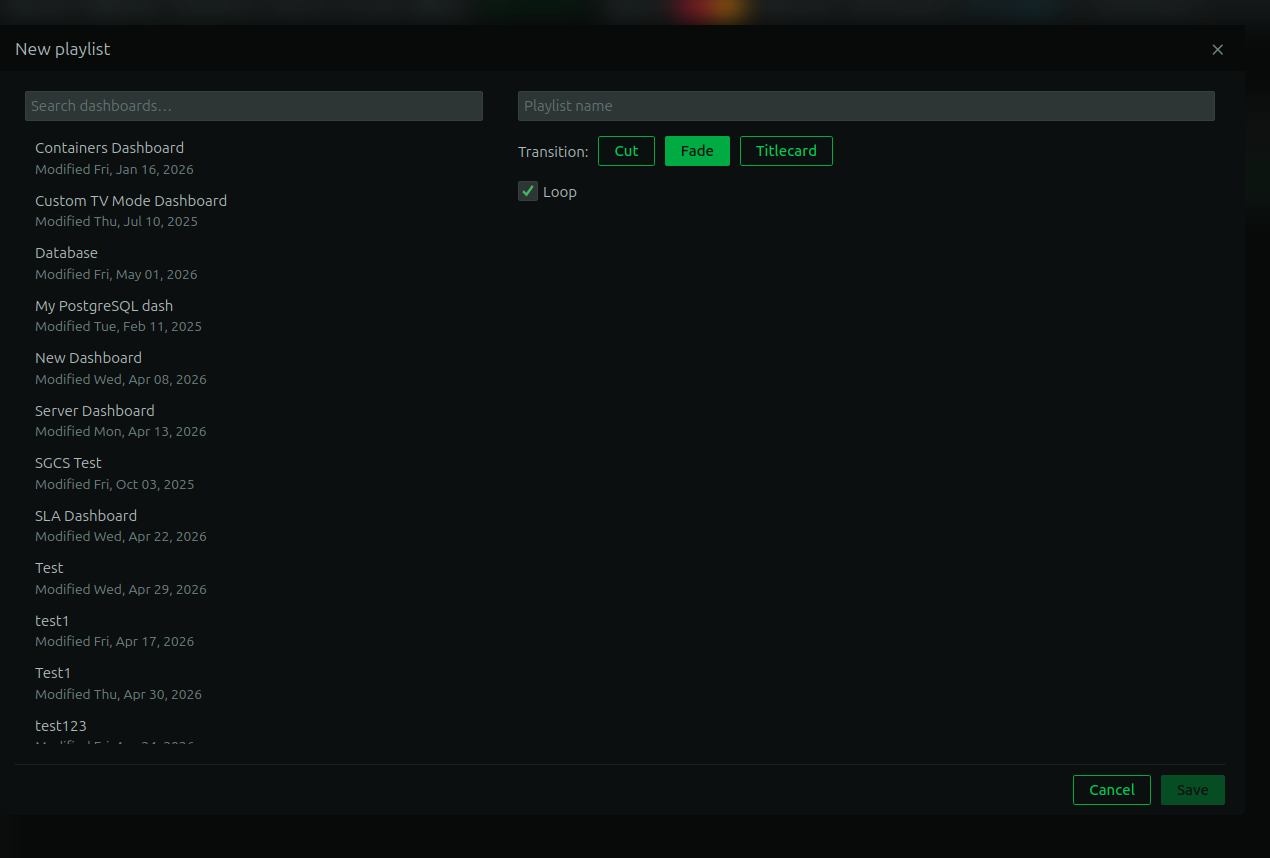
Dashboard Playlists: Cycle Through Dashboards in TV Mode
Netdata TV mode now supports playlists. Pick a sequence of dashboards, set the rotation interval, and let your wall display cycle them. Try it today!
April 14, 2026
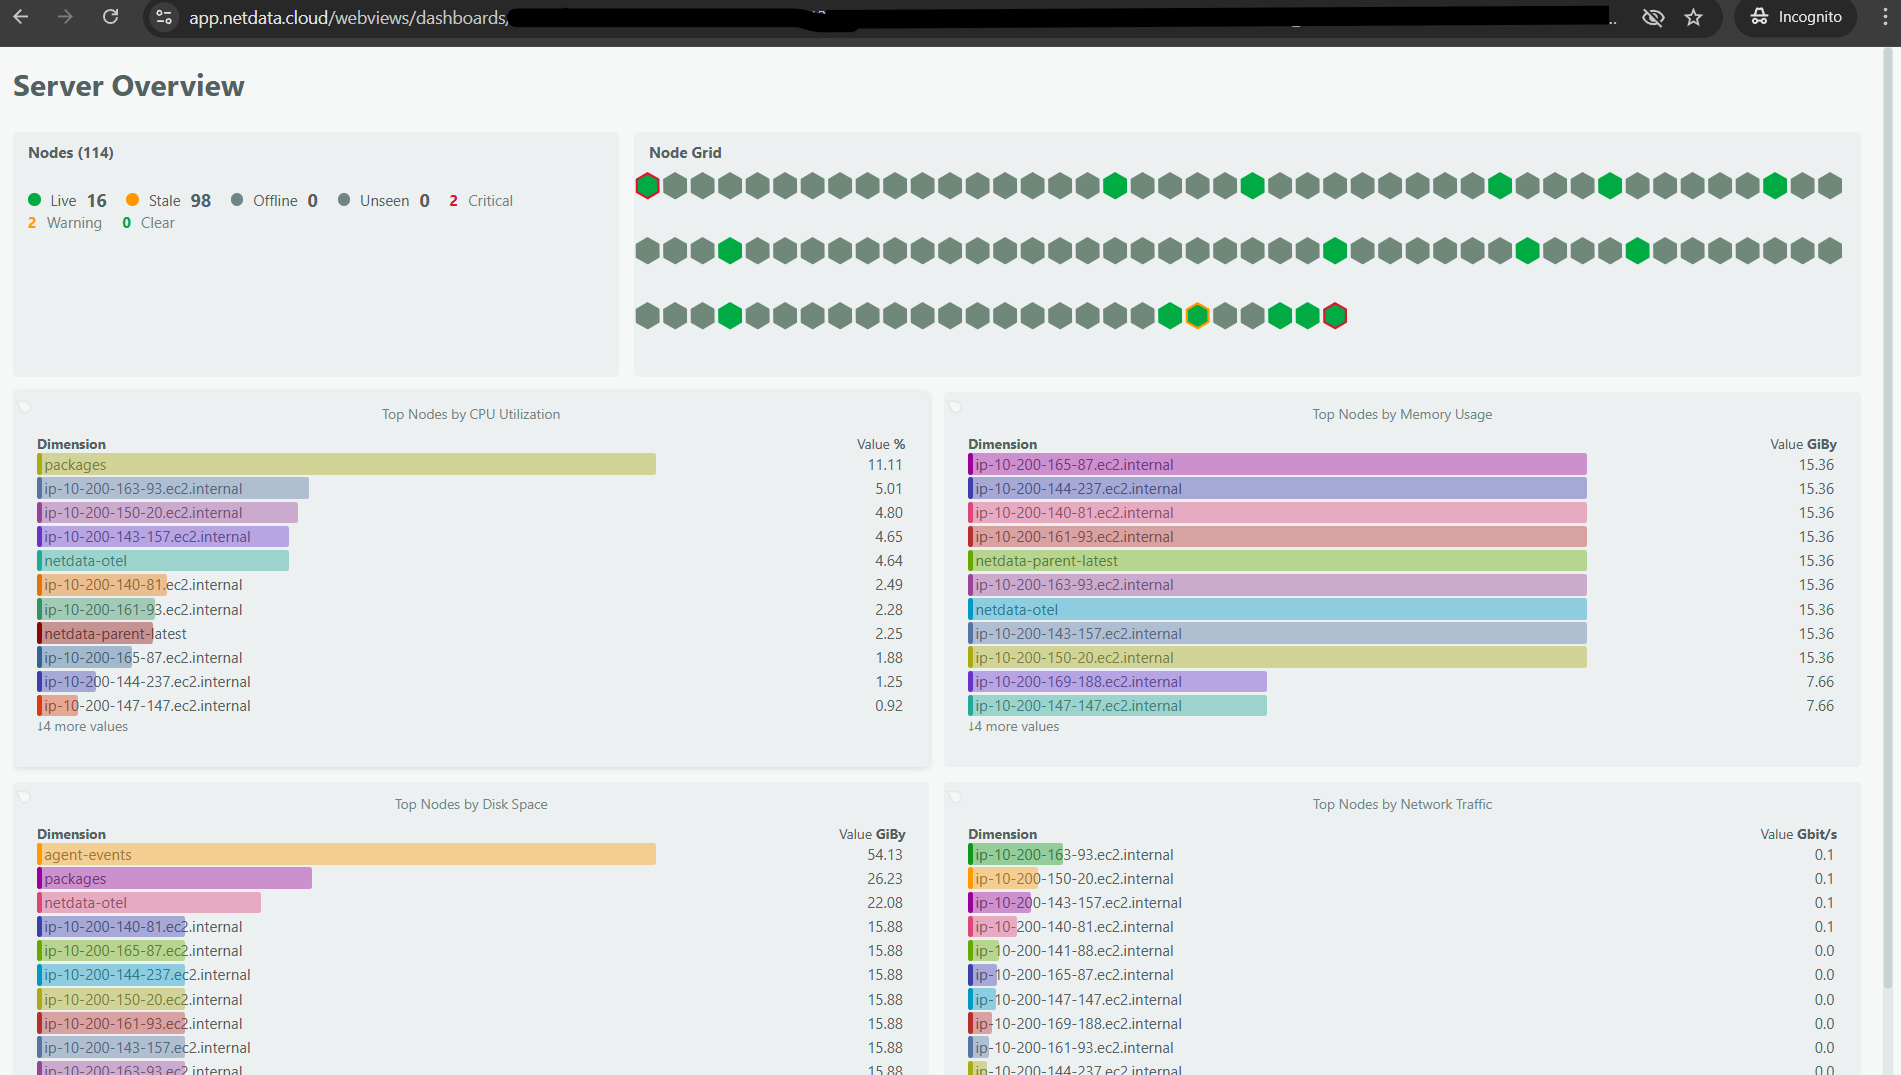
TV Mode: Put Your Dashboards on the Big Screen
Display any Netdata custom dashboard on a wall-mounted screen, NOC display, or war room TV with a secure, shareable URL that works without logging in.