







 IoT & Edge Fleet Monitoring
See Every Sensor, Gateway, and Edge Device in Real Time
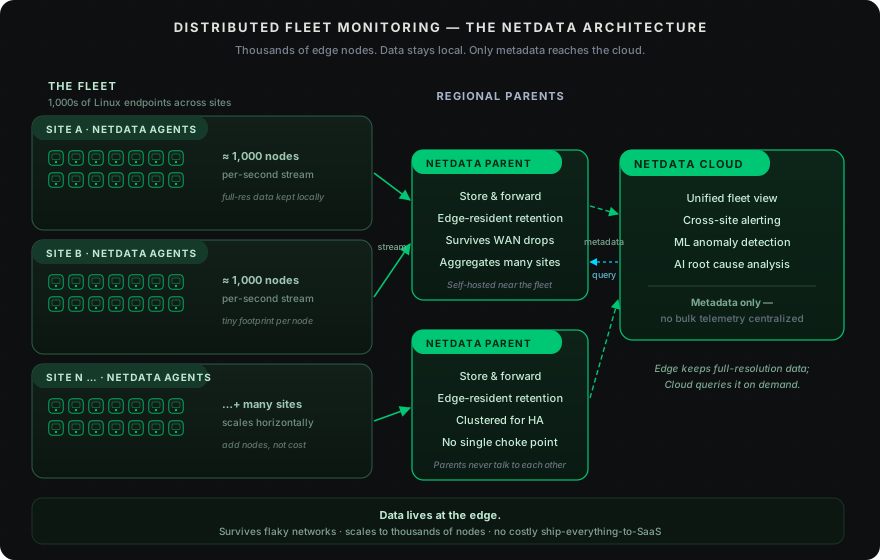
Monitor thousands of IoT gateways and edge devices with per-second visibility, ML-powered anomaly detection, and 90% cost reduction. Netdata’s edge-native architecture keeps data on each device and streams only what is needed - so the fleet stays observable even on flaky field networks, without the complexity or unpredictable bills.

Transform IoT Operations with Intelligence at the Edge
Six capabilities that eliminate the complexity, cost, and blind spots of traditional IoT monitoring
Instant Device Visibility
Auto-discover sensors, gateways, and edge devices across your network. Per-second metrics from every device without manual configuration or complex setup.
ML Anomaly Detection
18-model consensus anomaly detection achieves 99% false positive reduction. Spot sensor drift, connectivity issues, and performance degradation instantly.
Predictable IoT Economics
Predictable per-node pricing with no charges for metrics volume, Logs Monitoring (querying logs in place), users, data retention or containers. No surprise bills from metrics volume spikes. 90% cost reduction versus cloud platforms.
Multi-Vendor Harmony
Unified monitoring across all device types and protocols. SNMP, HTTP, OpenTelemetry, and custom sensors - all in one platform with consistent dashboards.

Edge Intelligence
Process and analyze data where it’s generated. Minimal bandwidth usage, instant insights, and operation during network disruptions.
Complete Data Control
All observability data stays on your infrastructure. Zero metric egress to cloud. Supports GDPR, HIPAA, and regional data residency requirements.
Trusted by organizations monitoring millions of IoT devices worldwide








































Solve the Hardest IoT Monitoring Challenges
Track Every Device Without Breaking the Budget
90% cost reduction vs. cloud platforms
See Pricing


Detect Problems Before They Cascade
80% faster MTTR
Explore AI Features


Monitor Thousands of Devices Without Complexity
100K+ device deployments
View Architecture

Operate Reliably at the Edge
Zero data loss during outages
Learn About Edge Architecture


Platform Comparison
Netdata vs. Traditional IoT Monitoring
See how Netdata’s edge-native architecture solves the fundamental limitations of centralized IoT platforms
Capability
Netdata
Traditional Platforms
Data Granularity
✅ Per-Second
Catch transient issues and microbursts
⚠️ 15-60 Seconds
Miss transient IoT anomalies
Per-Device Metrics
✅ Native Support
Track individual sensor performance
⚠️ Limited
Often requires custom implementation
ML Anomaly Detection
✅ 99% FP Reduction
18-model consensus significantly reduces noise
⚠️ Basic
Static thresholds or limited ML
Cost Model
✅ Per-Node Pricing
No per-metric charges, predictable bills
⚠️ Per-Metric/Volume
Unpredictable, exponential costs
Data Sovereignty
✅ Edge Storage
All data stays on-premises
⚠️ Cloud Dependent
Data egress to vendor infrastructure
Setup Time
✅ 60 Seconds
Auto-discovery, zero configuration
⚠️ Days to Weeks
Manual setup, complex tuning
Scalability
✅ Linear Scaling
100K+ devices proven
⚠️ Challenging
Complexity increases at scale
Network Resilience
✅ Offline Operation
Local buffering, automatic replay
❌ Cloud Dependent
Blind during connectivity loss
Resource Usage
✅ <5% CPU, 150MB RAM
Minimal mode: <1% CPU, <100MB
⚠️ Higher Overhead
Heavier agent requirements
Comprehensive IoT Observability Across Your Stack
Monitor Every Sensor Type
Temperature, humidity, motion, pressure - Netdata auto-discovers and monitors all sensor types. Native support for 1-Wire, lm-sensors, IPMI, and custom protocols. Per-second readings with ML anomaly detection catch sensor drift and failures instantly.
Native sensor support with zero configuration
View Sensor Integrations


IoT Monitoring Excellence
Key capabilities that make Netdata the superior choice for IoT observability

Automatic Device Discovery
SNMP network scanning finds sensors, gateways, and network devices automatically. Virtual nodes for each device with instant dashboards.

ML Anomaly Detection
18 unsupervised models per metric detect sensor drift, connectivity issues, and performance degradation with 99% false positive reduction.

Per-Second Granularity
Catch transient issues and microbursts invisible to 30-60 second monitoring. See exactly when problems start and how they propagate.

Multi-Protocol Support
SNMP, HTTP, StatsD, OpenTelemetry, Prometheus - unified monitoring across all device types without vendor-specific tools.

Edge-Native Architecture
Process data where it’s generated. Minimal bandwidth, instant insights, operation during network disruptions, complete data sovereignty.

Transparent Economics
Predictable per-node pricing with no charges for metrics volume, Logs Monitoring (querying logs in place), users, data retention or containers. No surprise bills from metrics volume spikes. 90% cost reduction versus cloud platforms.

Data Sovereignty
All observability data stays on your infrastructure. Zero metric egress to cloud. Supports GDPR, HIPAA, regional requirements.

Team Collaboration
Role-based access control, SSO integration, and shared dashboards. Segment infrastructure by team, location, or project for isolated visibility.

AI-Powered Insights
Natural language queries, automated root cause analysis, and capacity planning reports. AI that understands your IoT infrastructure context.

October 5, 2026
Distributed Tracing In Netdata: OpenTelemetry Traces
Netdata now ingests OpenTelemetry traces over OTLP on the same Agent that collects your metrics and logs. Spans are stored and indexed on your own infrastructure and explored in the new Traces tab in Netdata Cloud.

October 3, 2026
Who Built This Dashboard, and Are They Still Here?
Your server monitoring dashboard shouldn't be a DIY project. Netdata charts every metric automatically — no query languages, no dashboards to build, ever.

September 8, 2026
Infrastructure Knowledge For AI Root Cause Analysis
Netdata AI now learns your infrastructure the way a new SRE would: a shared context document your team writes, and a memory layer built from conversations that gets more accurate every time you use it.