


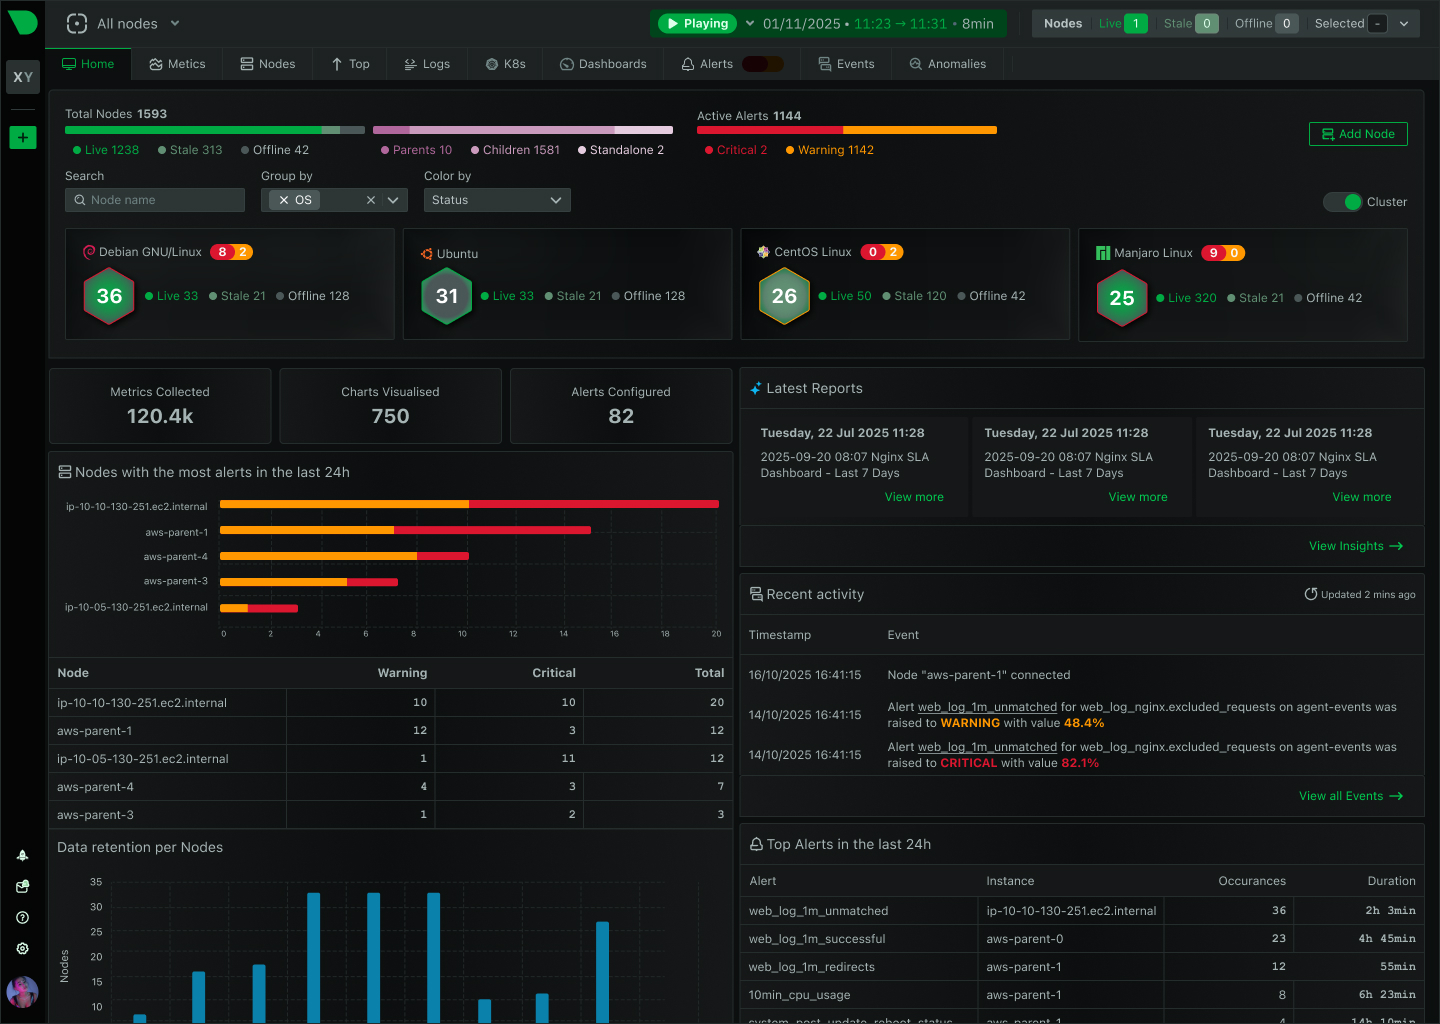
Ship Faster With Complete Infrastructure Visibility
Netdata provides DevOps teams with per-second monitoring, ML-powered anomaly detection, and AI troubleshooting - all in a single platform that deploys in 60 seconds. Monitor everything from bare metal to Kubernetes without configuration, query languages, or surprise bills.

Built for Modern DevOps Workflows
Everything you need to monitor, troubleshoot, and optimize your infrastructure
Deploy in 60 Seconds
One-line installation with instant auto-discovery. Zero configuration required - start monitoring immediately with pre-built dashboards and 400+ health checks.
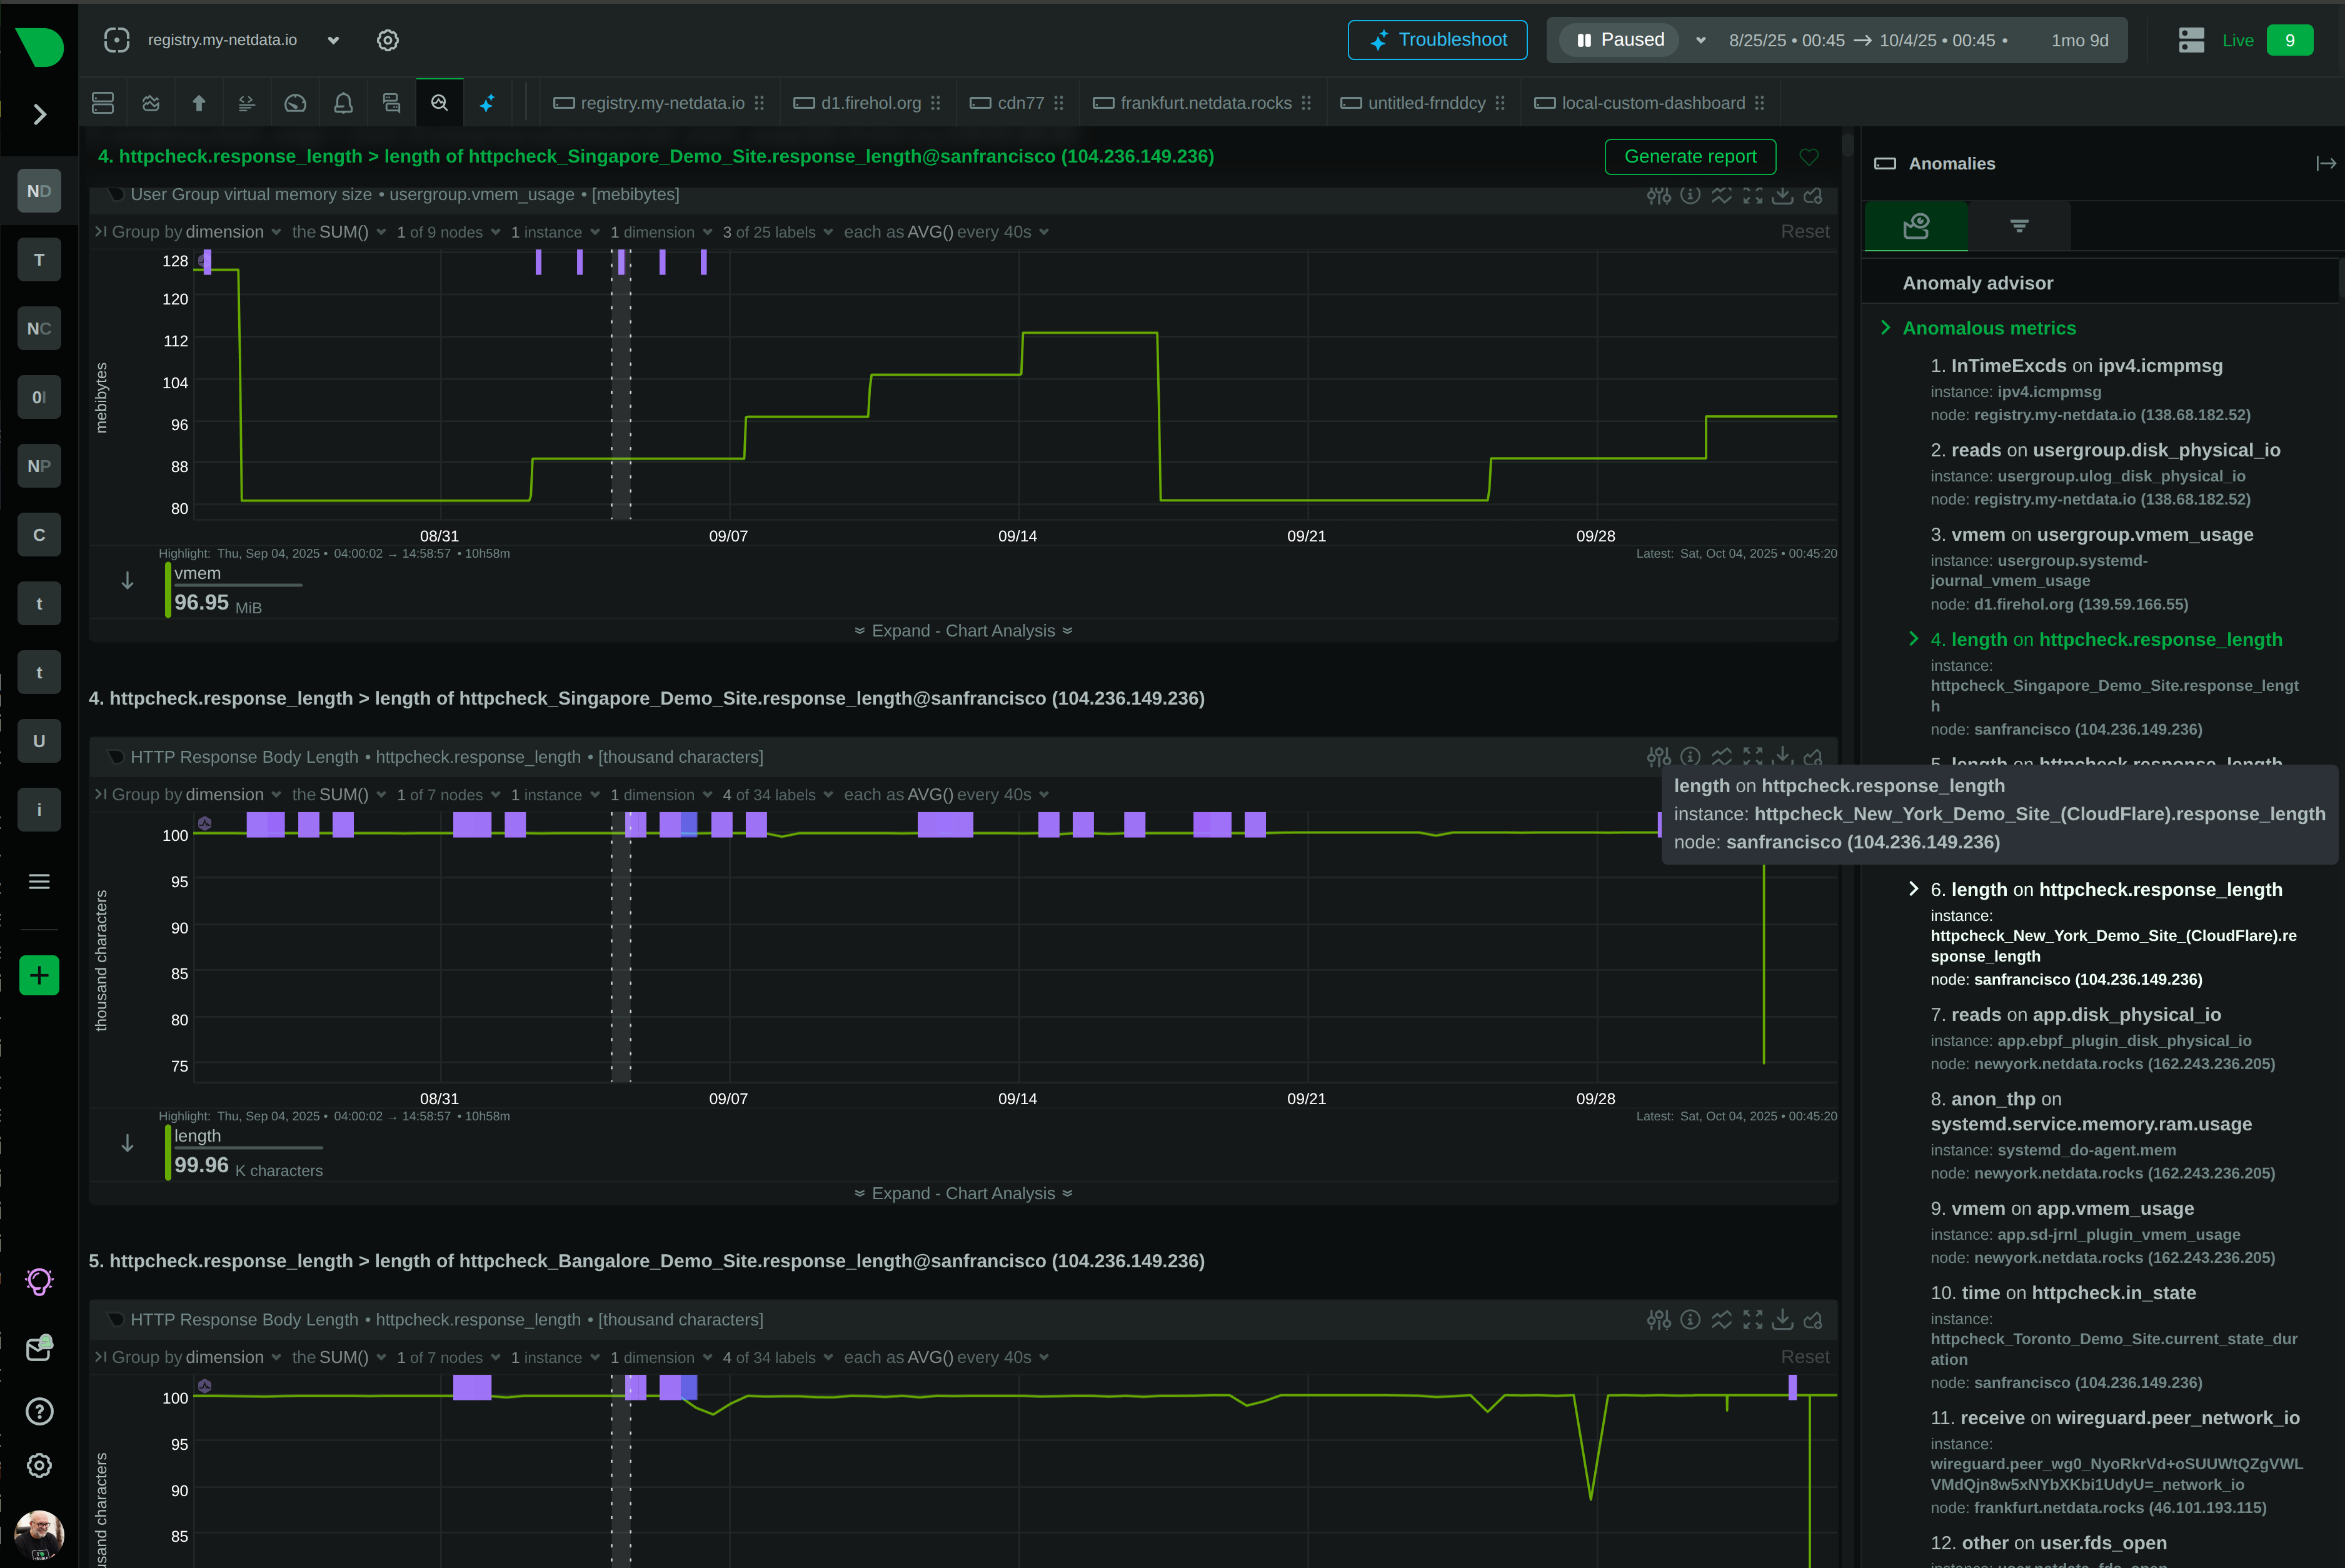
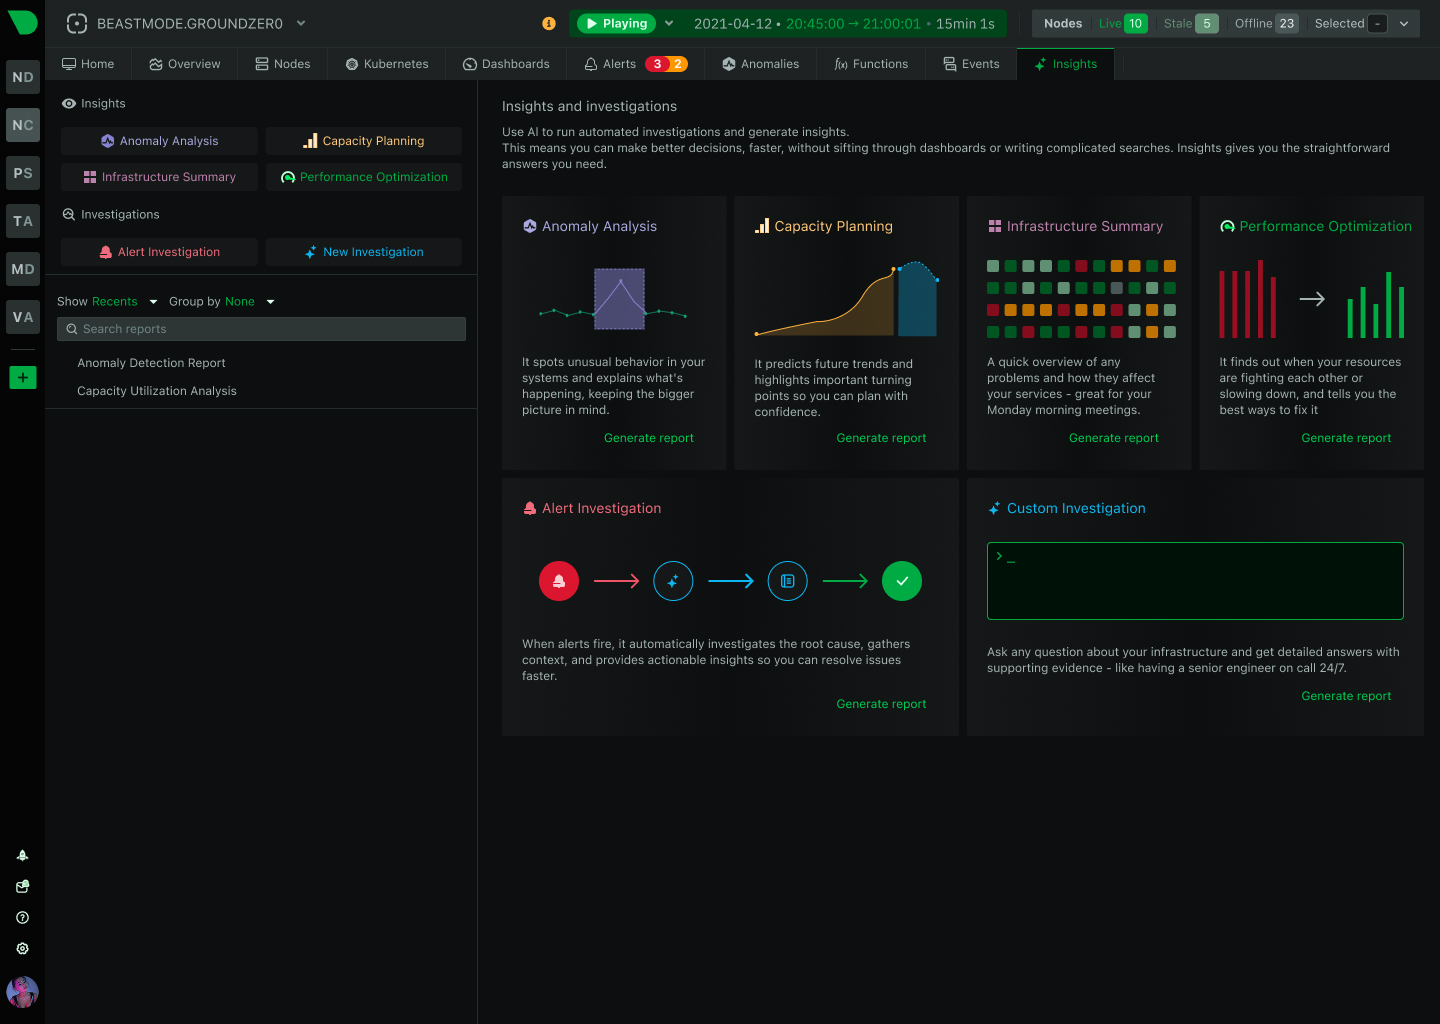
ML Detects Every Anomaly
18 machine learning models per metric with 99% false positive reduction. Catch issues before they cascade into outages.
90% Cost Reduction
Per-node pricing with unlimited metrics and logs. No surprise bills from data volume spikes or custom metrics charges.
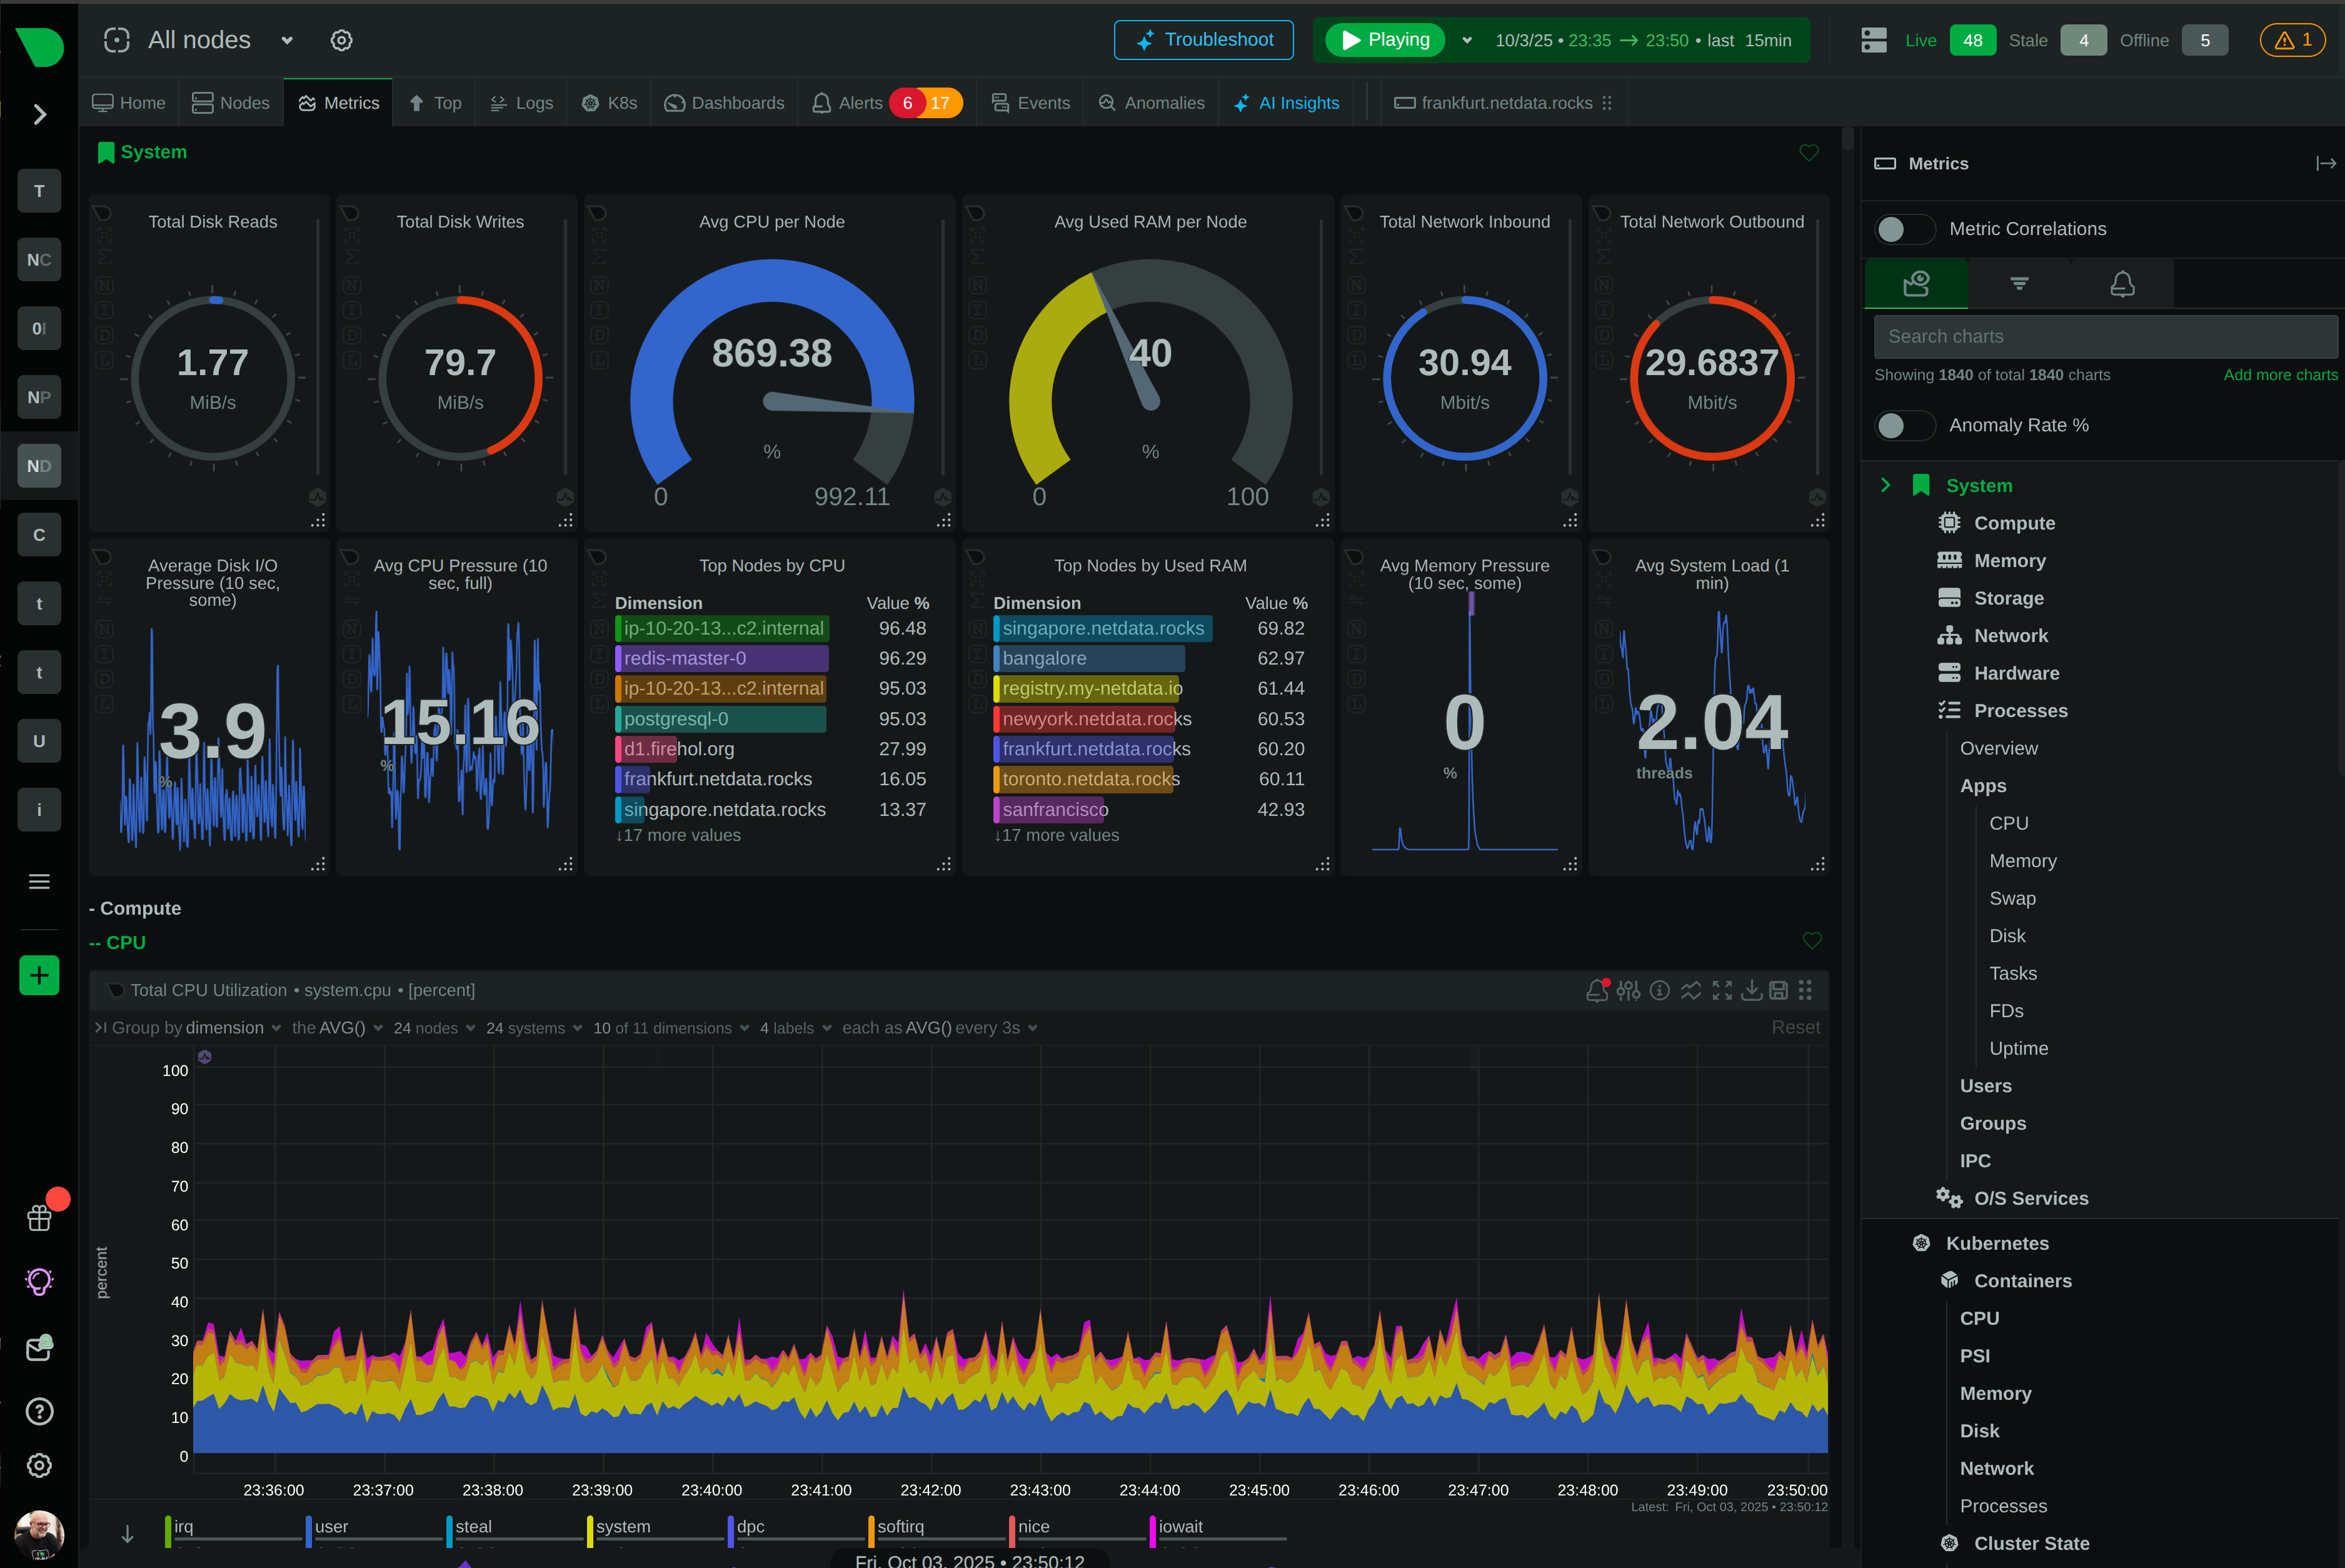
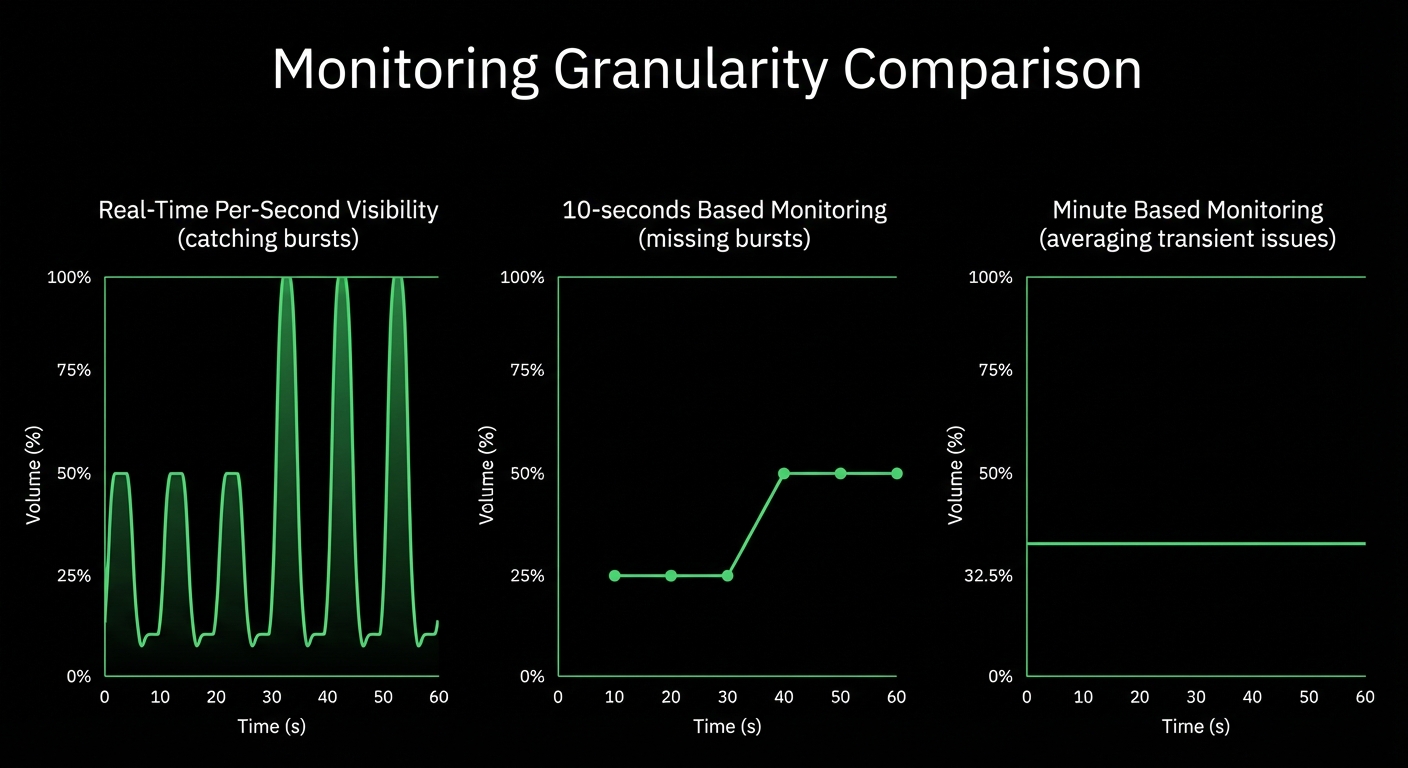
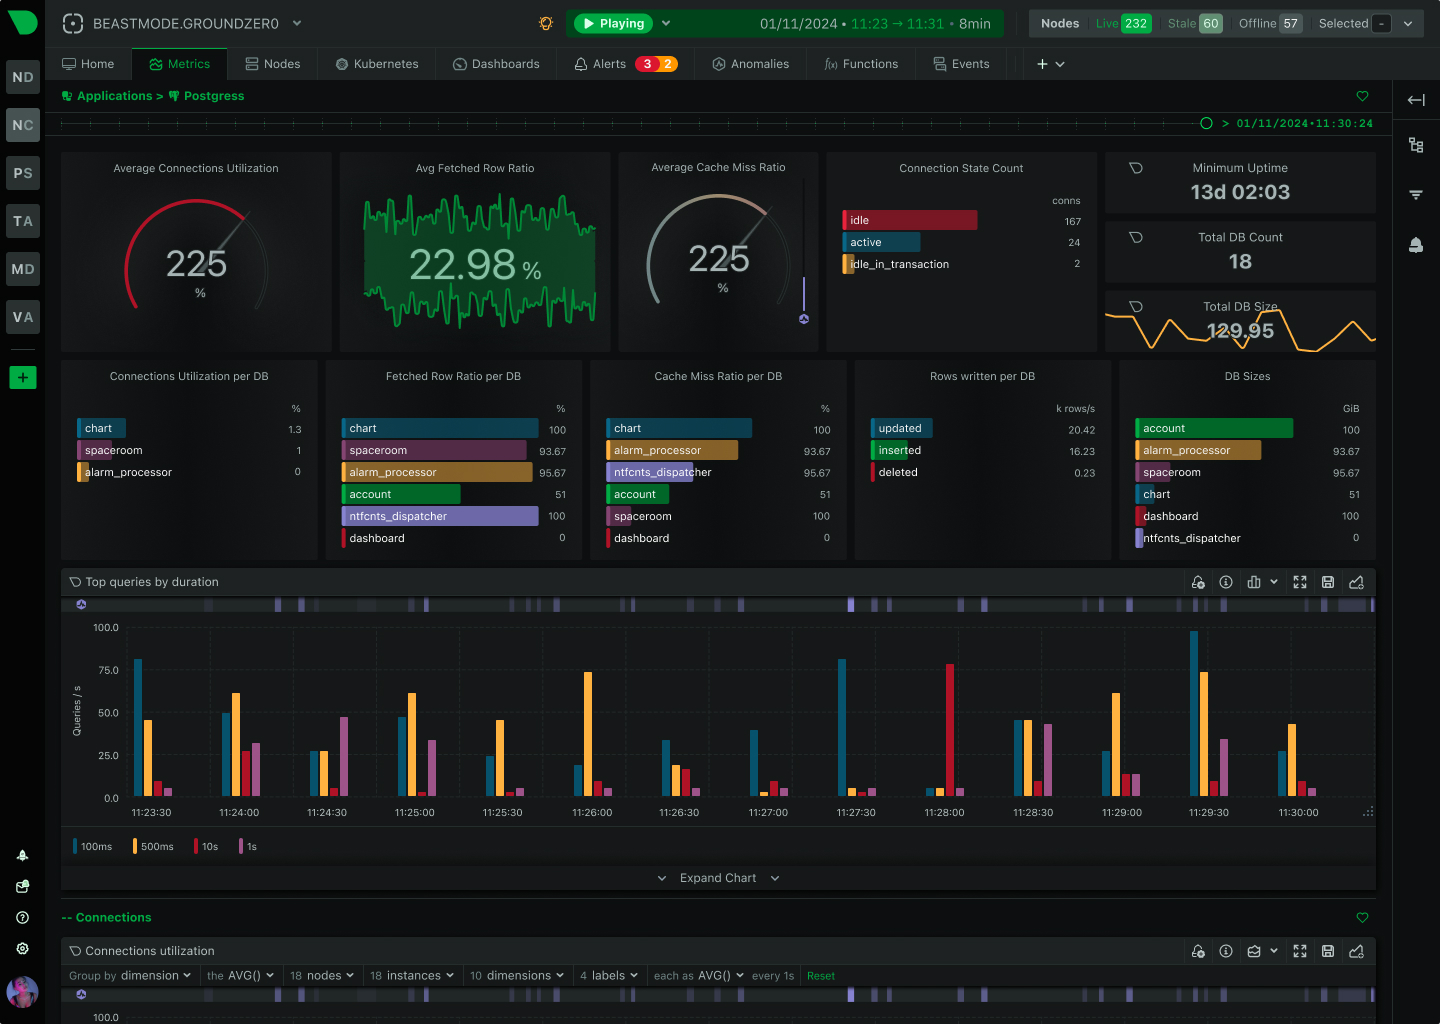
True Per-Second Visibility
10-60× faster than traditional monitoring. See transient issues and microbursts that minute-level tools completely miss.
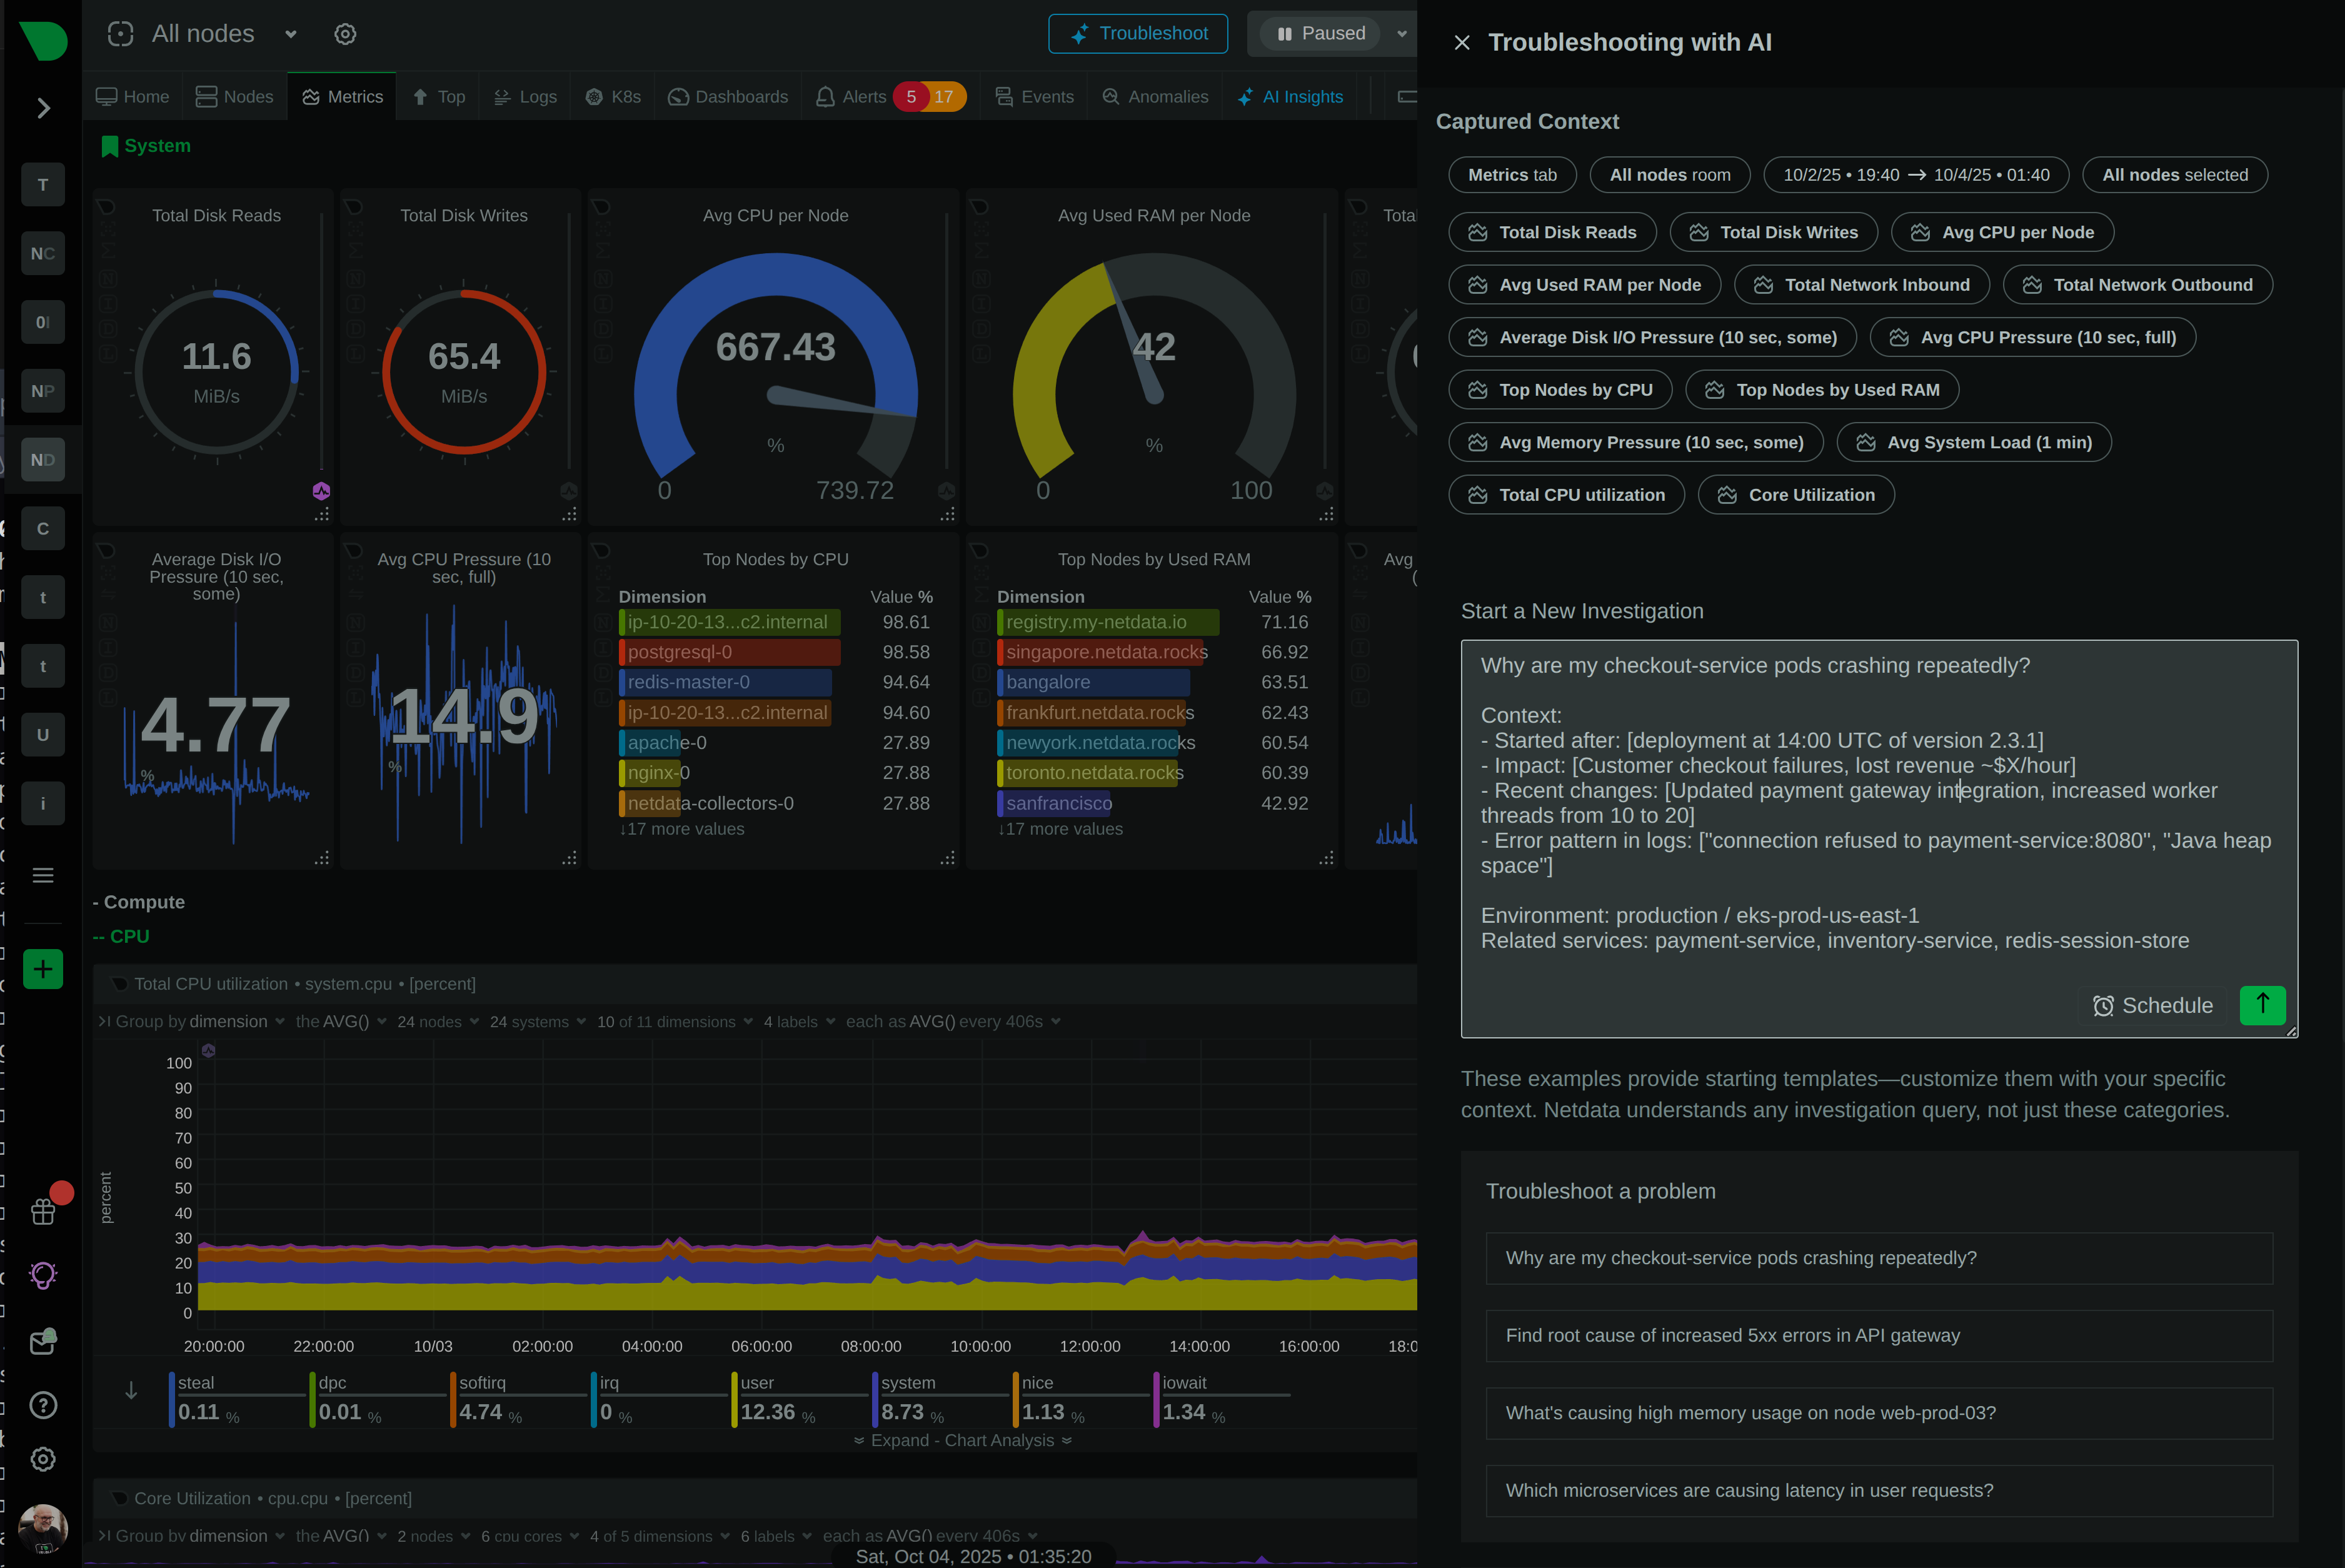
AI Troubleshoots For You
Ask questions in plain English. AI Co-Engineer analyzes your infrastructure and provides root cause analysis in seconds.
Replace 7 Tools With One
Unified metrics, logs, alerts, and functions. Eliminate Prometheus, Grafana, Elasticsearch, log shippers, and SSH access.
Trusted by DevOps teams worldwide


Accelerate Your DevOps Pipeline
Catch Issues Before Users Notice
80% faster MTTR
Learn about ML anomaly detection
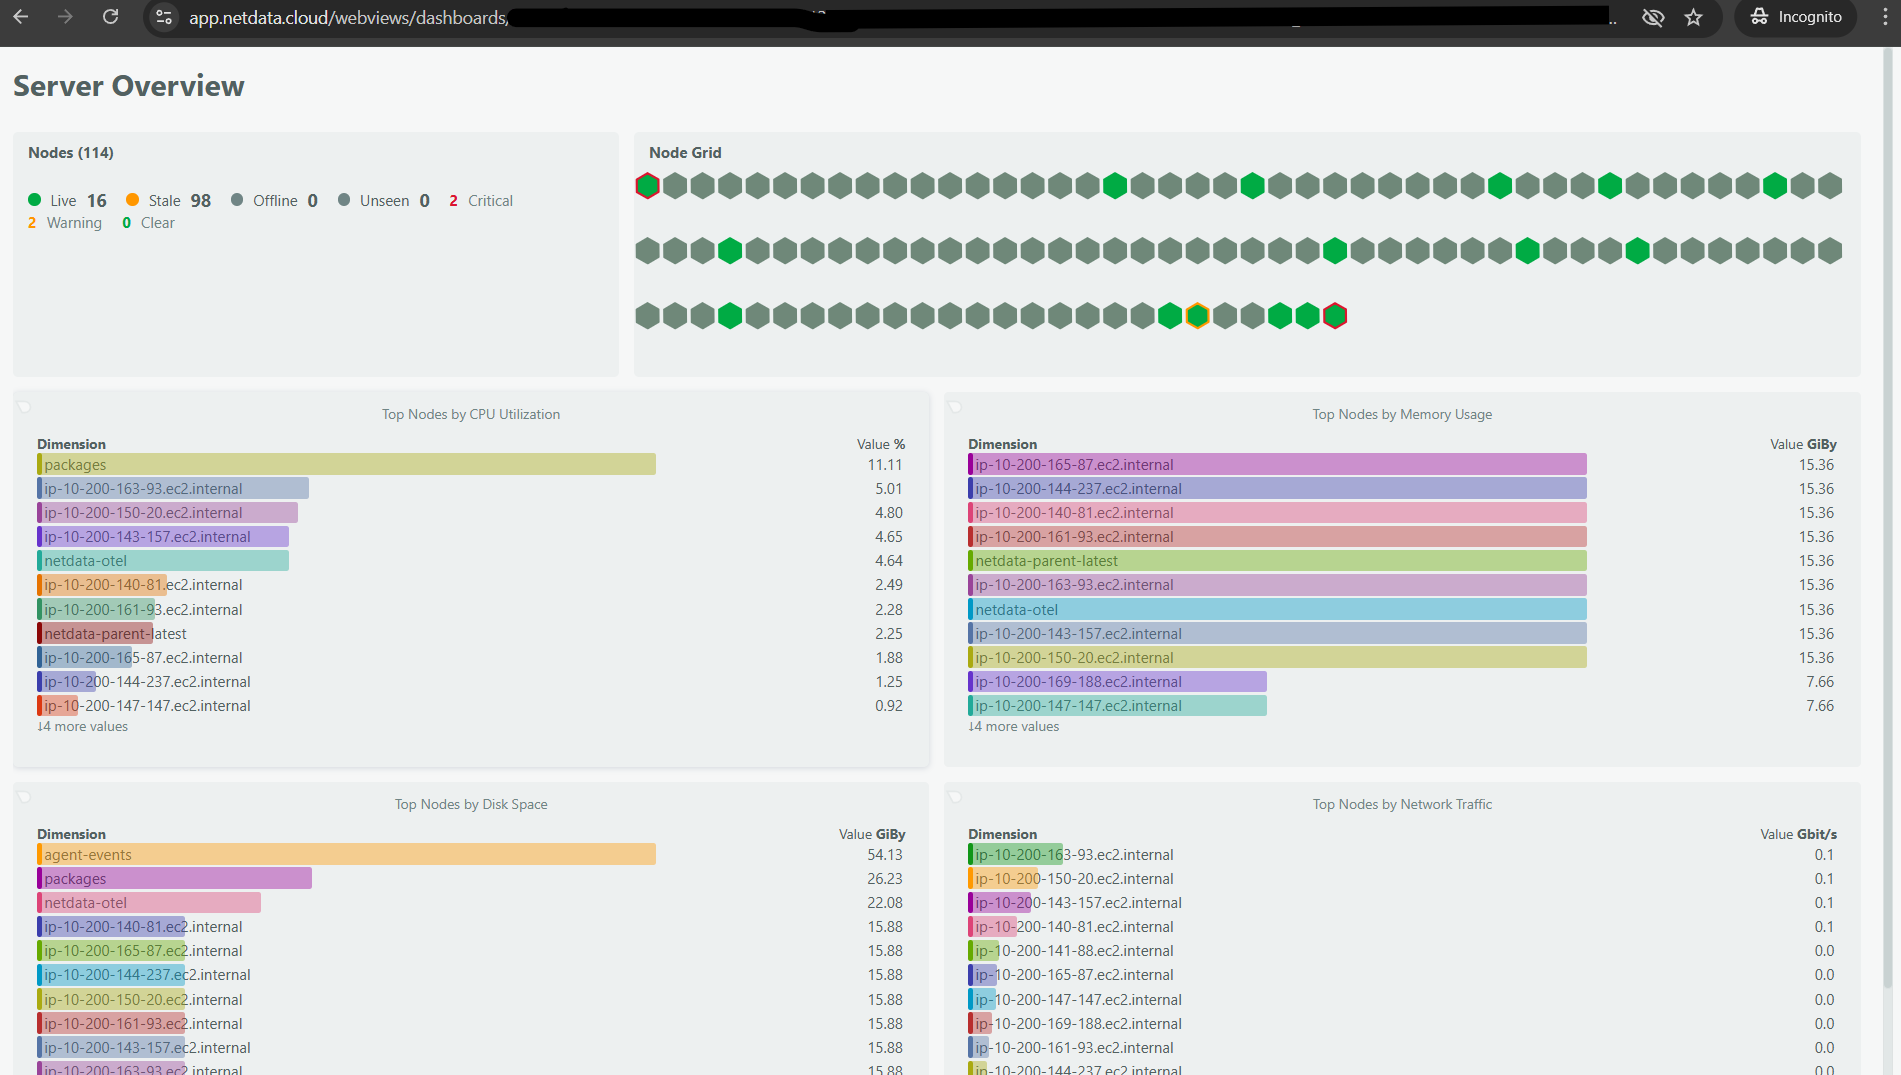
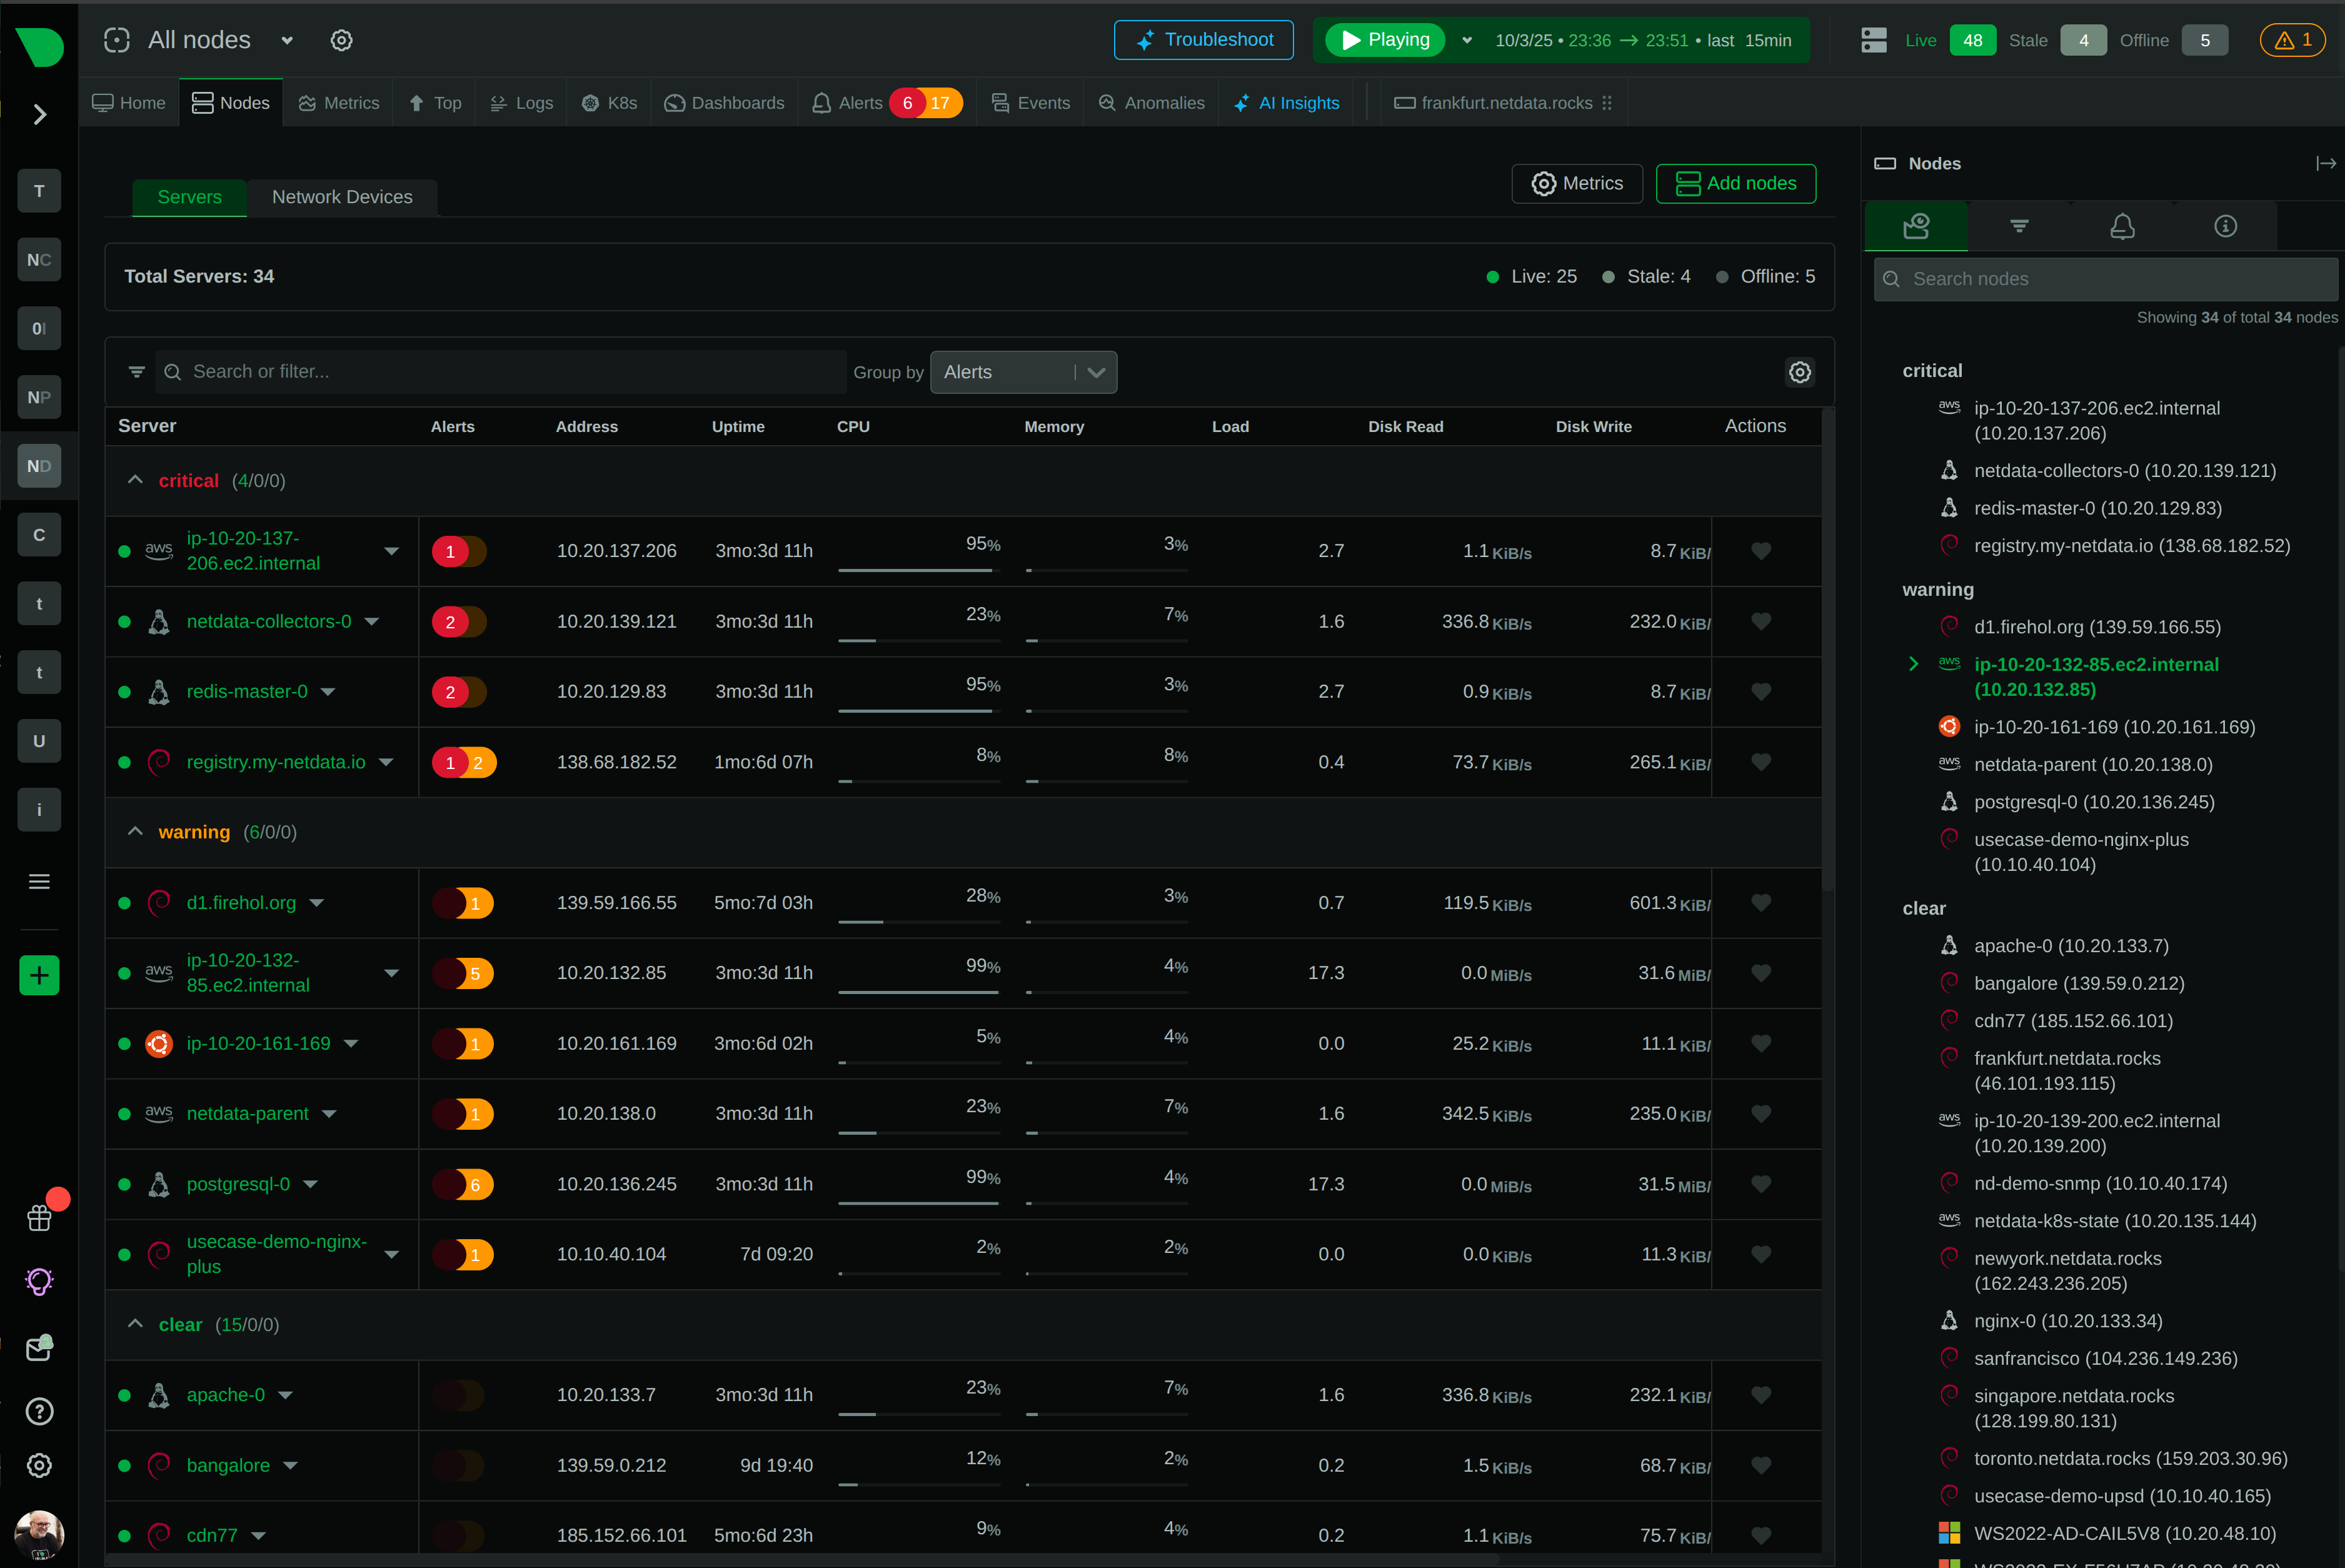
Monitor Everything Without Configuration
800+ integrations
View all integrations
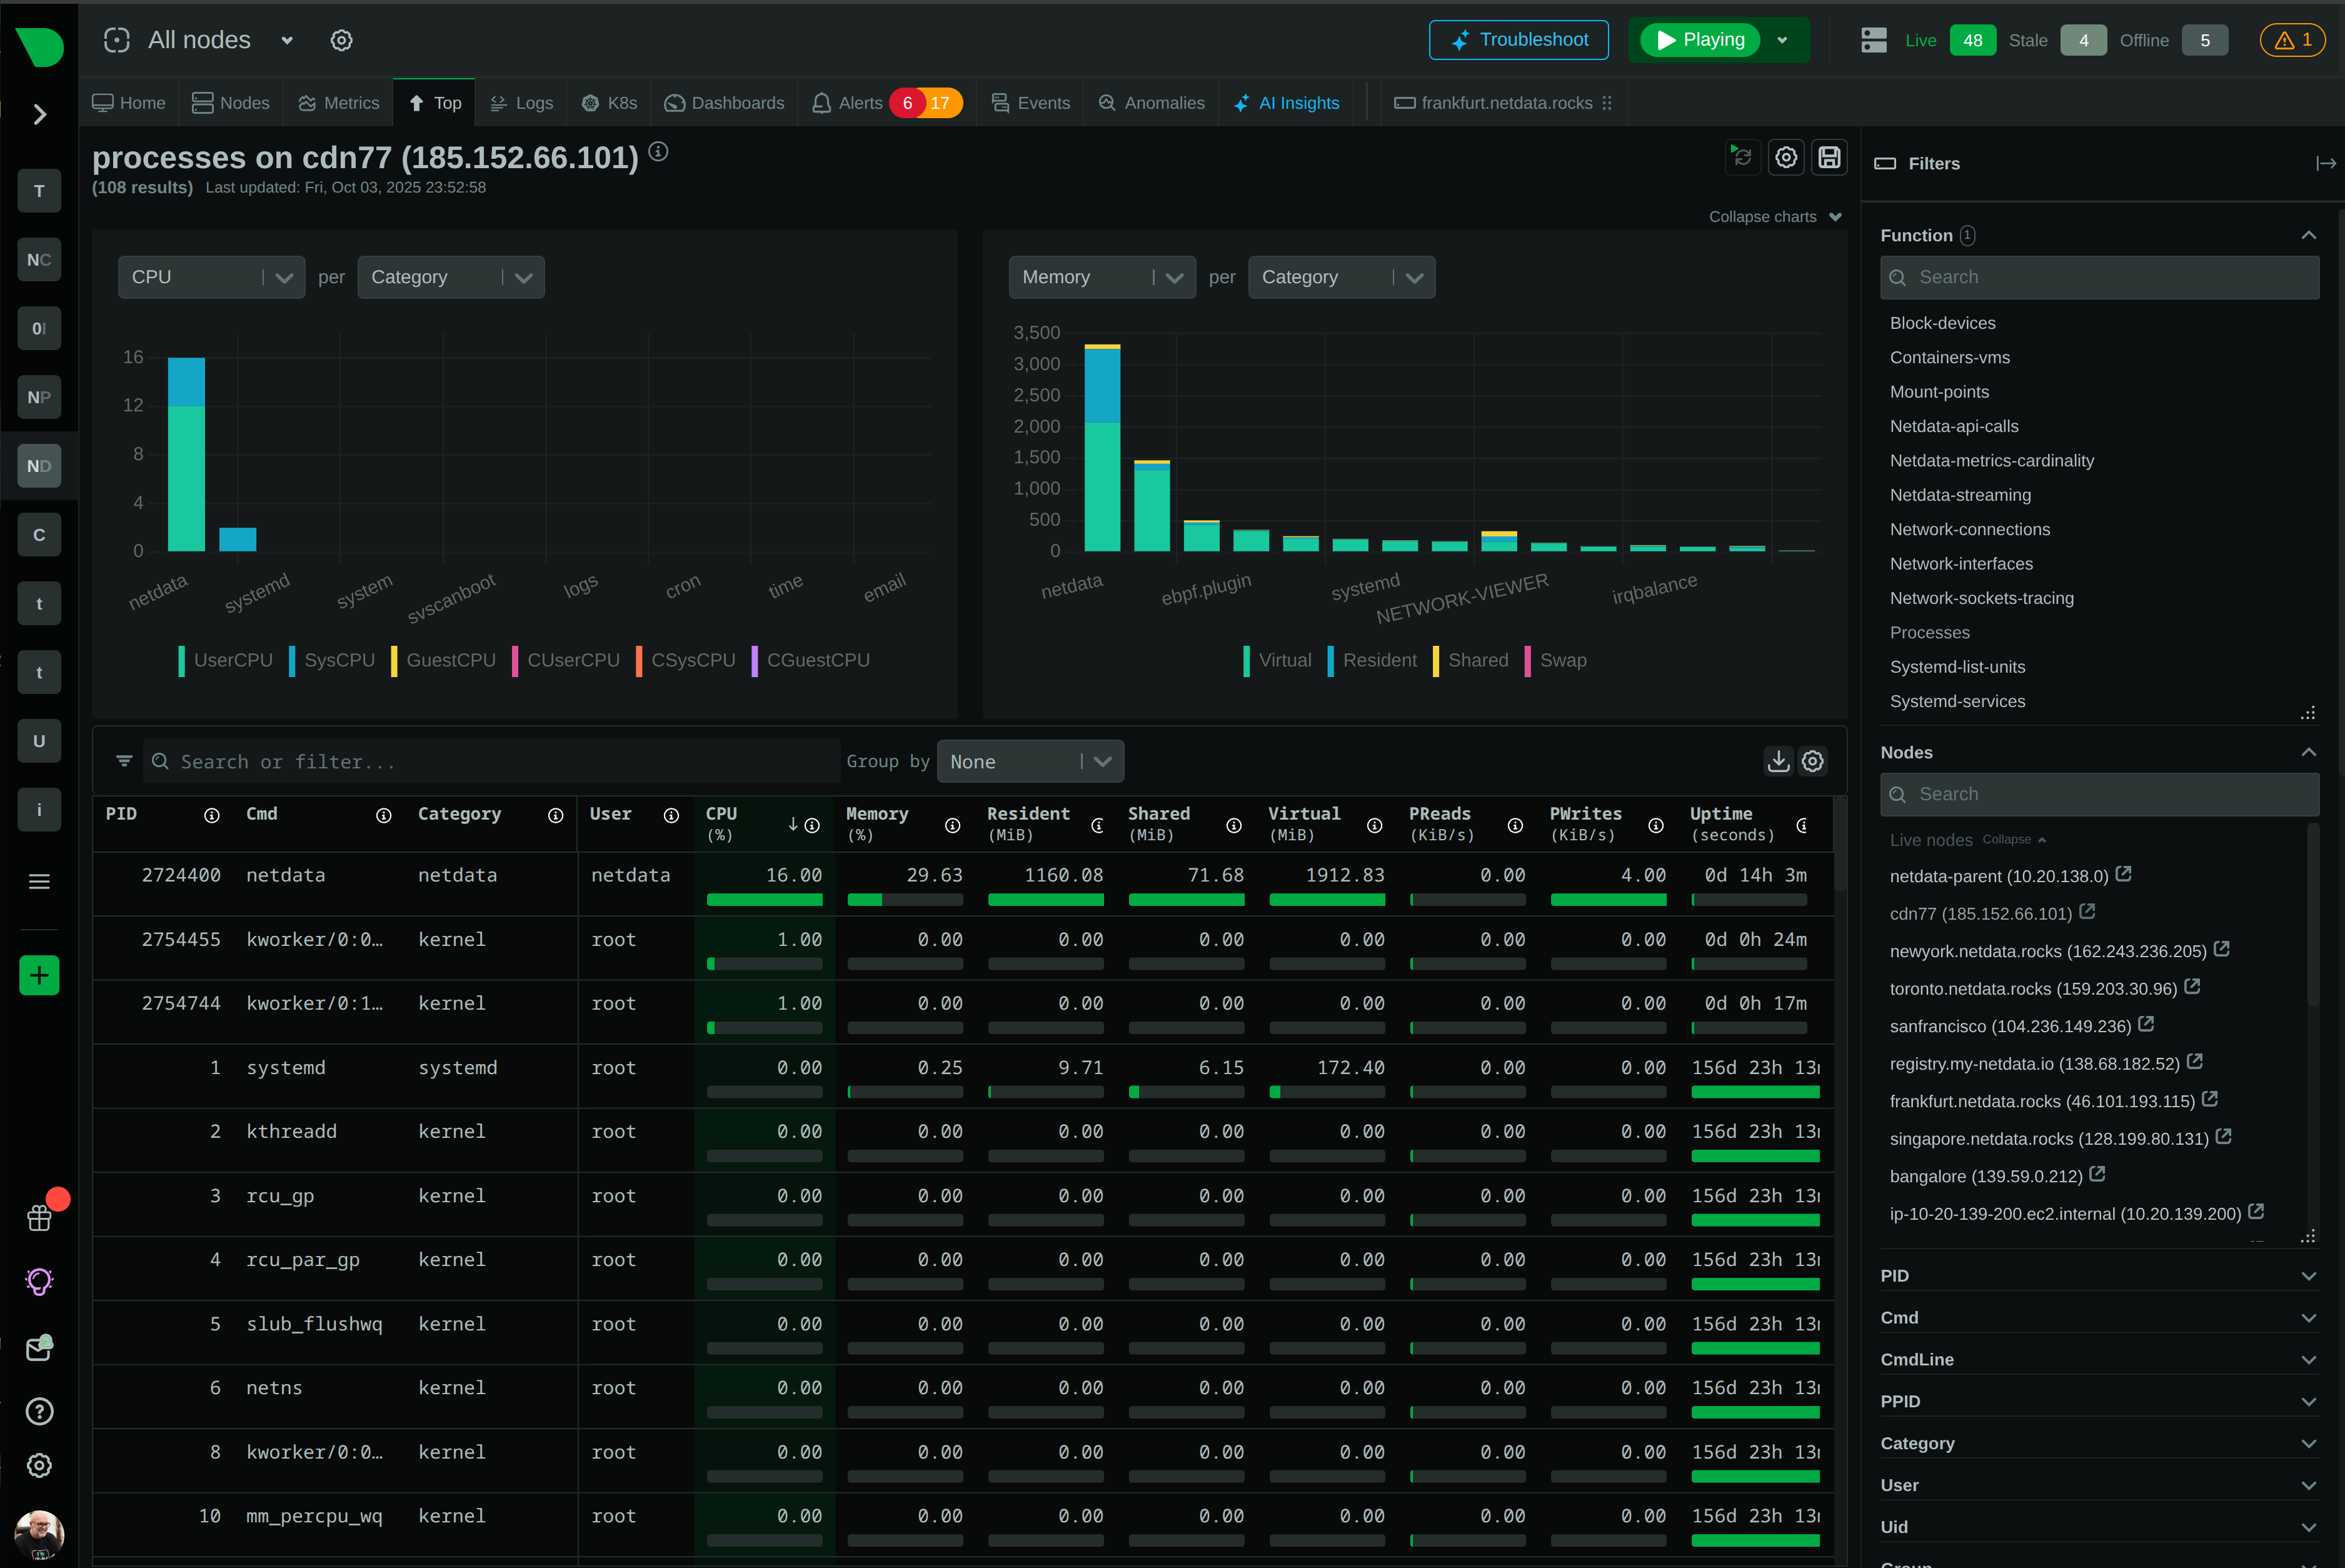
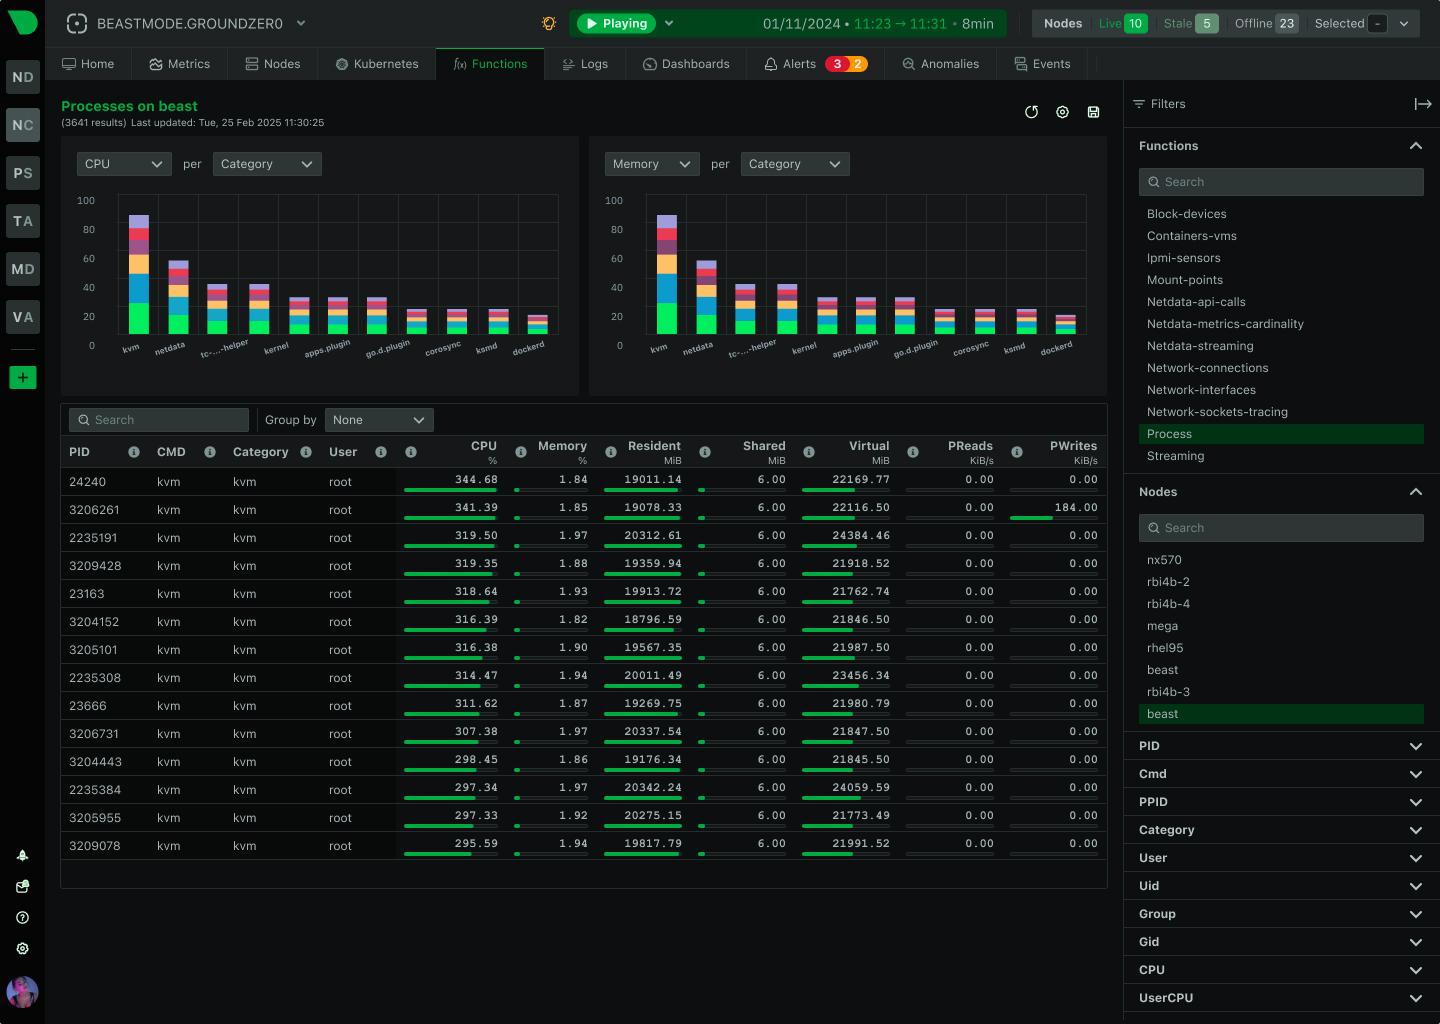
Troubleshoot Without SSH Access
Console replacement
Explore Netdata Functions
Scale From 1 to 100,000 Nodes
Unlimited scalability
Understand the architecture
Kubernetes Native Monitoring
Zero K8s complexity
Deploy on Kubernetes

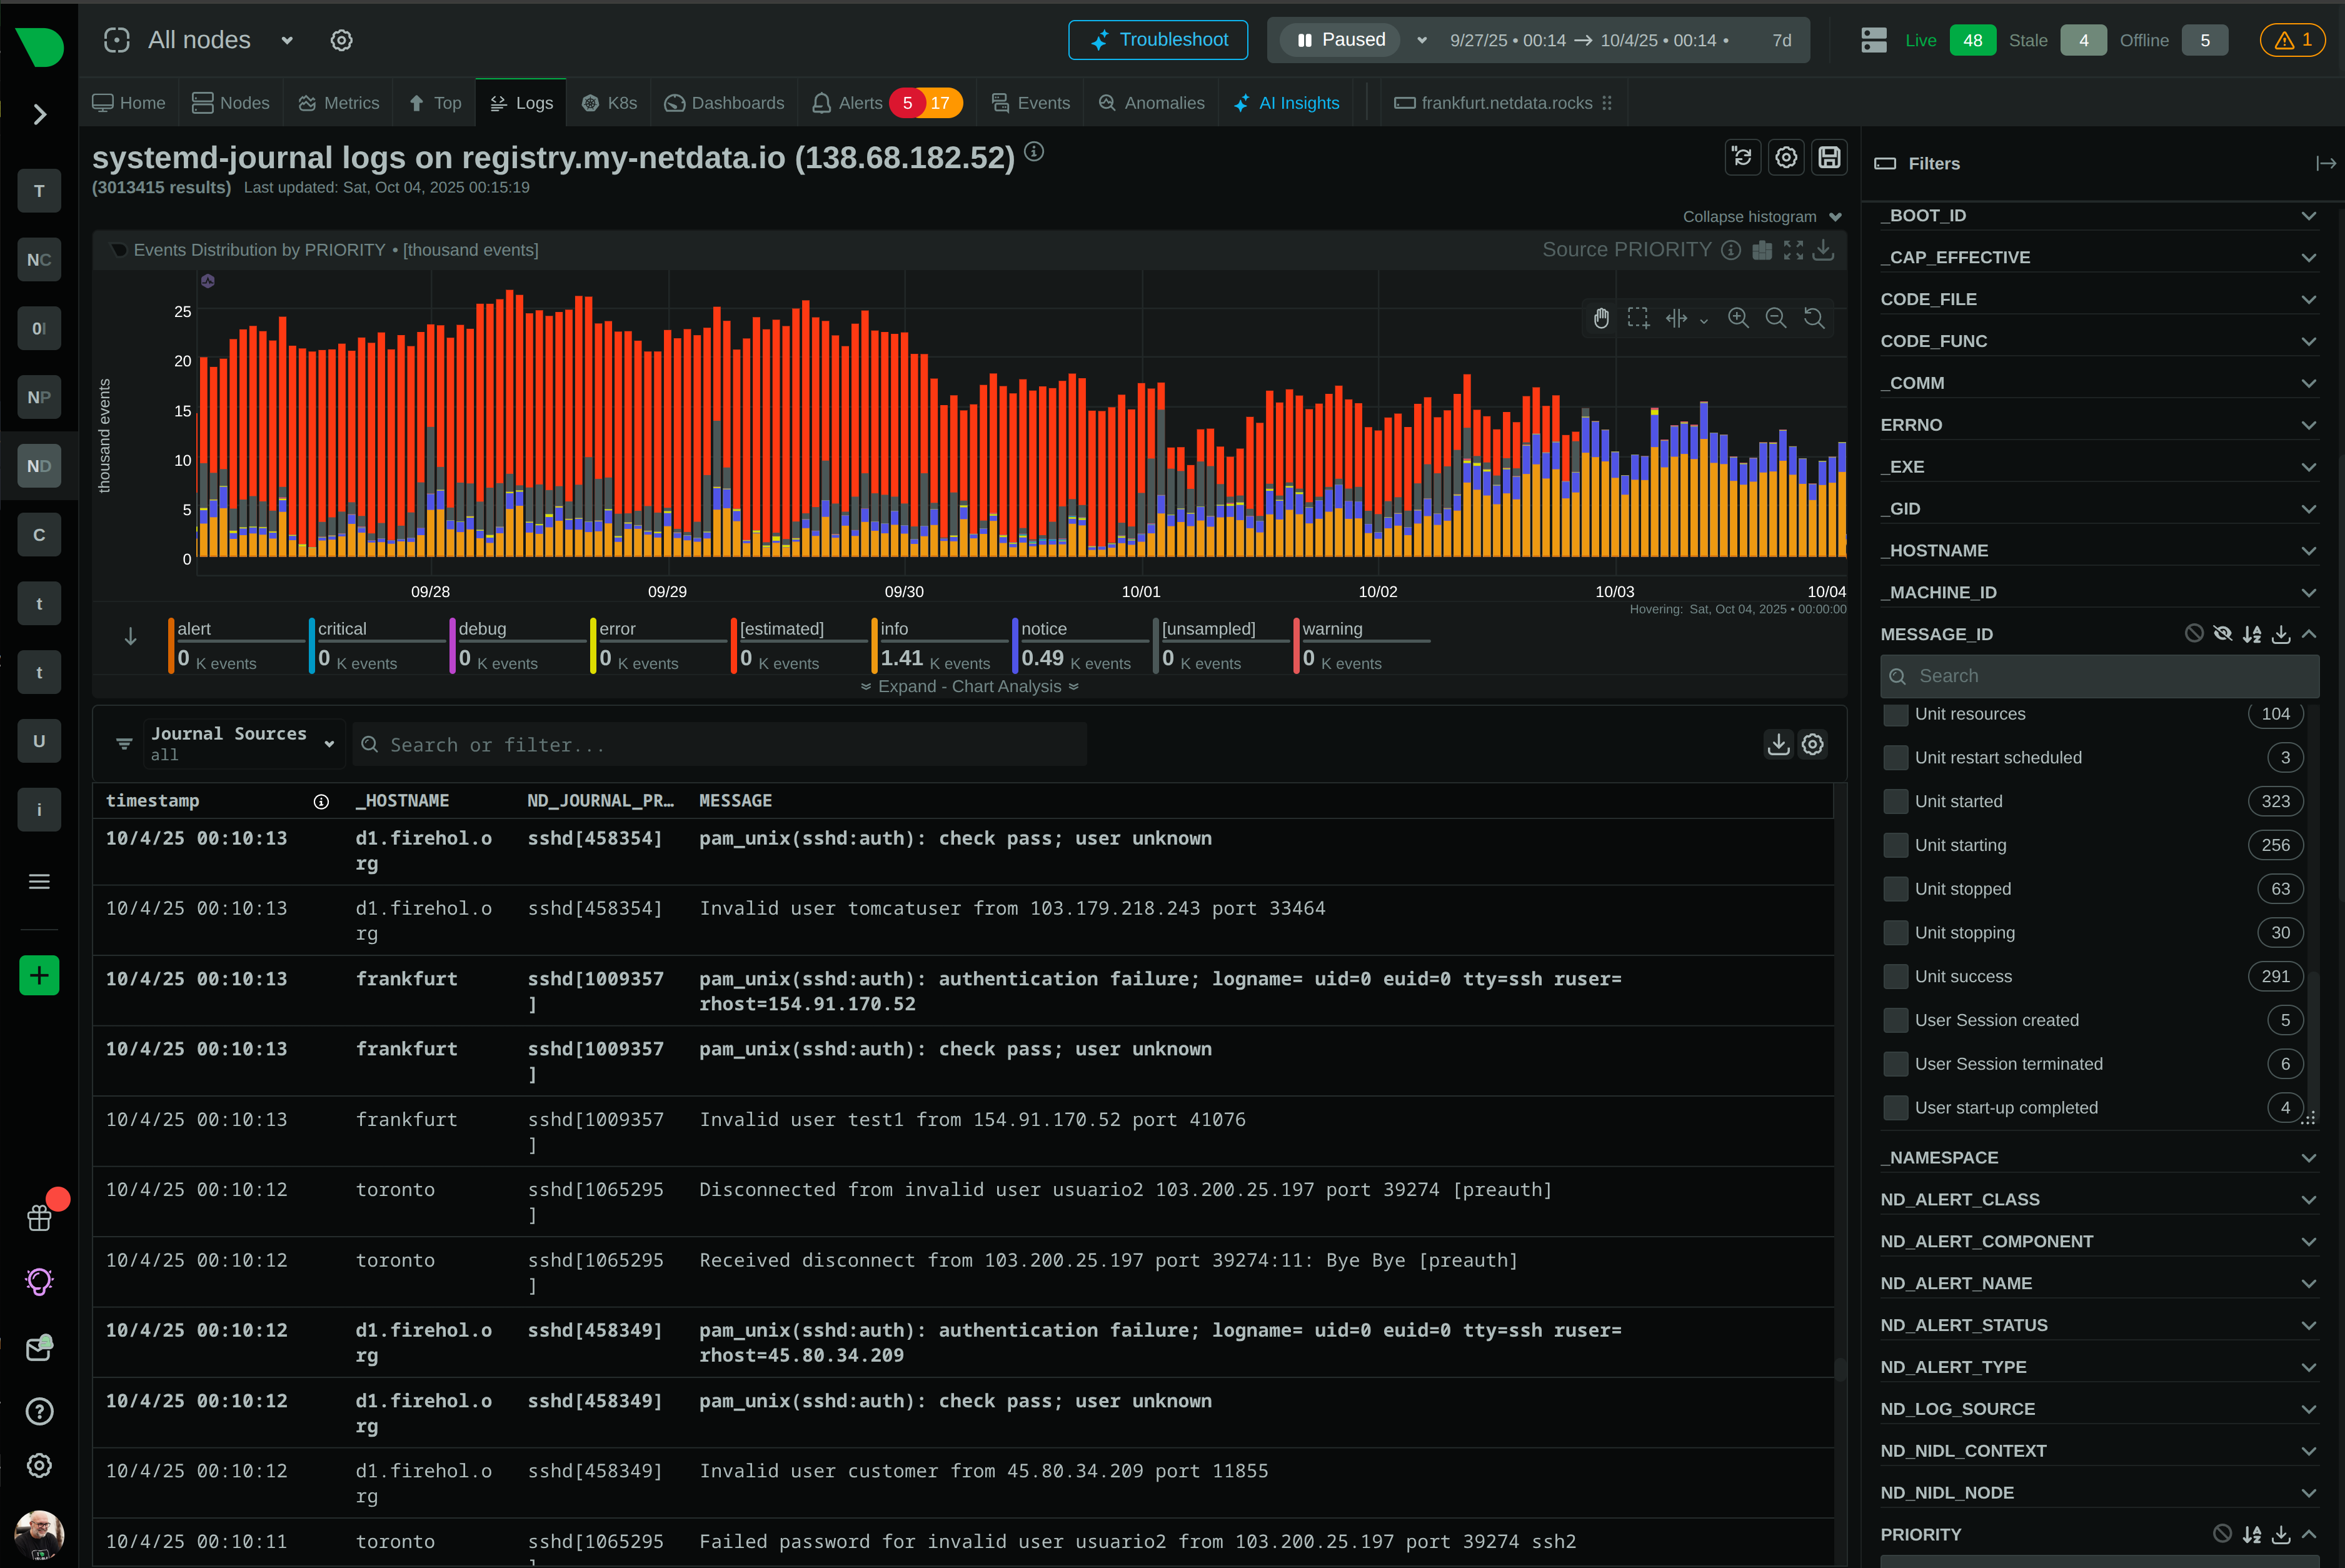
Logs Without Pipelines
90% log cost reduction
Discover zero-pipeline logs

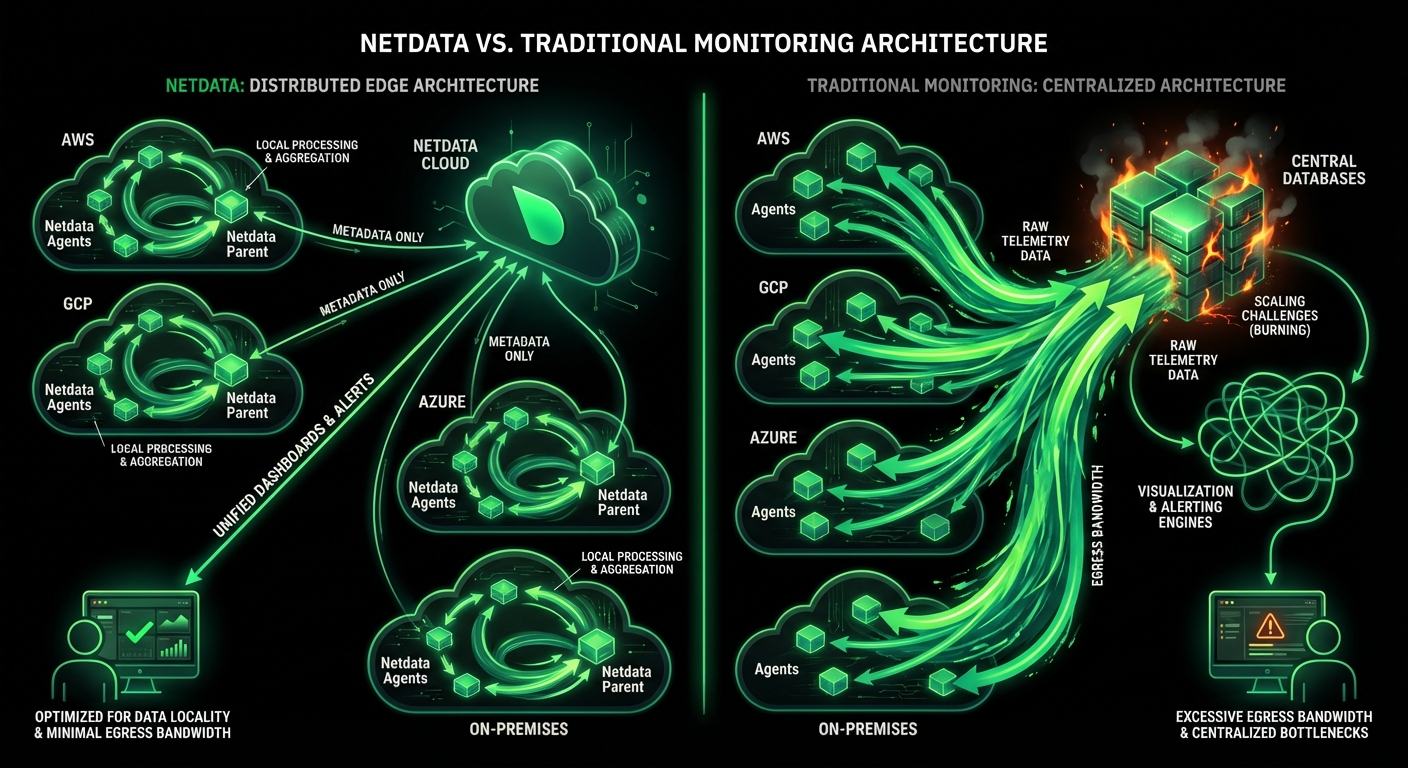
How Netdata Compares
Built for DevOps Teams, Not Data Scientists
Traditional monitoring forces you to choose between visibility and cost. Netdata eliminates that tradeoff with edge-native architecture and transparent pricing.
Capability
Netdata
Traditional Monitoring
Data Granularity
✅ Per-Second
Catch transient issues and microbursts
⚠️ Per-Minute or Worse
Miss 90% of operational anomalies
Setup Time
✅ 60 Seconds
One-line install with instant dashboards
⚠️ Days to Weeks
Complex configuration and manual setup
Query Language
✅ None Required
Point-and-click NIDL framework
⚠️ PromQL/SQL/DQL
Steep learning curve for analysis
ML Anomaly Detection
✅ All Metrics Automatically
18 models per metric, 99% false positive reduction
⚠️ Selected Metrics Only
Manual configuration and tuning required
Pricing Model
✅ Per-Node Fixed
Unlimited metrics, logs, users
❌ Per-Metric + Per-GB
Unpredictable bills and hidden costs
Cost Predictability
✅ Predictable Pricing
Fixed per-node cost with P90 billing protection
❌ Usage-Based Pricing
Costs scale with data volume, often 10-20× more
Data Sovereignty
✅ On-Premises
All data stays local, compliance-friendly
❌ Centralized Cloud
Data egress costs and compliance risks
Tool Consolidation
✅ Single Platform
Replaces 7 tools including SSH
⚠️ 4-10 Tools Average
Fragmented monitoring and integration complexity
High Cardinality
✅ Unlimited Metrics
No artificial limits or performance penalty
⚠️ Limited or Expensive
Forced to drop fields or pay exponentially
Vendor Lock-in
✅ Open Source
GPLv3+ licensed, export to any backend
❌ Proprietary Formats
6-12 month migrations with significant costs
DevOps Workflows Accelerated
Monitor Deployments in Real-Time
Track deployment impact instantly with per-second metrics. Terraform provider and REST API enable infrastructure-as-code workflows. Validate changes immediately - no waiting for minute-level aggregations.
Instant deployment feedback
Explore CI/CD integration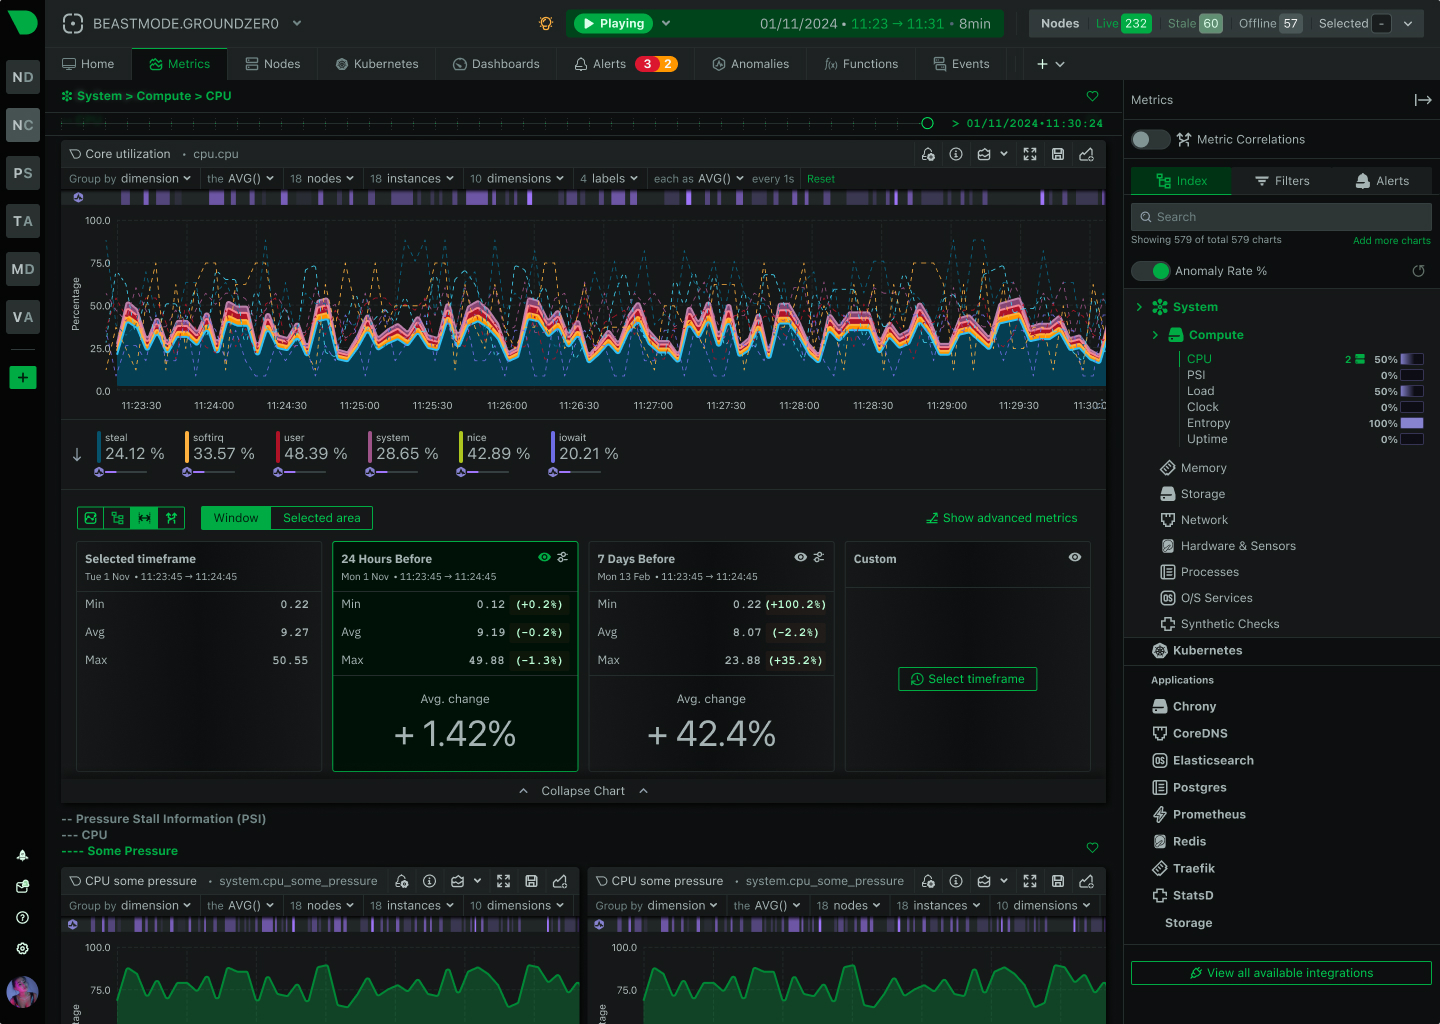
Why DevOps Teams Choose Netdata
The only monitoring platform built for speed, simplicity, and scale
Deploy in Minutes, Not Months
One-line installation with instant auto-discovery. Zero configuration required - start monitoring immediately with pre-built dashboards and health checks.
Predictable Costs That Scale
Per-node pricing with P90 billing protection. Unlimited metrics, logs, and users at fixed price. 90% cost reduction vs traditional solutions.
True Real-Time Visibility
Per-second collection and visualization. Catch transient issues and microbursts that minute-level monitoring completely misses.
ML Detects Every Anomaly
18 models per metric with 99% false positive reduction. Automated root cause analysis surfaces issues in top 30-50 results.
Replace 7 Tools With One
Unified metrics, logs, alerts, and functions. Eliminate Prometheus, Grafana, Elasticsearch, log shippers, and SSH.
Scale Without Limits
Edge-native architecture proven at 100,000+ nodes. Linear scaling with no central bottleneck or performance degradation.
Data Sovereignty by Design
All observability data stays on-premises. SOC 2 Type 2 certified with GDPR, HIPAA, and PCI DSS compliance built-in.
AI Troubleshoots For You
Ask questions in plain English. AI Co-Engineer analyzes infrastructure and provides root cause analysis in seconds.
Zero Learning Curve
No query languages, no manual dashboards, no configuration. Point-and-click NIDL framework makes everyone productive immediately.

April 22, 2026
Nagios Plugins Collector: Run Your Existing Checks and Custom Scripts Inside Netdata
Netdata can now execute Nagios-compatible plugins and custom scripts in any language, tracking check states, execution metrics, and automatically charting performance data with built-in alerting.
April 20, 2026
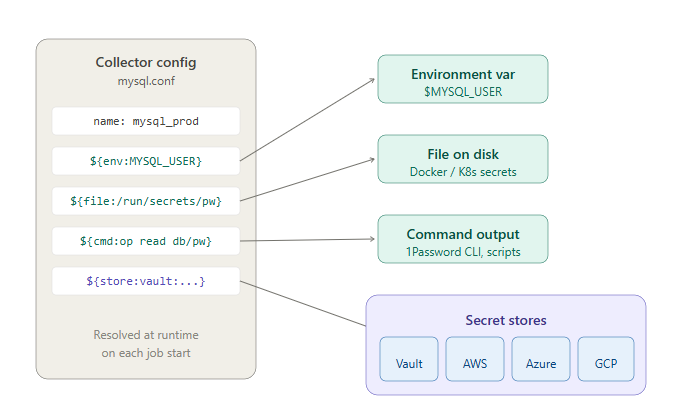
Secrets Management: Get Credentials Out of Your Netdata Configuration Files
Netdata now supports referencing secrets from environment variables, files, commands, and external secret stores like HashiCorp Vault, AWS Secrets Manager, Azure Key Vault, and GCP Secret Manager directly in collector configurations.
April 16, 2026
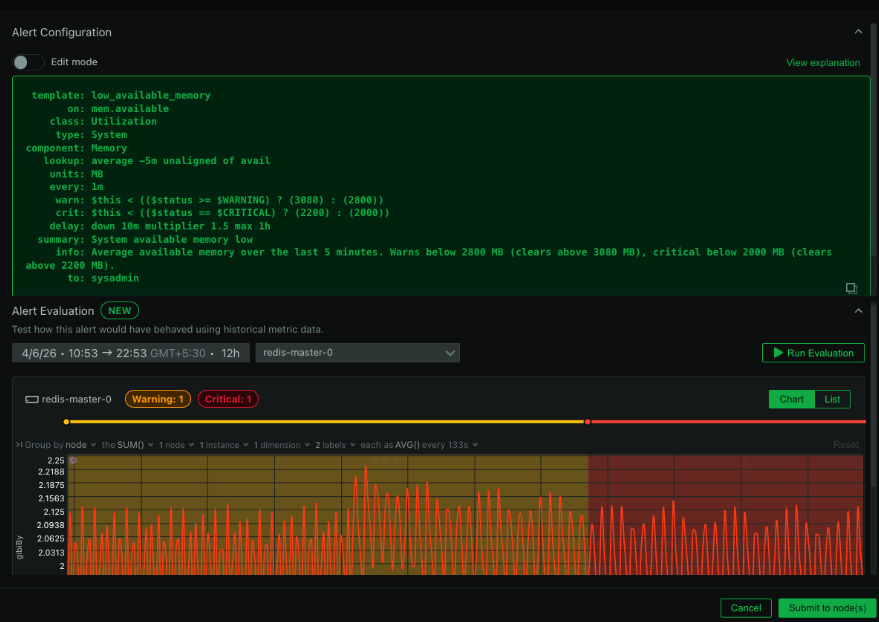
Smarter Alert Management: Test on Historical Data, Review Transitions, and Preview Silencing Schedules
Three new alerting capabilities in Netdata: evaluate alert definitions against historical metrics before deploying, review alert transition timelines, and preview recurring silencing schedules before saving.