










 Database Monitoring
See Every Database Heartbeat in Real Time
Transform database operations with per-second visibility, AI-powered troubleshooting, and 99% accurate anomaly detection. Deploy in 60 seconds with zero configuration - monitor MySQL, PostgreSQL, MongoDB, Redis, Oracle, and 10+ more platforms from a single unified dashboard.


Why Database Teams Choose Netdata
The fastest path from database issue to resolution

Per-Second Precision
Catch transient issues competitors miss with true 1-second granularity across all database metrics - 15-60× faster than traditional monitoring.
99% Accurate ML
18-model consensus anomaly detection achieving 99% false positive reduction in anomaly detection - automatically trained on every metric.

60-Second Deployment
From installation to full database visibility in 60 seconds. Zero configuration required - auto-discovers all databases and generates comprehensive dashboards instantly.

90% Cost Reduction
Predictable per-node pricing for infrastructure monitoring, with no charges for metrics volume, Logs Monitoring (querying logs in place), users, data retention or containers. No custom metric fees.
AI Root Cause Analysis
Anomaly Advisor surfaces root cause in top 30-50 metrics automatically. Reduce MTTR by 80% - from hours to minutes typical.

Complete Data Sovereignty
100% on-premises storage with SOC 2 Type 2 certification. All database metrics stay on your infrastructure, supporting GDPR and HIPAA programs.
Trusted by database teams worldwide








































Transform Database Operations
Catch Issues Before They Cascade
80% faster MTTR
See Real-Time Monitoring


Troubleshoot With AI Guidance
Top 30-50 metrics ranked
Explore AI Features


Monitor Every Database Platform
15+ databases supported
View All Integrations


Unified Metrics, Logs, and Infrastructure
90% log cost reduction
Learn About Logs


Deploy Anywhere in 60 Seconds
60 seconds to production
Quick Start Guide


Predictable Costs That Scale
90% cost savings
View Pricing


How Netdata Compares
Database Monitoring Done Right
Traditional monitoring tools force you to choose between comprehensive coverage and manageable costs. Netdata delivers both - with superior performance and zero configuration burden.
Capability
Netdata
Traditional Monitoring
Data Granularity
Collection frequency and precision
✅ Per-Second
True 1-second collection across all metrics
⚠️ Per-Minute
15-60 second intervals miss transients
Deployment Time
From installation to full visibility
✅ 60 Seconds
Zero configuration, instant dashboards
❌ Hours to Days
Extensive setup and configuration required
ML Anomaly Detection
False positive rate and accuracy
✅ 99% Accurate
18-model consensus, 99% false positive reduction
⚠️ Basic Detection
Higher false positive rates typical
Root Cause Analysis
Time to identify issue source
✅ Minutes
Anomaly Advisor surfaces top 30-50 metrics
❌ 30+ Minutes
Manual correlation across fragmented tools
Query Language Required
Learning curve and expertise needed
✅ None
Point-and-click NIDL framework
❌ PromQL/SQL/NRQL
Hundreds of hours learning multiple languages
Dashboard Creation
Time to build comprehensive views
✅ Automatic
Algorithmic generation, zero effort
❌ 30+ Hours
Manual building per database type
Resource Overhead
Impact on monitored systems
✅ <5% CPU
150MB RAM, validated by research
⚠️ 10-20% CPU
1-4GB RAM typical for agents
Pricing Model
Cost structure and predictability
✅ Predictable Per-Node
Per-node pricing, no per-metric charges
❌ Complex Multi-Factor
Host + metrics + logs + data volume charges
Data Sovereignty
Where metrics, logs and traces are stored
✅ 100% On-Premises
Complete control, supporting GDPR/HIPAA
❌ Cloud-Centralized
Data egress costs, compliance concerns
Database Coverage
Native platform support
✅ 15+ Platforms
MySQL, PostgreSQL, MongoDB, Redis, Oracle+
⚠️ Limited Platforms
Fewer native integrations, gaps in coverage
MTTR (Mean Time to Resolution)
Typical incident resolution time
✅ 80% Reduction
From hours to minutes with AI troubleshooting
❌ Hours
Manual investigation and correlation
Tool Consolidation
Number of tools required
✅ 1 Unified Platform
Metrics, logs, traces, AI, infrastructure combined
❌ Multiple Tools
Fragmented across vendors and functions
Comprehensive Database Platform Support
Complete MySQL Monitoring
100+ metrics covering queries, InnoDB, replication, locks, connections, and handlers. Auto-discovers MySQL, MariaDB, and Percona Server with zero configuration.
Native first-class support
View MySQL Integration


Key Database Monitoring Capabilities
Everything you need for comprehensive database observability - from real-time metrics to AI-powered troubleshooting
Real-Time Connection Tracking
Monitor active connections, connection pool utilization, aborted connections, and connection states with per-second precision. Alerts trigger automatically when thresholds exceeded.

Query Performance Analysis
Track slow queries, query rates by type, handler operations, and longest active query duration. Identify performance bottlenecks before they impact users.

Replication Health Monitoring
Comprehensive replication tracking for MySQL, PostgreSQL, MongoDB, and Redis. Monitor lag, status, and replica health with automatic alerting on failures.

Lock Contention Detection
Track table locks, row locks, deadlocks, and wait times. ML anomaly detection flags unusual locking patterns that indicate application issues.

Resource Utilization Metrics
Monitor buffer pools, cache hit ratios, memory usage, disk I/O, and CPU consumption. Correlate database metrics with system resources automatically.

Backup Health Verification
Track backup job status, duration, and failures. Alerts trigger on stale backups or failed operations - supporting data protection compliance.

ML Anomaly Detection
18 unsupervised models per metric achieving 99% false positive reduction. Automatically trained on your database patterns - no tuning required.

AI Root Cause Analysis
Anomaly Advisor correlates thousands of metrics to surface root cause in top 30-50 results. Reduces investigation time dramatically.

AI Troubleshooting Assistant
Click ‘Ask AI’ on any alert for instant guidance. Natural language explanations with recommended actions and specific commands - no query languages required.
April 24, 2026
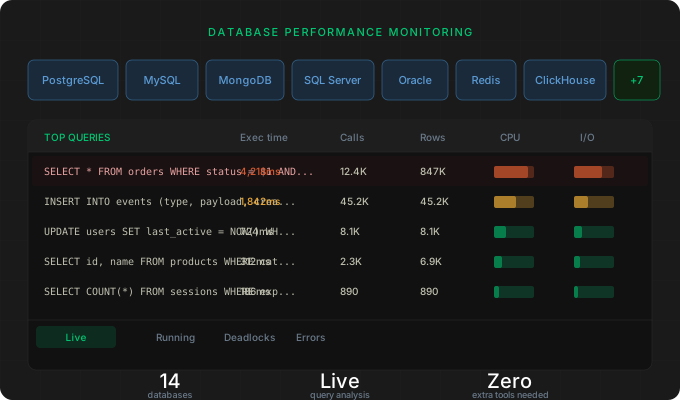
Database Performance Monitoring: 14+ DBs Supported
Get query-level database performance monitoring across 14+ databases with Netdata, spotting slow queries and bottlenecks in real time. Read the guide now!

February 22, 2023
Monitor any SQL metrics with Netdata (and Pandas ❤️)
Learn how to monitor any SQL metrics with Netdata for real-time database performance insights. Optimize queries and detect issues faster. Get started now!

November 30, 2022
Release 1.37: Infinite Scalability & Database Tiering
Discover what’s new in Netdata v1.37! Explore the latest features, improvements, and enhancements for real-time monitoring. Upgrade and optimize today!