










 SNMP Trap Monitoring
Every Network Event, Decoded the Moment It Arrives
A complete SNMP trap receiver built into Netdata. Decode traps from 800+ vendors into named, categorized, severity-tagged events — unified with your logs, metrics, and topology, all from the Agent you already run.


Why Teams Choose Netdata for SNMP Traps
A real trap receiver — not a wrapper around legacy tooling, not a log file nobody reads.
Native Trap Receiver
Built-in Go collector binds the UDP socket and decodes SNMP v1/v2c/v3 Trap and INFORM directly — no external trap server to deploy or maintain.
Decoded Out-of-Box
Stock profile pack with 800+ vendors, 6,000+ MIBs, and 150,000+ trap definitions resolves raw OIDs into named, categorized events.
Unified With Logs
Traps surface as structured logs in the same Logs UI as your system logs — queryable by trap name, category, severity, and source IP.

Storm-Proof Pipeline
Per-source rate limiting and deduplication absorb trap storms. A single Agent sustains ~50,000 traps/s to durable local storage.
Built-In Alerting
~21 default health alerts cover severity-aware trap flow, decode failures, auth issues, and kernel UDP buffer drops.
Edge-Native Design
Receive, decode, and store at the edge Agent where traps arrive. View aggregated across the fleet via Parents and Netdata Cloud.
Trusted by network and operations teams worldwide








































From Raw OID to Root Cause
150,000+ Trap Definitions, Ready to Go
800+ vendors covered
Explore the collector


Receiver Health, Always Monitored
~21 default alerts
Learn about alerting


Traps With Topology Context
LLDP/CDP enriched
View topology viewer


Forward to Your SIEM Over OTLP
OTLP/gRPC export
Learn about logs management


Netdata vs. standalone trap tools
One Platform for Traps, Logs, Metrics, and Alerts
Netdata brings trap receiving, decoding, alerting, and forwarding into one platform — alongside your metrics, logs, and topology.
Capability
Netdata
Standalone Trap Receivers
Trap Receiver
How traps are received
✅ Ideal
Native Go collector inside the Agent
⚠️ Manual
Separate server process to deploy and maintain
Trap Decoding
OID to human-readable
✅ Ideal
150,000+ definitions from 800+ vendors stock
⚠️ Basic
Manual MIB compilation per device type required
Logs Integration
Where traps surface
✅ Ideal
Unified Logs UI with system and app logs
❌ Not Available
Isolated trap console or flat log file
Health Alerts
Proactive monitoring coverage
✅ Advanced
~21 severity-aware checks included by default
⚠️ Basic
Custom threshold scripting required
Storm Controls
Handling trap floods
✅ Advanced
Per-source rate limiting and dedup built in
⚠️ Limited
External tools needed for dedup or rate limiting
SIEM Forwarding
Export to external platforms
✅ Advanced
Standard OTLP/gRPC Logs export, GA feature
⚠️ Basic
Script-based forwarding or syslog relay
What You See and Control
Structured Trap Logs
Every decoded trap lands as a structured log row in the same Logs UI as your system logs — filterable by trap name, category, severity, source IP, device vendor, and job.
One query workflow for traps and system logs alike
Learn about logs management


Key Takeaways
What makes Netdata’s SNMP trap monitoring fundamentally different.
No Separate Server
Native Go collector receives traps inside the Agent you already run.

Decoded Instantly
150,000+ trap definitions across 800+ vendors resolve OIDs automatically.

Traps Are Logs
Structured trap entries live in the unified Logs UI alongside system logs.

Alerted by Default
~21 health alerts ship ready, covering severity flow and receiver health.

Pair With Polling
Traps are the ceiling, polling is the floor — Netdata does both.

SIEM Ready
Forward decoded traps to your SIEM over standard OTLP/gRPC Logs.
Frequently Asked Questions
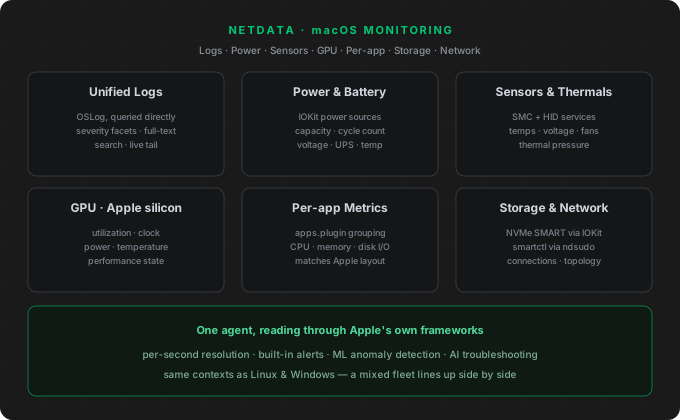
July 15, 2026
Native macOS Monitoring: Logs, Sensors, GPU & Hardware Health
Netdata's latest release brings native macOS logs and hardware telemetry: unified logs through OSLog, battery and power, SMC/HID sensors and thermals, Apple-silicon GPU, per-application metrics, NVMe SMART, and network topology — all read through Apple's own frameworks at per-second resolution.

June 24, 2026
Real Time Network Monitoring: Topology, NetFlow, SNMP
See Netdata's NPM-class network monitoring: live topology, NetFlow and sFlow analysis, SNMP across 200+ profiles, and trap handling. Read the guide now!
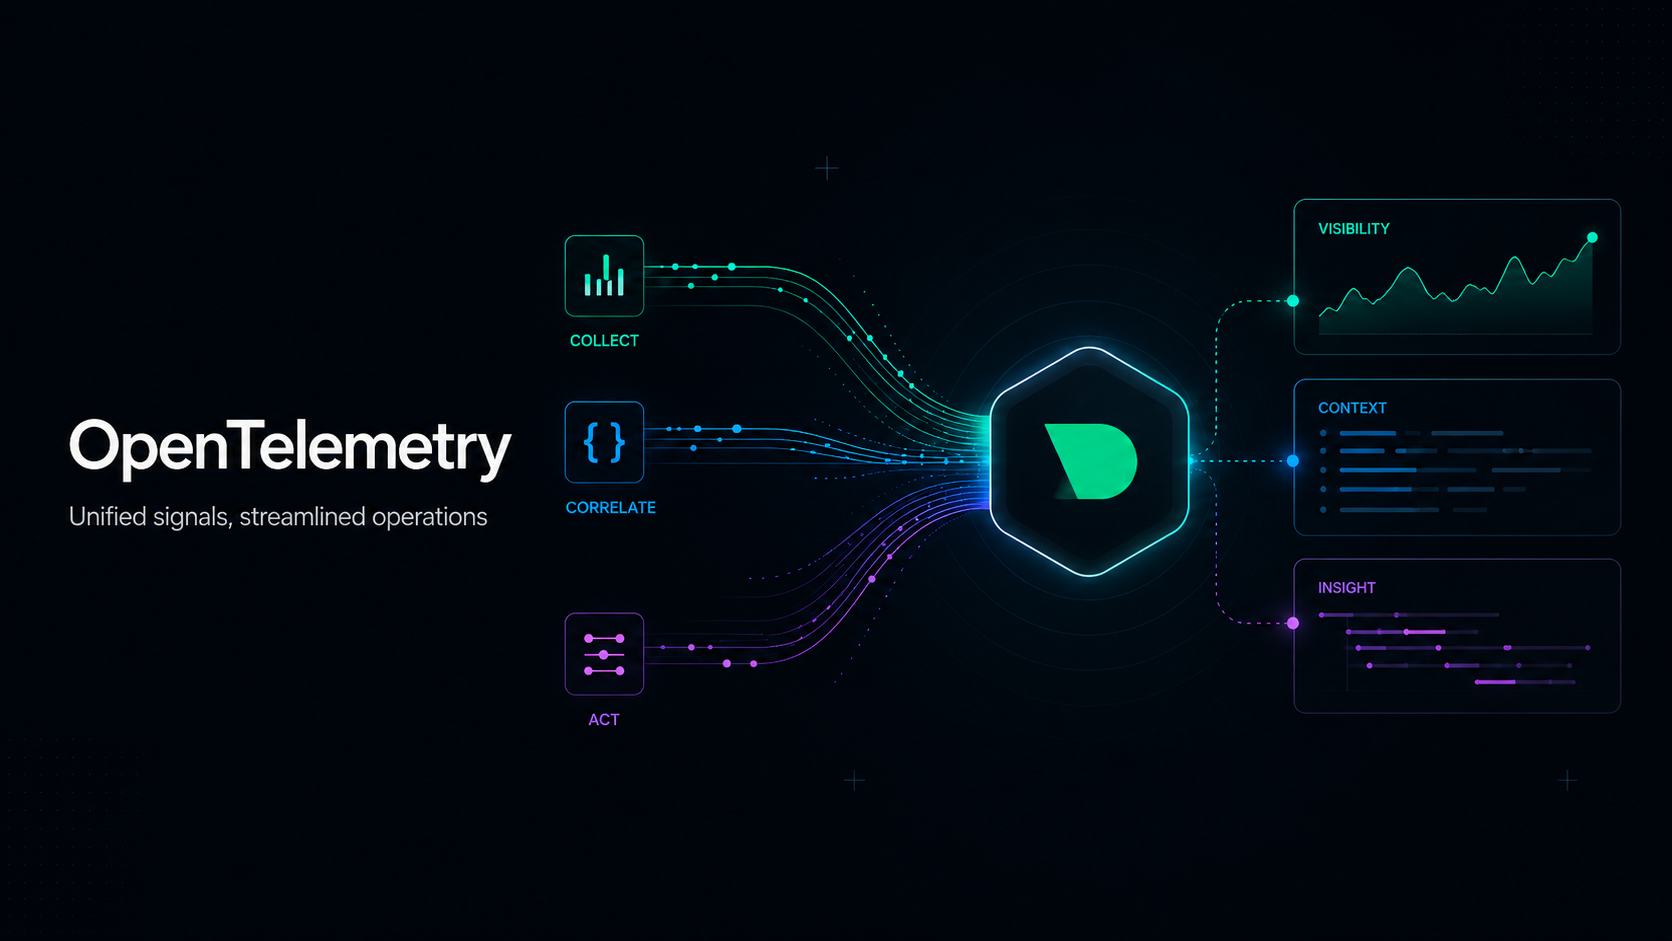
May 15, 2026
OpenTelemetry and Netdata, Today
Ingest OpenTelemetry metrics and logs into Netdata via OTLP for automatic charts, ML, and alerts alongside your existing data. Read the full guide now!