


Operational Intelligence That Works From Day One
Real-time ML anomaly detection on every metric, AI-driven root cause analysis, and natural language troubleshooting - deployed in minutes, not months. Zero configuration. Zero data egress. Zero surprise bills.

Why Netdata Redefines AIOps
Enterprise intelligence without enterprise complexity
80% Faster Resolution
Sub-2-second detection latency with AI-powered root cause analysis surfaces the needle in the haystack - top 30-50 results reveal what matters.
90% Cost Reduction
Transparent per-node pricing with unlimited metrics and logs. No surprise bills from data volume spikes or metric cardinality explosions.
Real-Time at Scale
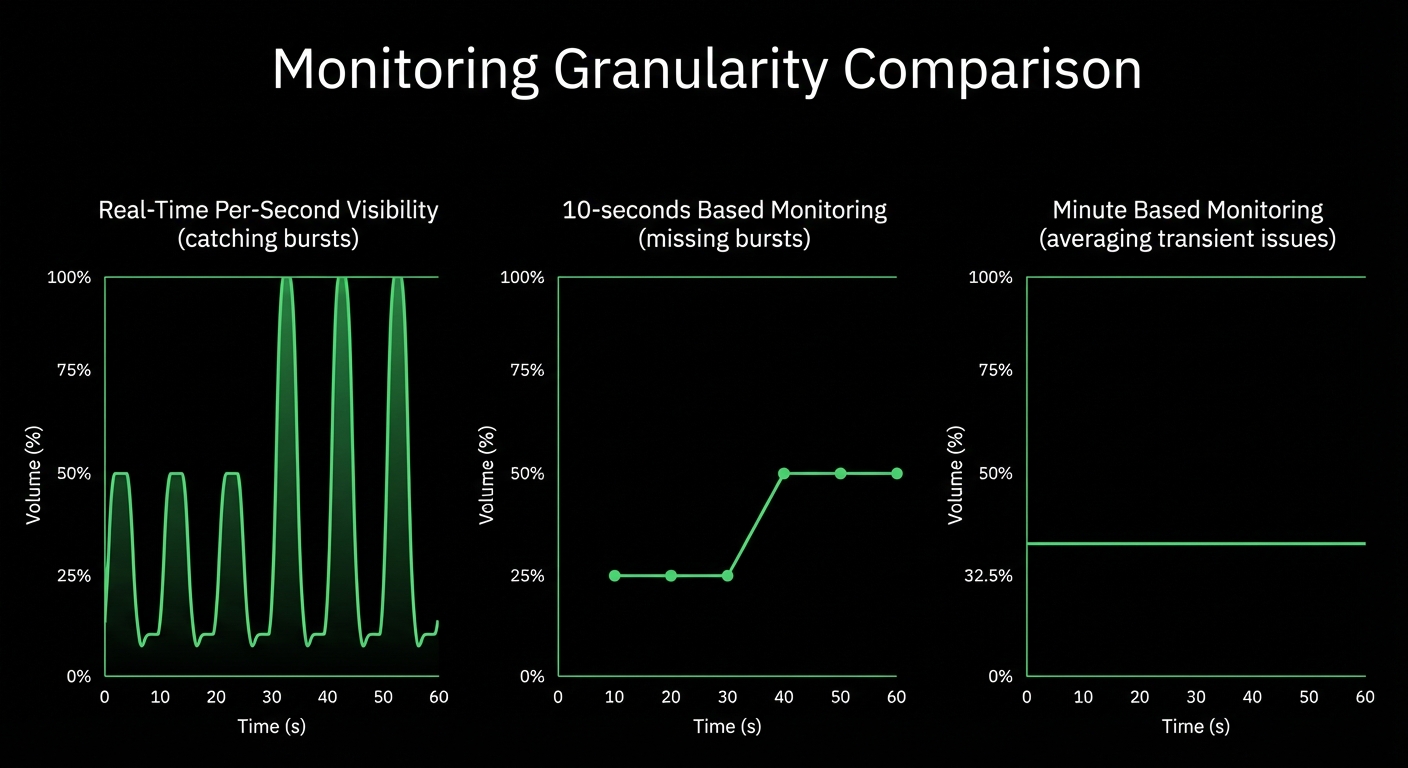
Per-second granularity across 4.5+ billion metrics globally. Catch 2-10 second anomalies invisible to minute-based monitoring.
Edge-Native ML
18-model ensemble per metric with 10⁻³⁶ false positive rate. Complete data sovereignty - all processing at the edge, not in vendor clouds.
Natural Language AI
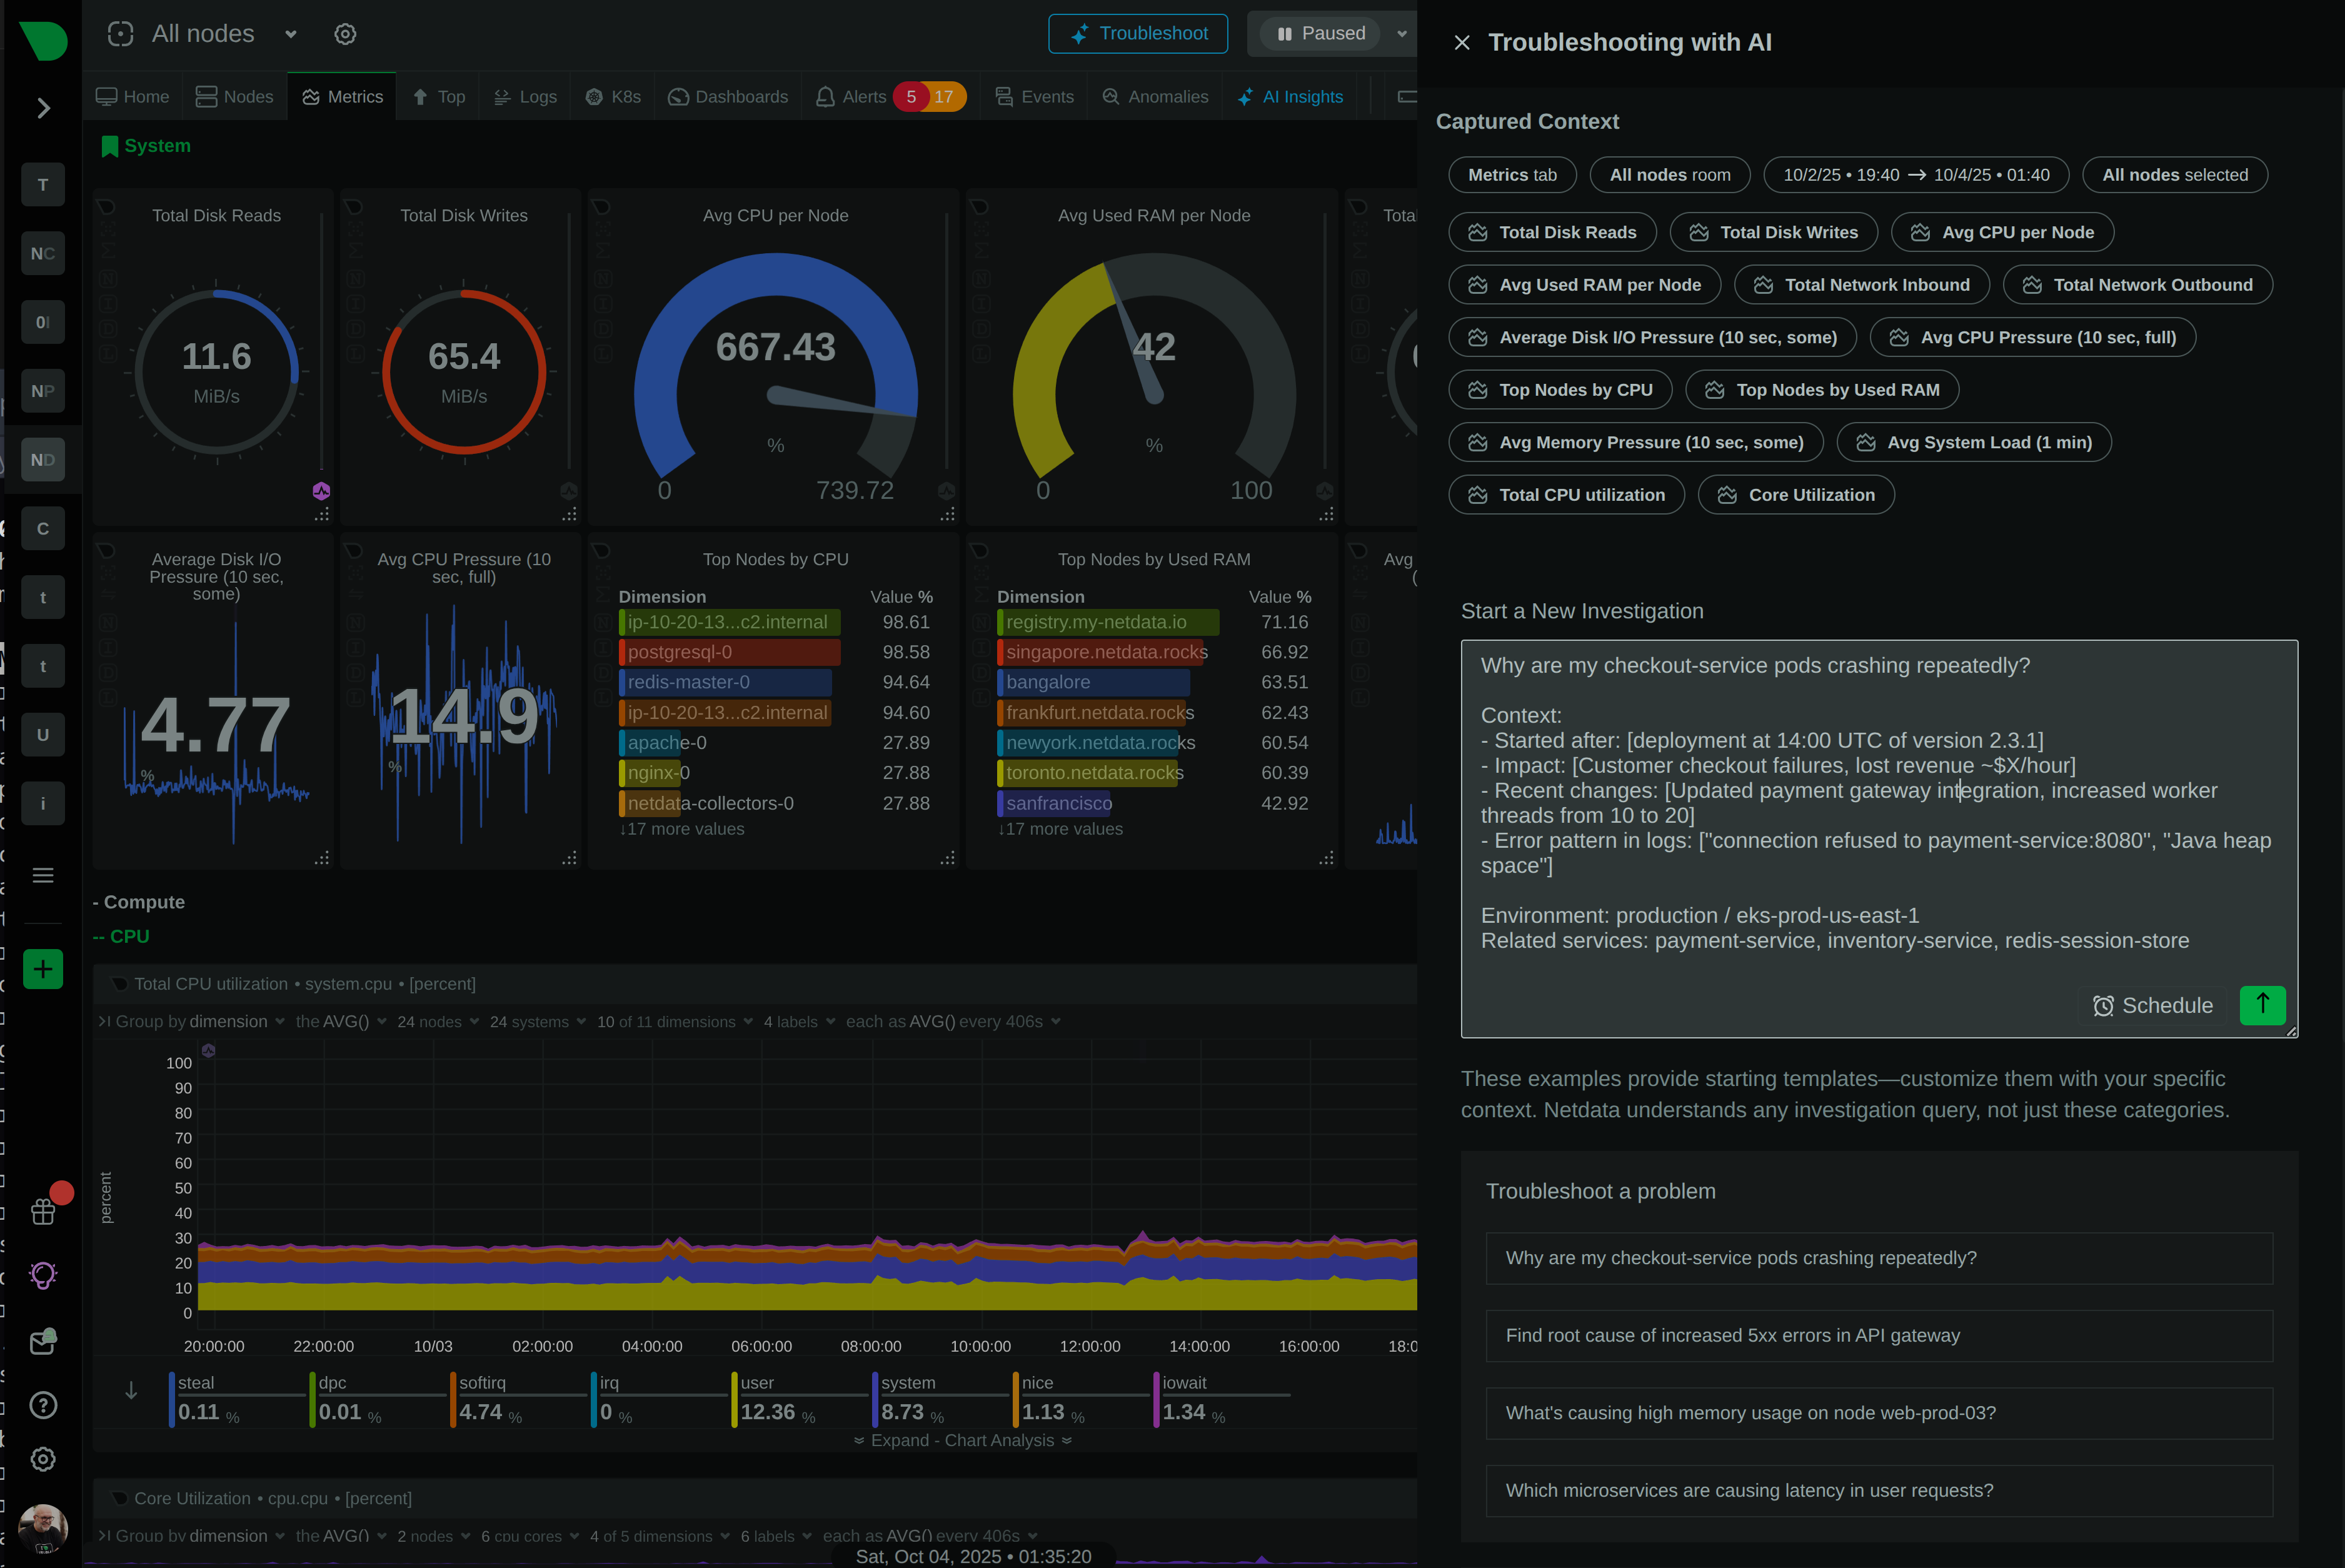
Ask ‘Why is CPU spiking?’ and get evidence-based answers in minutes. No PromQL, no query languages, no specialized skills required.
60-Second Visibility
Full observability in 60 seconds with auto-discovery and algorithmic dashboards. ML training starts automatically, first anomaly detection in 15 minutes.
Trusted by operations teams worldwide


Transform Operations With Intelligent Automation
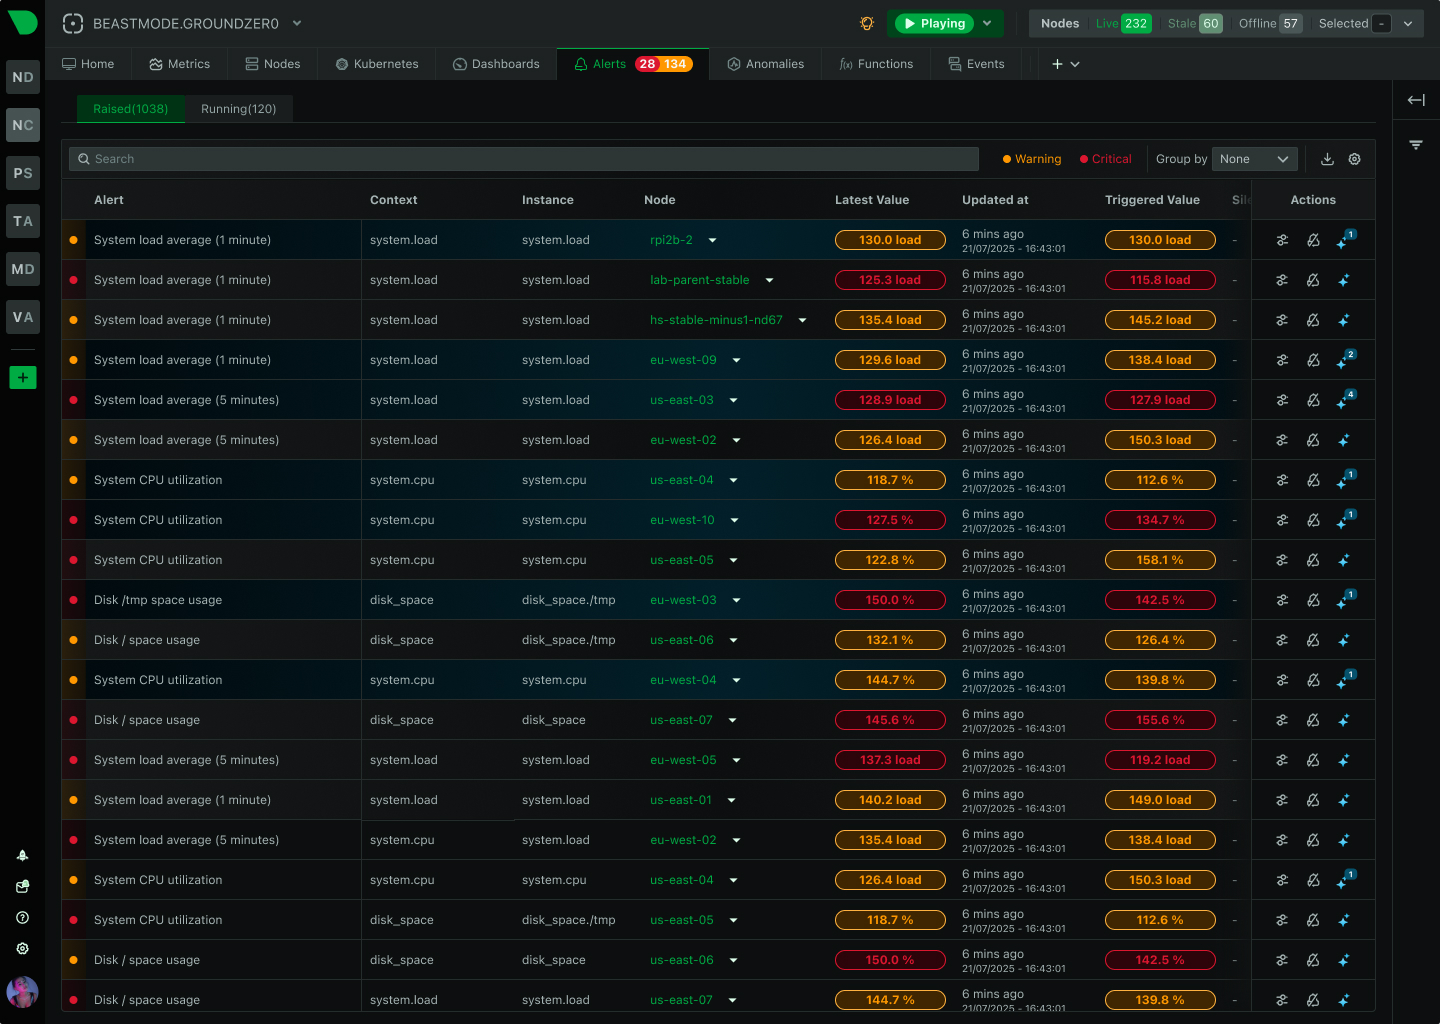
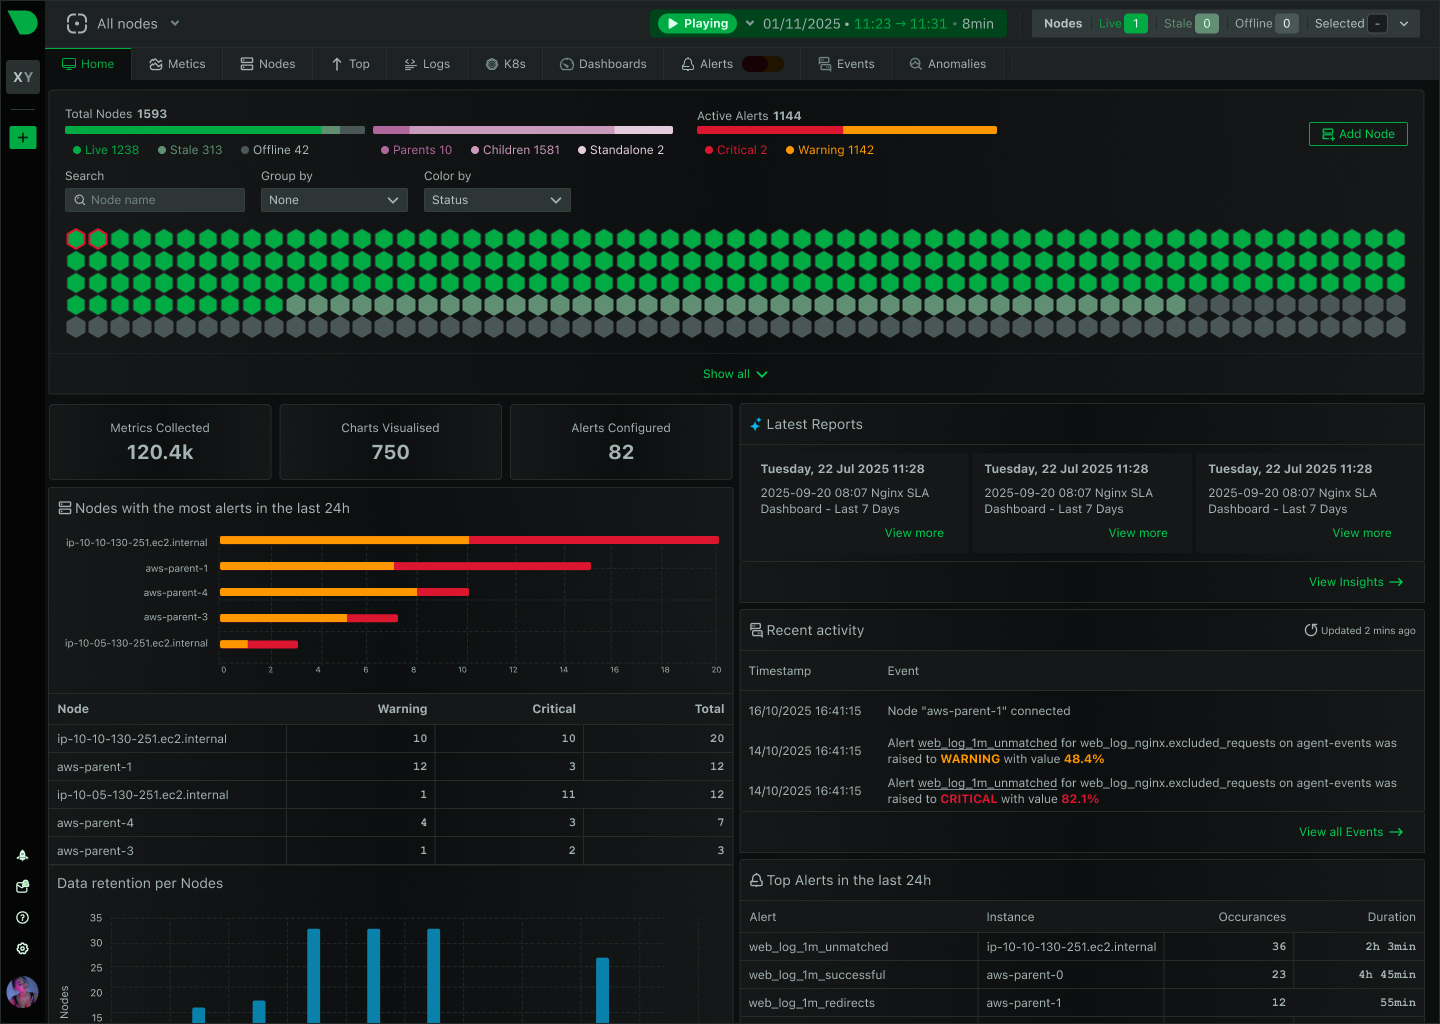
Reduce Alert Fatigue With Component-Level Intelligence
Component-level precision
Explore Smart Alerting
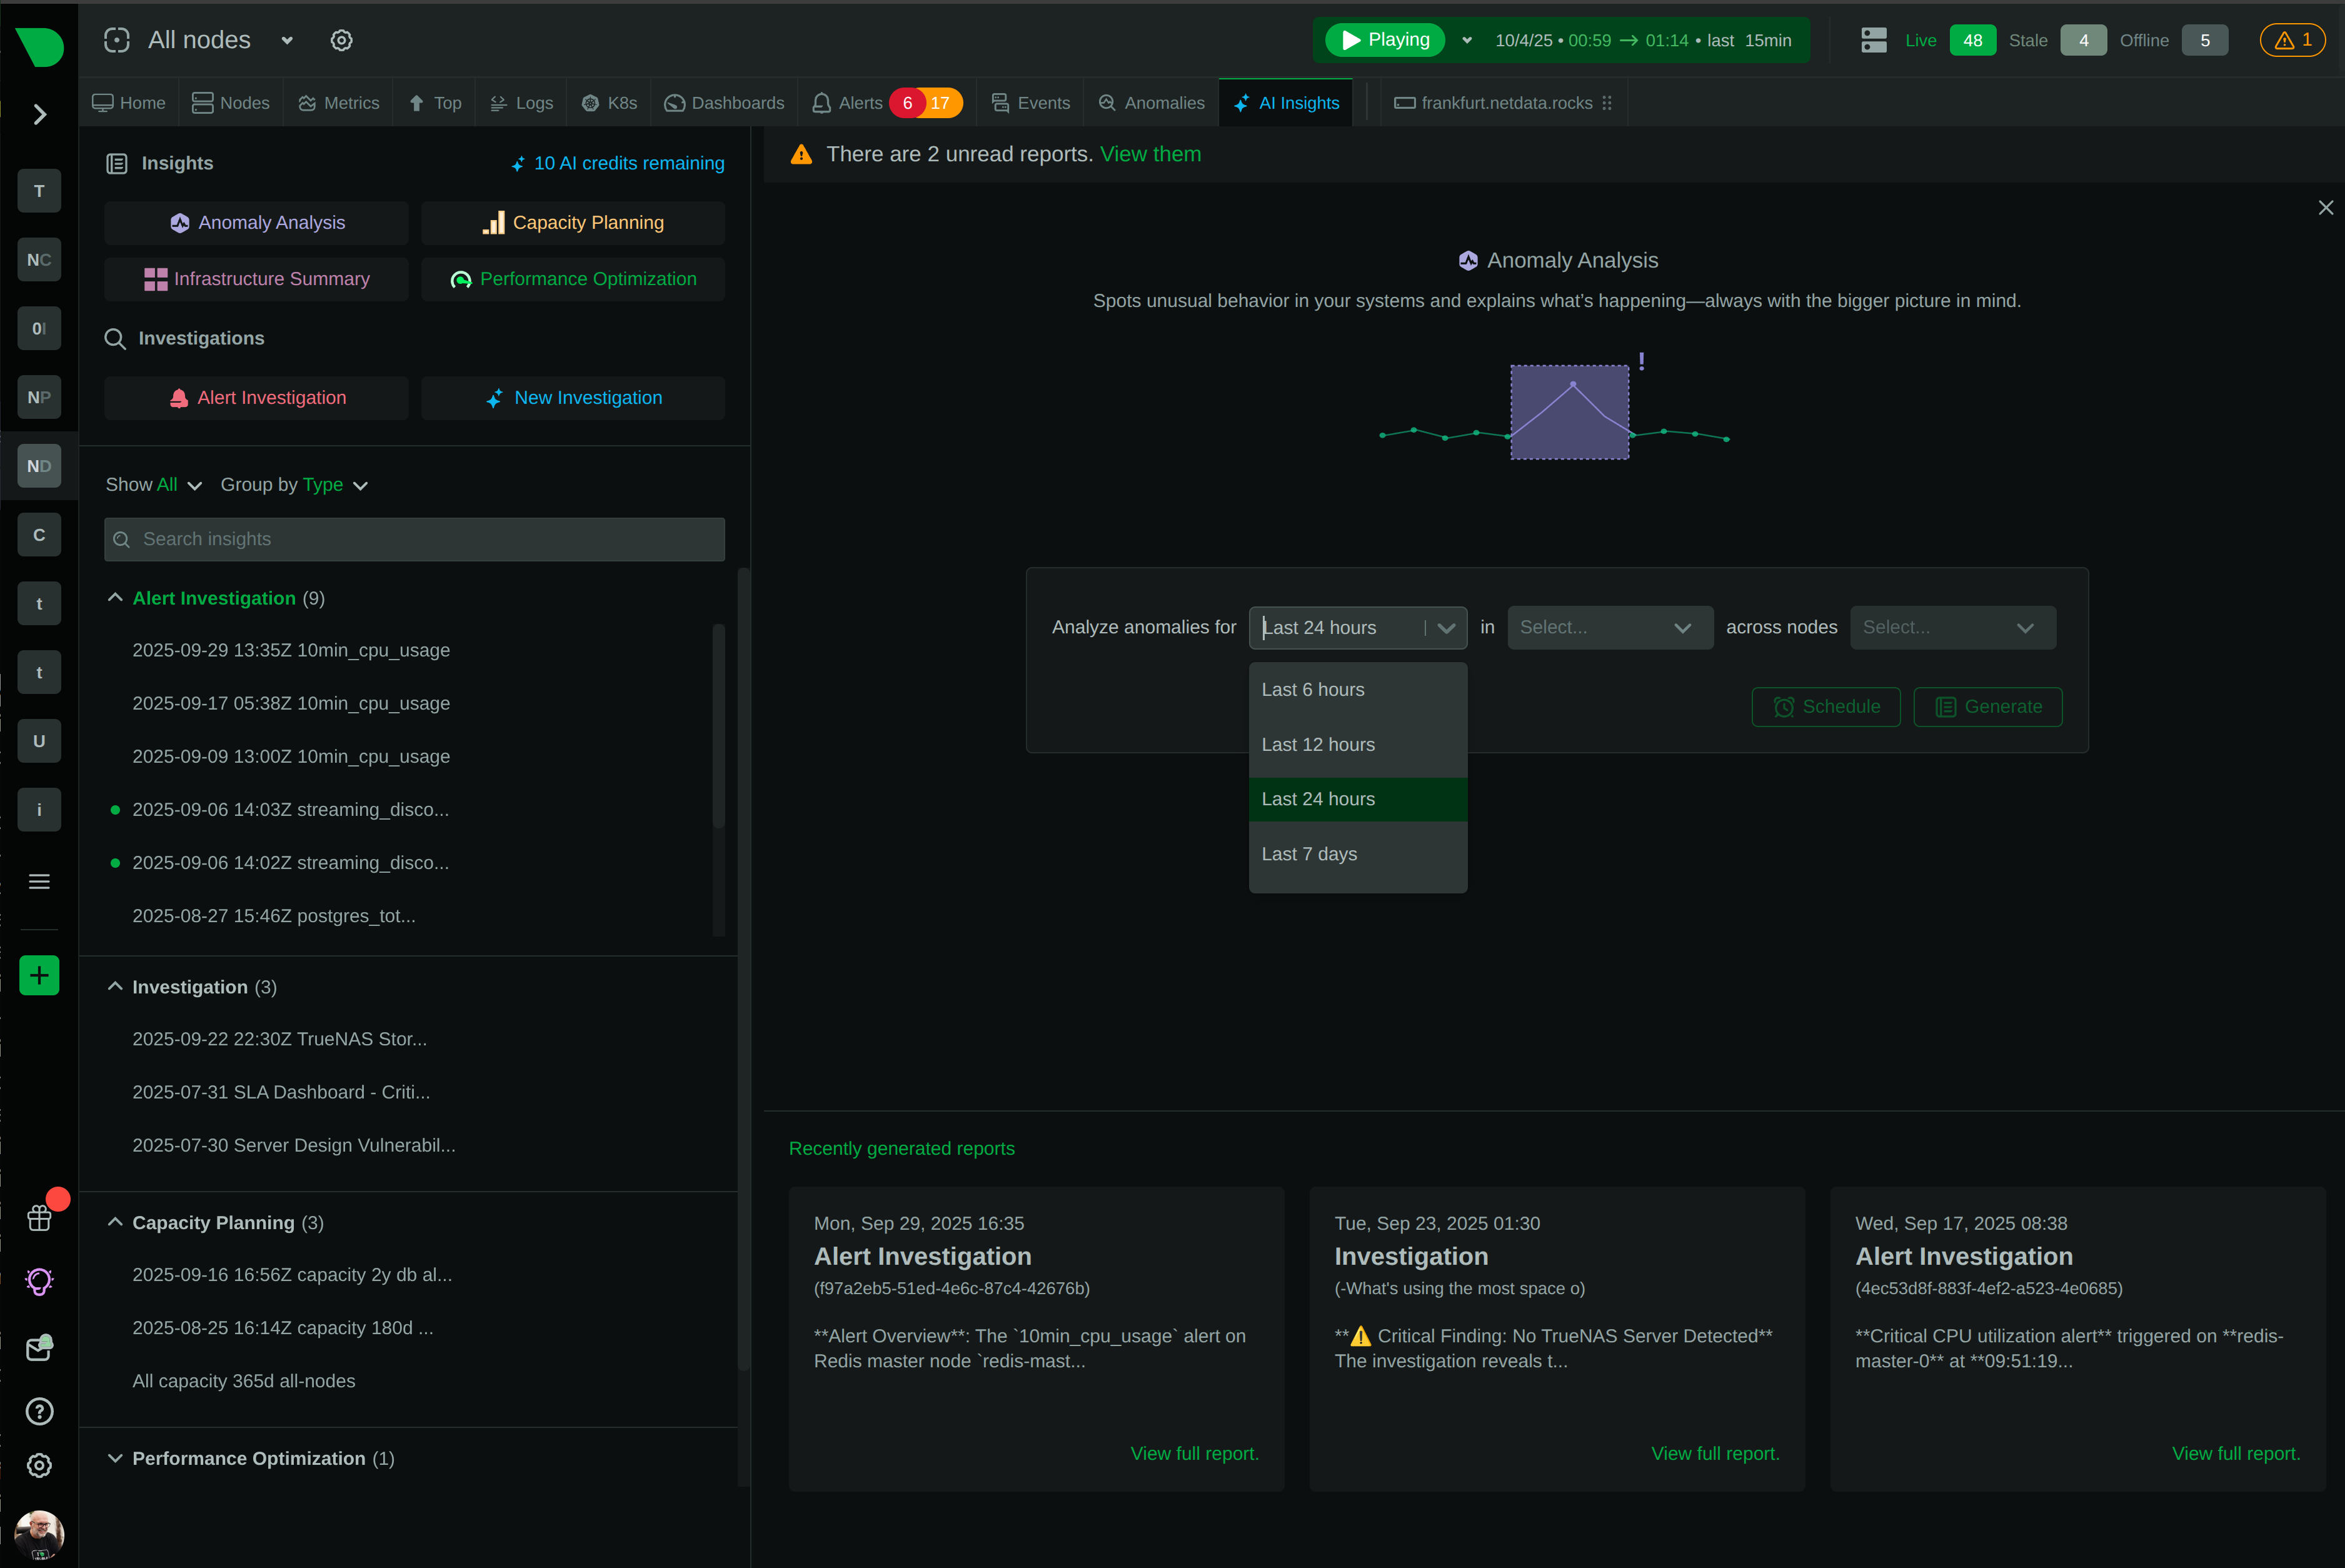
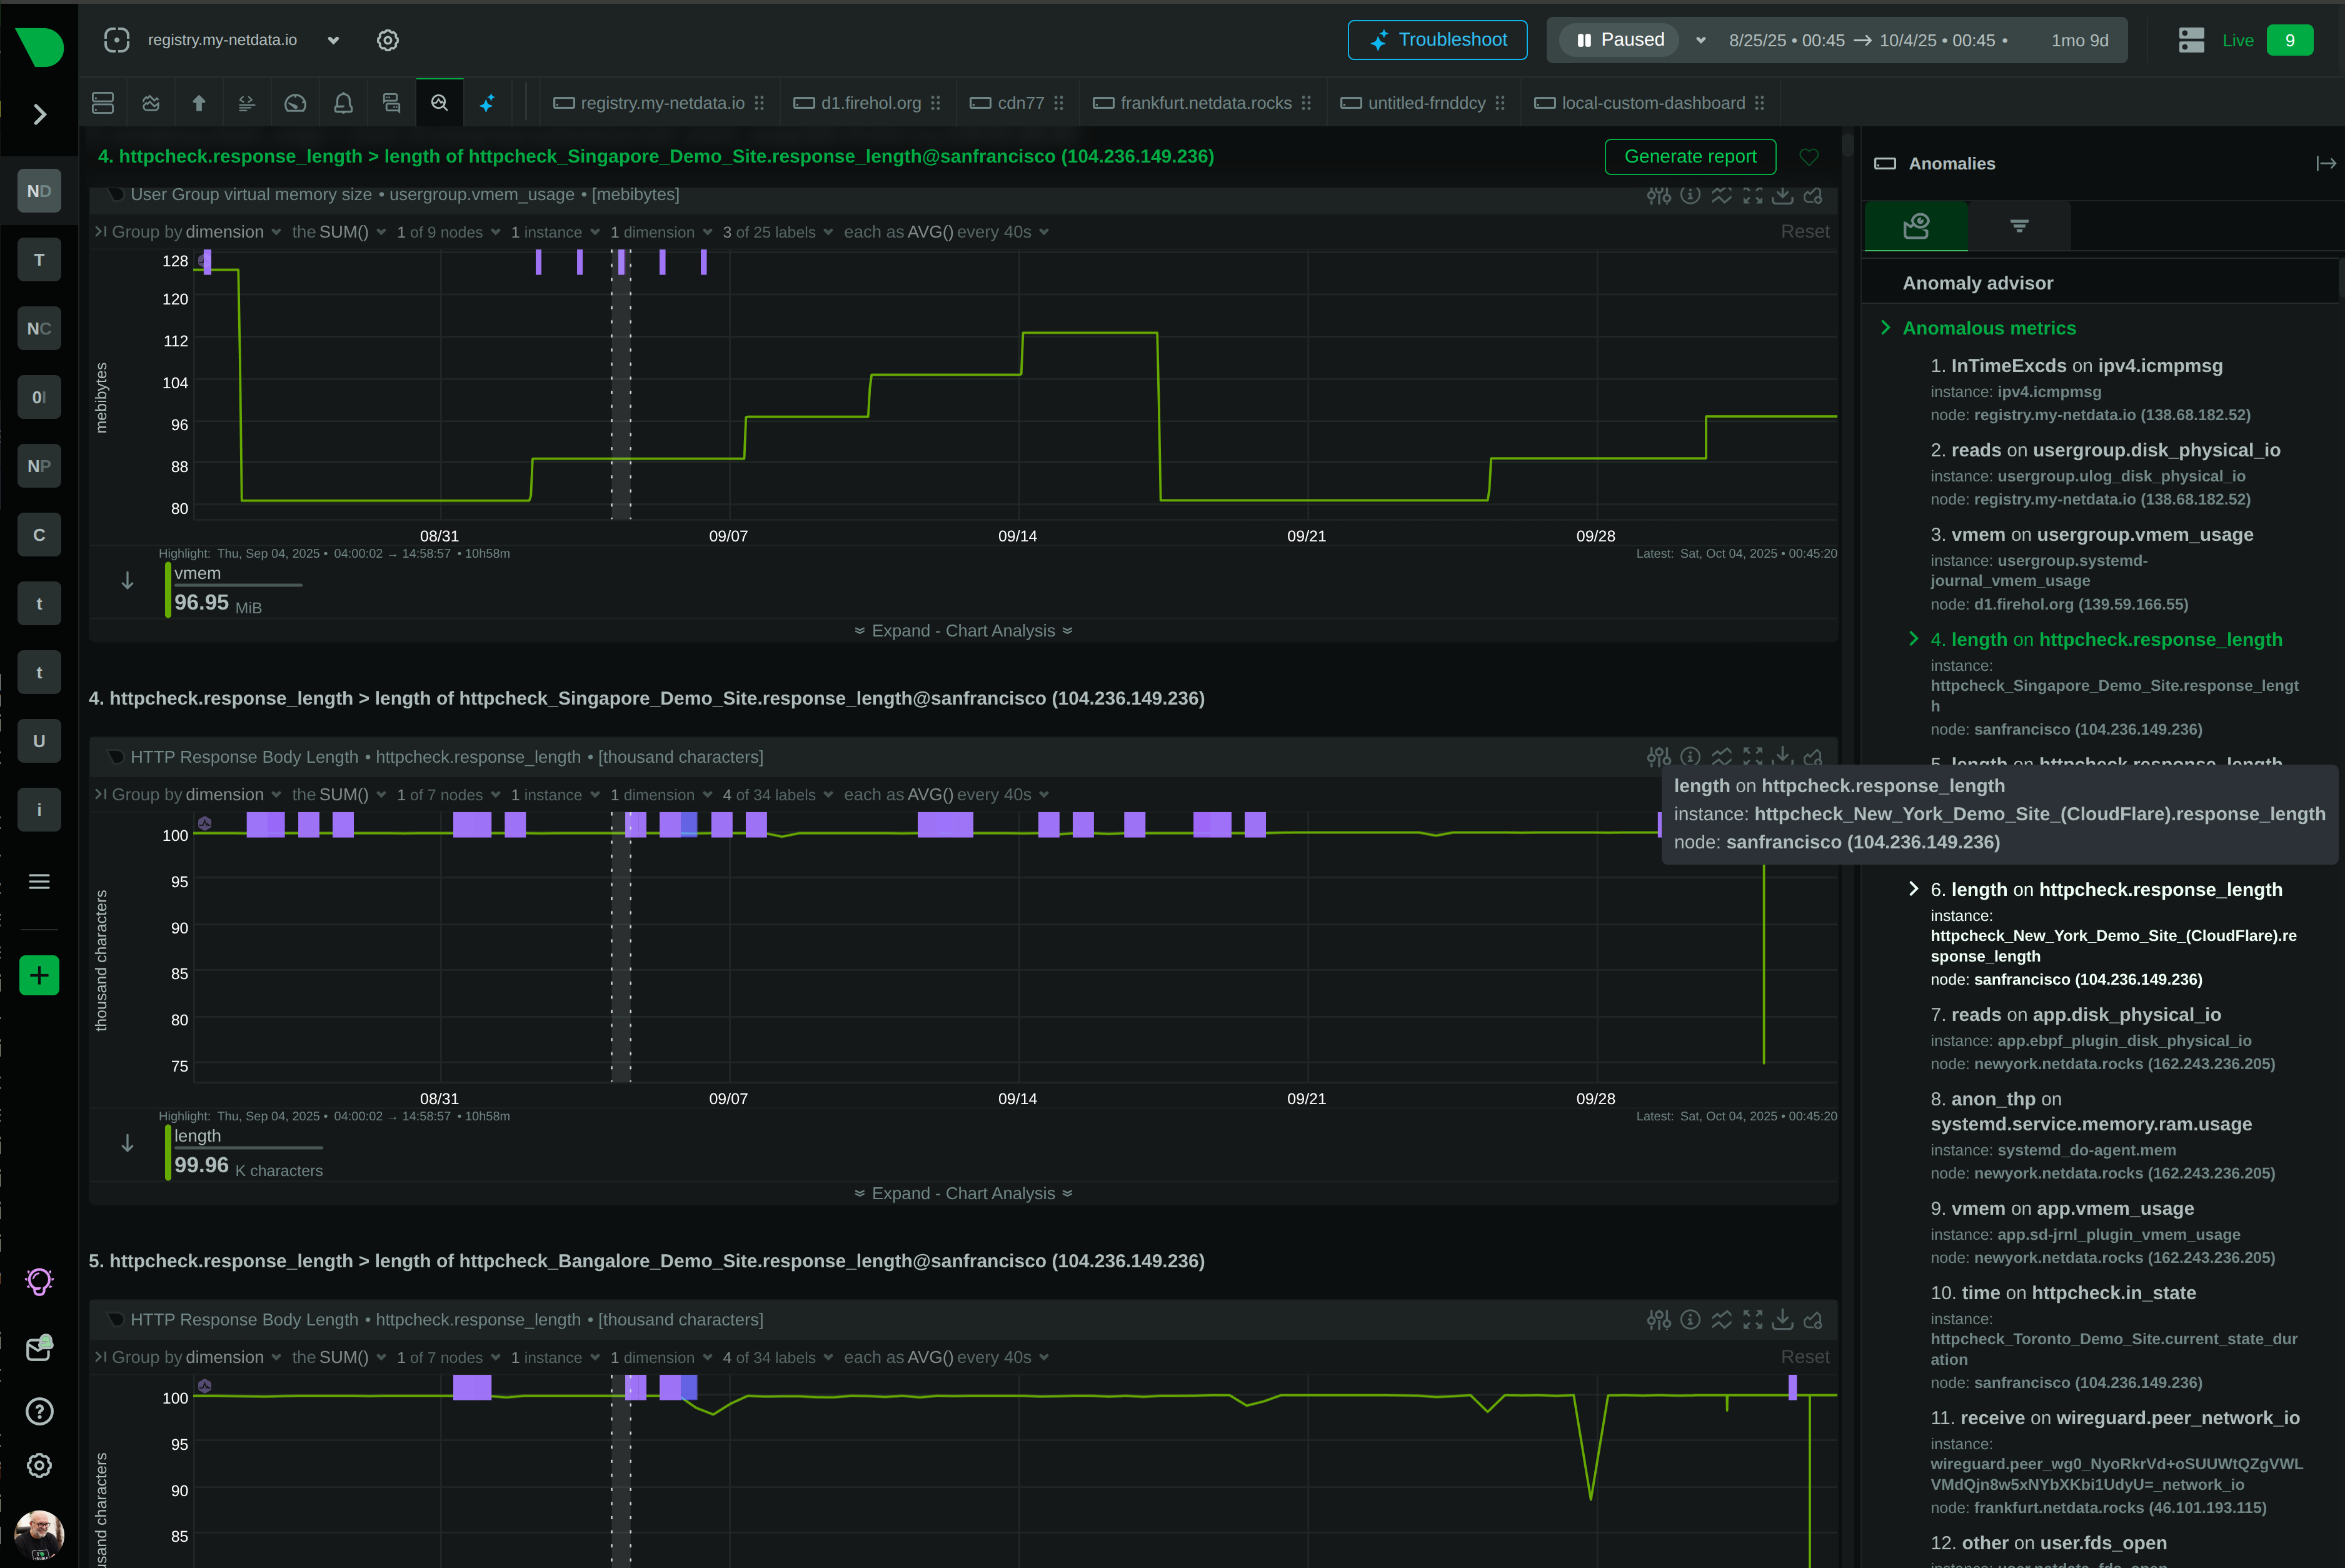
Accelerate Troubleshooting With AI-Powered Investigations
Minutes to resolution, not hours
See AI Co-Engineer
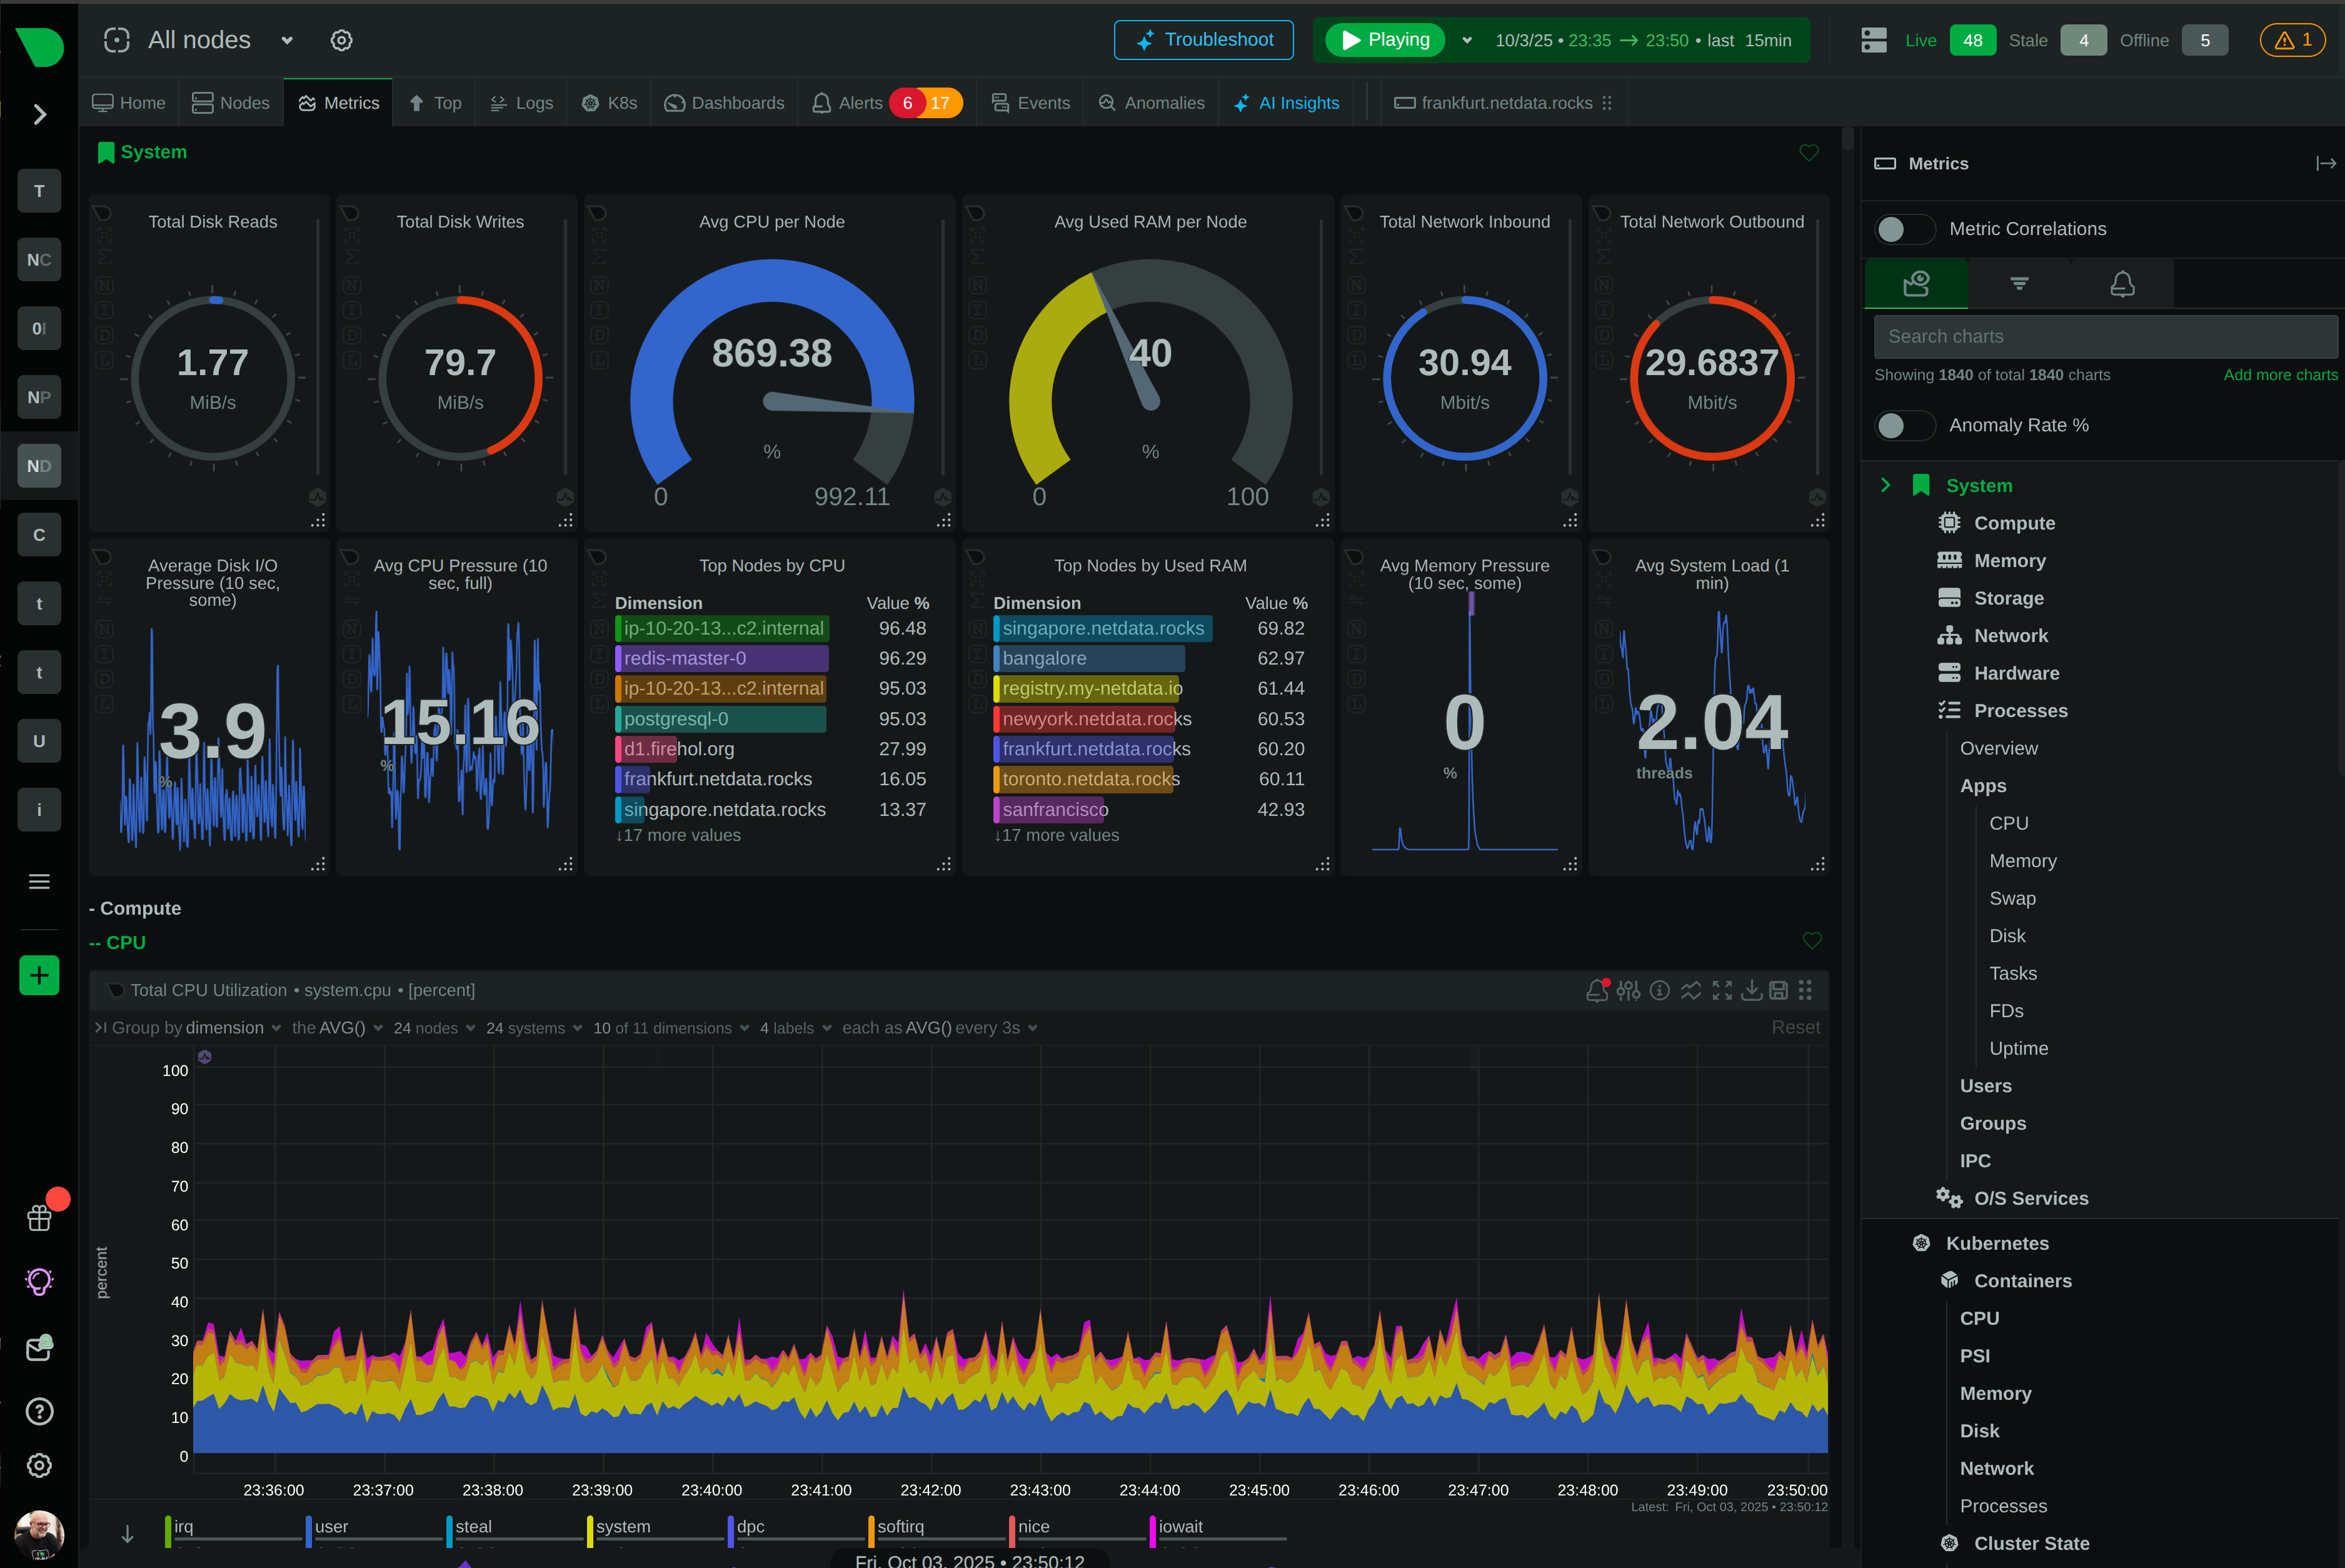
Gain Complete Visibility Without Configuration Burden
10-60× more granular than standard monitoring
Discover Real-Time Monitoring
Scale Intelligence Without Scaling Complexity
<5% CPU, 150-200 MB RAM per agent
Explore Scalability

AIOps Platform Comparison
Enterprise Intelligence at Fraction of the Cost
Netdata delivers real-time AIOps capabilities with transparent economics and complete data sovereignty - without the complexity, delays, or surprise bills of traditional platforms.
Capability
Netdata
Traditional AIOps
Deployment Timeline
✅ 60 seconds
Installation to full visibility
⚠️ Weeks to months
Complex integration projects required
Data Granularity
✅ Per-second
100% sample completeness, zero loss
⚠️ Per-minute
Sampling common, data loss typical
ML Architecture
✅ Edge-native
18 models per metric, local processing
⚠️ Cloud-dependent
Centralized ML with data egress
Detection Latency
✅ Sub-2 seconds
Real-time anomaly flagging at collection
⚠️ 30+ seconds
Batch processing delays insights
False Positive Rate
✅ 10⁻³⁶ theoretical
18-model consensus mechanism
⚠️ Variable
Tuning required for accuracy
Configuration Required
✅ Zero
Auto-discovery, algorithmic dashboards
❌ Extensive
Manual setup, tuning, maintenance
Query Language
✅ None needed
Point-and-click plus natural language AI
❌ Required
PromQL or proprietary query languages
Pricing Model
✅ Predictable per-node
Unlimited metrics, logs, users included
❌ Complex variable
Per-metric and data-volume fees
Data Sovereignty
✅ Complete
All processing and storage at edge
❌ Limited
Data centralized in vendor clouds
Resource Overhead
✅ <5% CPU
150-200 MB RAM, independently validated
⚠️ Good
Varies by implementation
MTTR Improvement
✅ 80% reduction
AI-powered root cause analysis
⚠️ Good
When properly implemented
Implementation Success
✅ Immediate value
Works from installation, no tuning
⚠️ Challenging
Complex deployments require expertise
AI-Embedded Intelligence Throughout the Platform
Unsupervised Anomaly Detection on Every Metric
18-model ensemble per metric trains automatically within 15 minutes, achieving 10⁻³⁶ theoretical false positive rate through consensus. Detects point anomalies, contextual patterns, collective issues, and change points in real-time during data collection.
Edge-native ML with complete data sovereignty
Explore ML Architecture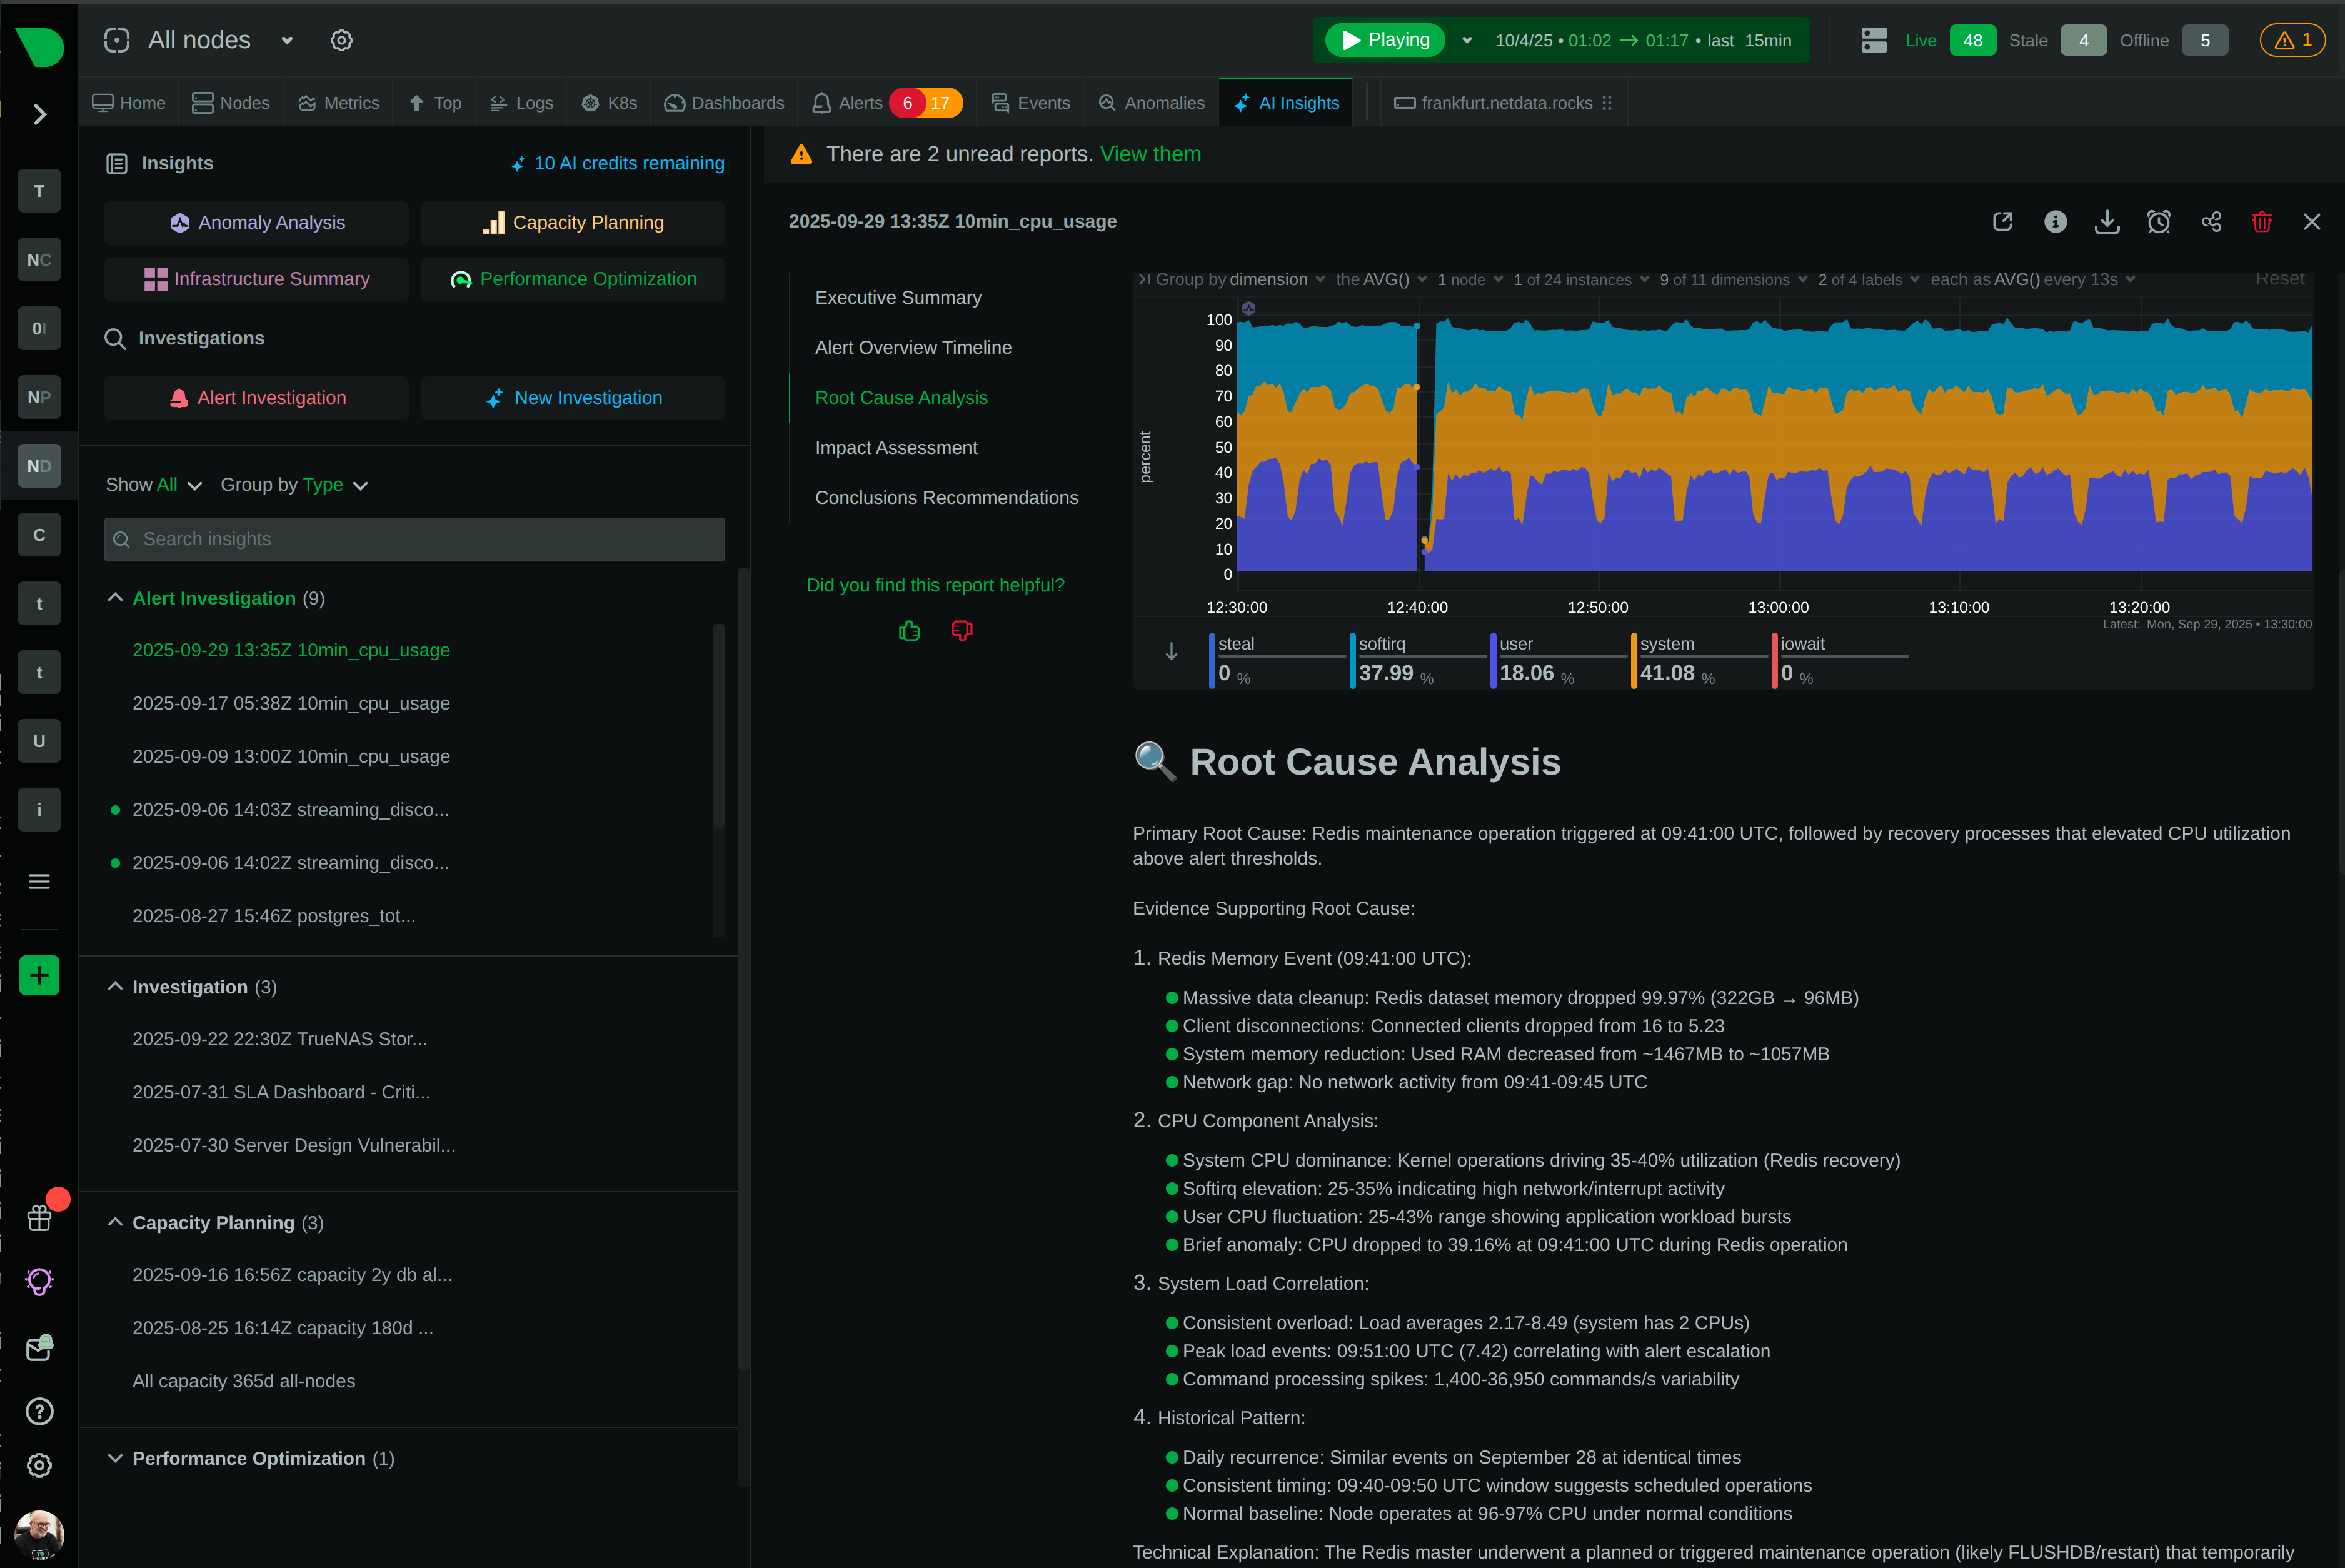
Key Advantages of Netdata AIOps
Enterprise intelligence without enterprise complexity or costs
Instant Time to Value
60-second installation to full visibility. Auto-discovery, algorithmic dashboards, and ML training all start automatically. First anomaly detection in 15 minutes, production-ready without configuration.
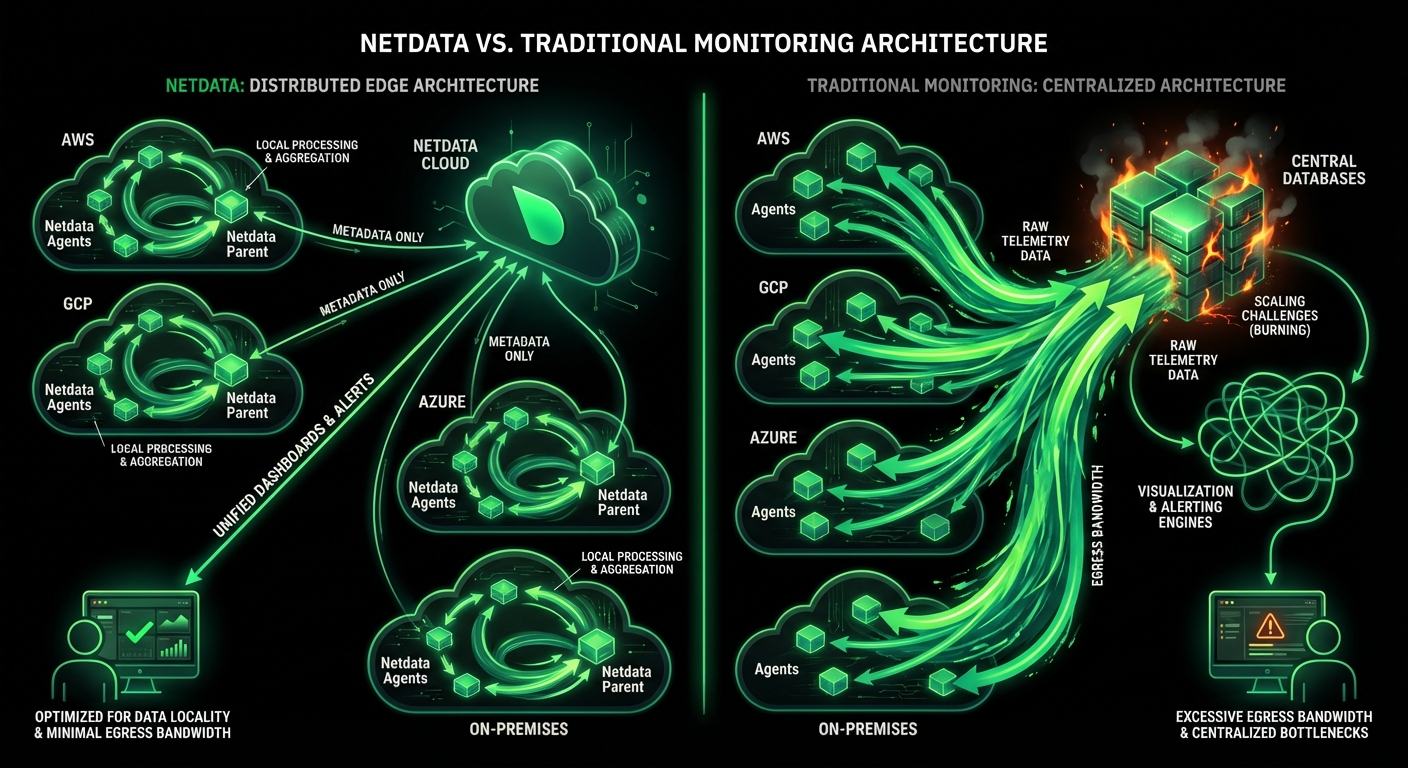
Edge-Native Intelligence
ML processing where data is generated eliminates cloud dependencies, egress costs, and latency. Complete data sovereignty with all observability data staying on-premises.
True Real-Time Performance
Per-second granularity with sub-2-second detection latency. Catch 2-10 second anomalies invisible to minute-based monitoring. Immediate feedback during troubleshooting.
Transparent Economics
Predictable per-node pricing with unlimited metrics, logs, and users. No surprise bills from data volume spikes or metric cardinality. 90% cost reduction vs traditional platforms.
Natural Language Operations
Ask questions in plain language, get evidence-based answers. No PromQL, no query languages, no specialized skills required. AI investigations accessible to every engineer.
Proven at Scale
100,000+ node deployments processing 4.5+ billion metrics per second globally. Linear scalability with no centralized bottlenecks. Independently validated efficiency.
Compliance Ready
SOC 2 Type 2 certified with GDPR, HIPAA, PCI DSS compliance by design. Explainable AI for regulatory requirements. Complete audit trails and data sovereignty.
April 16, 2026
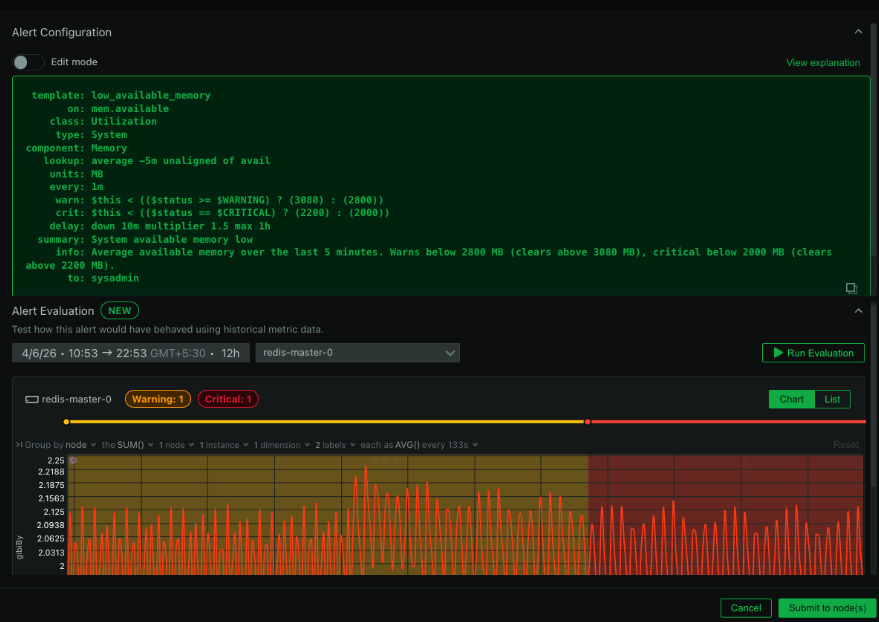
Smarter Alert Management: Test on Historical Data, Review Transitions, and Preview Silencing Schedules
Three new alerting capabilities in Netdata: evaluate alert definitions against historical metrics before deploying, review alert transition timelines, and preview recurring silencing schedules before saving.
April 2, 2026
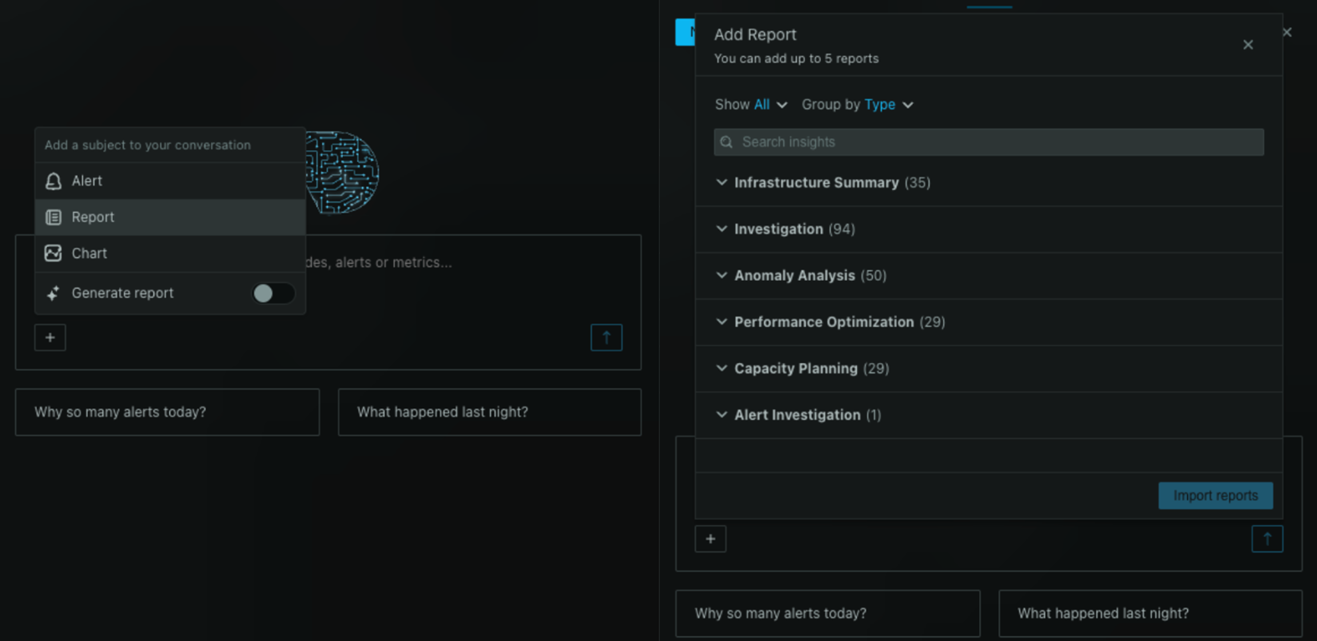
Conversations: Ask Netdata About Anything You're Looking At
Netdata AI now lets you start a conversation about any chart, alert, or Insights report directly from where you're already working. Ask questions, get explanations, and kick off deep-dive investigations without switching context.
December 23, 2025
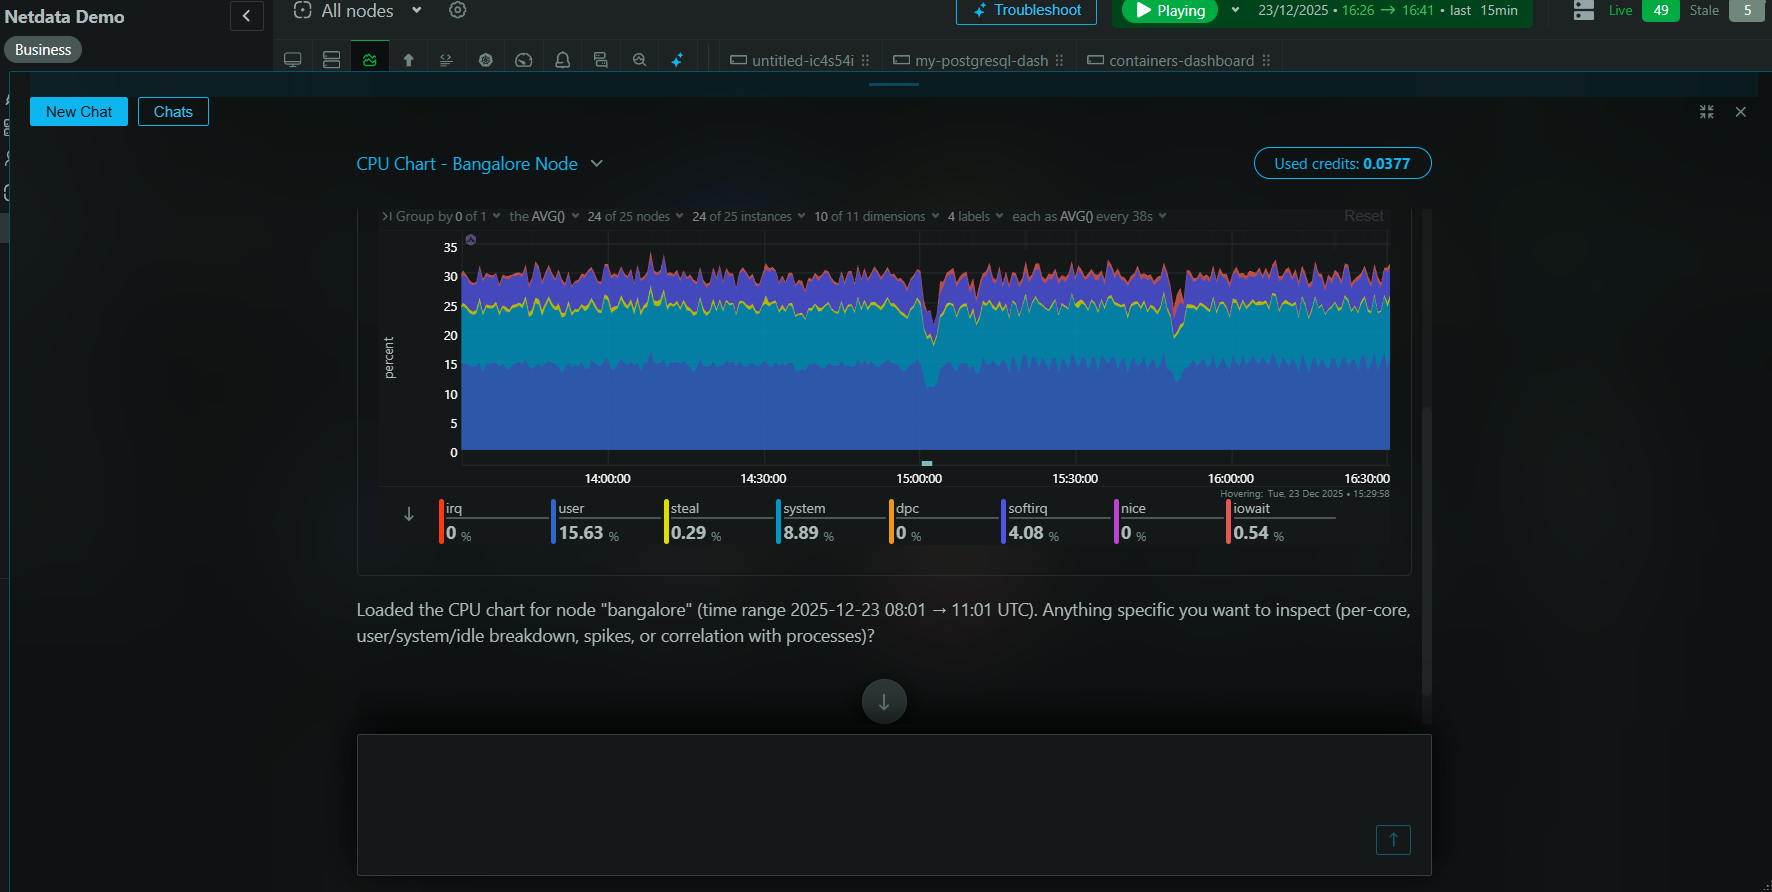
Introducing Real-Time Conversations with Netdata AI
Engage in a live, interactive dialogue with your infrastructure. Introducing a real-time conversational interface that generates charts, logs, and data visualizations on the fly.