
The only agent that thinks for itself
Autonomous Monitoring with self-learning AI built-in, operating independently across your entire stack.
Centralized metrics streaming and storage
Aggregate metrics from multiple agents into centralized Parent nodes for unified monitoring across your infrastructure.
Fully managed cloud platform
Access your monitoring data from anywhere with our SaaS platform. No infrastructure to manage, automatic updates, and global availability.
Deploy Netdata Cloud in your infrastructure
Run the full Netdata Cloud platform on-premises for complete data sovereignty and compliance with your security policies.
Powerful, intuitive monitoring interface
Modern, responsive UI built for real-time troubleshooting with customizable dashboards and advanced visualization capabilities.
Monitor on the go
Native iOS and Android apps bring full monitoring capabilities to your mobile device with real-time alerts and notifications.
The future of infrastructure observability
See our strategic direction across AI-native observability, full-stack signals, operational intelligence, and enterprise platform maturity.
Best energy efficiency
True real-time per-second
100% automated zero config
Centralized observability
Multi-year retention
High availability built-in
Zero maintenance
Always up-to-date
Enterprise security
Complete data control
Air-gap ready
Compliance certified
Millisecond responsiveness
Infinite zoom & pan
Works on any device
Native performance
Instant alerts
Monitor anywhere
AI-native observability
Continuous delivery
Open source foundation
80% Faster Incident Resolution
True Real-Time and Simple, even at Scale
90% Cost Reduction, Full Fidelity
Single Pane of Glass
Control Without Surrender
Integrations
800+ collectors and notification channels, auto-discovered and ready out of the box.
Reduced monitoring costs by 46% while cutting staff overhead by 67%.
— Leonardo Antunez, Codyas
No data shipping. No central storage costs. Query at the edge.
So many out-of-the-box features! I mostly don't have to develop anything.
— Simon Beginn, LANCOM Systems
Point-and-click troubleshooting. No PromQL, no LogQL, no learning curve.
Enterprise efficiency without enterprise complexity—real ROI from day one.
— Leonardo Antunez, Codyas
Zero data egress. Only metadata reaches the cloud. Your metrics stay on your infrastructure.
Auto-discovered and configured. No manual setup required.
Slack, PagerDuty, Teams, email, webhooks—all built-in.
Built for the People Who Get Paged
Every Industry Has Rules. We Master Them.
Monitor Any Technology. Configure Nothing.
Complete Visibility. Total Control.
Don't Take Our Word for It


Netdata gives more than you invest in it. A rare unicorn that obeys the Pareto rule.
— Eduard Porquet Mateu, TMB Barcelona
Reduced website downtime by 99% and cloud bill by 30% using Netdata alerts.
— Falkland Islands Government
Optimized resource allocation based on Netdata alerts cut cloud spending by 30%.
— Falkland Islands Government
Reduced monitoring staff by 67% while cutting operational costs by 46%.
— Codyas
Netdata has agent capacity or a plugin for everything, including Windows and Kubernetes.
— Eduard Porquet Mateu, TMB Barcelona
So many out-of-the-box features! I mostly don't have to develop anything.
— Simon Beginn, LANCOM Systems
From 2-3 minutes to 30 seconds—instant visibility into any node issue.
— Matthew Artist, Nodecraft
20% less downtime and 40% budget optimization from out-of-the-box monitoring.
— Simon Beginn, LANCOM Systems
Pay per Node. Unlimited Everything Else.
One price per node. Unlimited metrics, logs, users, and retention. No per-GB surprises.
What's Your Monitoring Really Costing You?
Most teams overpay by 40-60%. Let's find out why.
Your Infrastructure Is Unique. Let's Talk.
Because monitoring 10 nodes is different from monitoring 10,000.
Monitoring That Sells Itself
Deploy in minutes. Impress clients in hours. Earn recurring revenue for years.
Per-Second Metrics at Homelab Prices
Same engine, same dashboards, same ML. Just priced for tinkerers.
$1,000 Per Referral. Unlimited Referrals.
Your colleagues get 10% off. You get 10% commission. Everyone wins.
"Netdata's significant positive impact" — LANCOM Systems
Compare vs Datadog, Grafana, Dynatrace
"Cut costs by 46%, staff by 67%" — Codyas
"Reduced cloud bill by 30%" — Falkland Islands Gov
"Better observability with Netdata than combining other tools." — TMB Barcelona
DPA, SLAs, on-prem, volume pricing
One command, 30 seconds, real data—no sandbox needed
Auto-config + per-node pricing = predictable profit
8-episode Netdata tutorial by LearnLinux.tv
3rd most starred monitoring project
Customers report 40-67% cost cuts, 99% downtime reduction
Free tier lets them try before they buy
AI Support Assistant, Available 24/7
Nedi has access to all official documentation, source code, and resources. Ask any question about Netdata—responds in your language.
Engineering Insights & Product Updates

Apr 2026
Nagios Plugins Collector: Run Your …
A lot of teams have a collection of Nagios …
Apr 2026
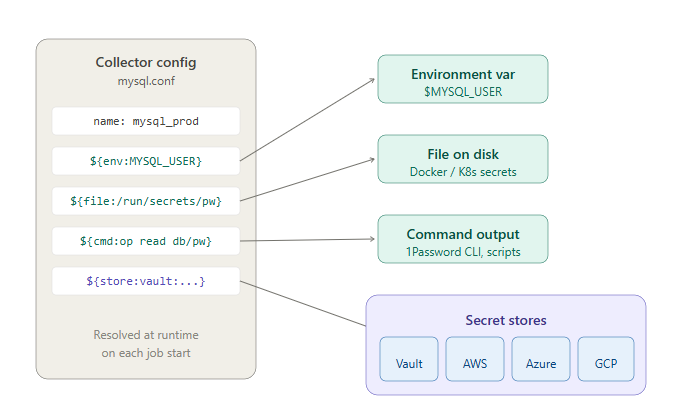
Secrets Management: Get Credentials Out …
If you’re running Netdata collectors …
Apr 2026
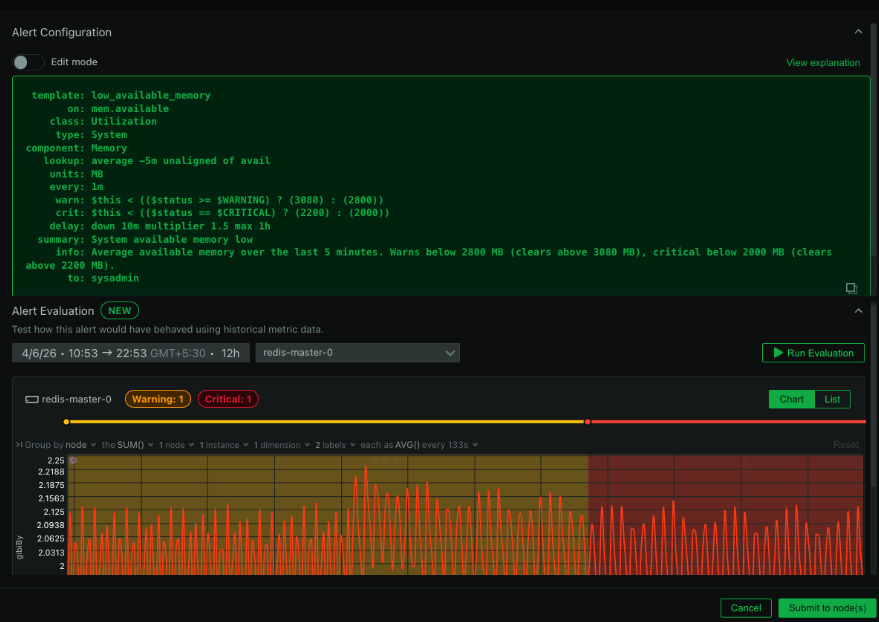
Smarter Alert Management: Test on …
Alert fatigue usually isn’t caused by …
Apr 2026
TV Mode: Put Your Dashboards on the Big …
One of the most common requests we’ve …
Never Fight Fires Alone
Docs, community, and expert help—pick your path to resolution.
60 Seconds to First Dashboard
One command to install. Zero config. 850+ integrations documented.
Level Up Your Monitoring
76,000+ Engineers Strong
Per-Second. 90% Cheaper. Data Stays Home.
See why teams switch from Datadog, Prometheus, Grafana, and more.
> Browse all comparisonsTrace issues directly in the source code
Get architecture recommendations
One of the most popular open-source monitoring projects
Enterprise-grade security and compliance
Your metrics stay on your infrastructure
"Most energy-efficient monitoring solution" — ICSOC 2023, peer-reviewed
"Doesn't miss alerts—mission-critical trust for safety software"
Global community improving monitoring for everyone
Trusted by teams worldwide
Free forever, fully open source agent
Work from anywhere, async-friendly culture
Your work helps millions of systems

Monitoring 101
Comprehensive Monitoring Guides
Learn how to monitor any technology with Netdata. Step-by-step guides for databases, web servers, containers, cloud services, and more.
1wiresensors
4d Server
8430ft Modem
Activemq
Ad
Adaptecraid
Alamos Fe2
Am2320
Amd Smi
Ap
Apache
Apcupsd
Apicast
Authlog
Aws Cloudwatch
Aws Ec2
Aws Quota
Aws Rds
Beanstalk
Bind9
Bird
Blackbox
Boinc
Bosh
Bungeecord
Cassandra
Celery
Ceph
Chia
Chrony
Cilium Agent
Cilium Operator
Cilium Proxy
Clamd
Clamscan
Clash
Clickhouse
Clm5ip
Cloud Foundry Firebase
Cloud Foundry
Cmon
Cockroachdb
Colab
Collectd
Concourse
Consul
Coredns
Couchbase
Couchdb
Crowdsec
Cryptowatch
Discourse
Dmarc
Dmcache
Dnsbl
Dnsdist
Dnsmasq Dhcp
Dnsmasq Dhcp
Dnsmasq
Dnsquery
Docker Engine
Docker Engine
Docker
Dockerhub
Dotnet
Dovecot
Dutch Electricity Smart Meter
Dynatrace
Elasticsearch
Elgato Keylight
Enclosure
Energid
Energomera
Envoy
Eos Web
Etcd
Ethtool
Exim
Fail2ban
Fastd
Filecheck
Fluentd
Freebsd Nfs
Freebsd Rctl
FreeBSD
Freeradius
Freifunk
Frrouting
Ftbeerpi
Gcp Gce
Gcp Stackdriver
Gcp
Gearman
Generic
Geth
Github Ratelimit
Github Repo
Gitlab Runner
Gobetween
Google Pagespeed
Gpsd
Grafana
Graylog
Halon
Hana
Haproxy
Hddtemp
Hdfs
Hitron Coda
Homebridge
Homey
Honeypot
Hpssa
Http Endpoints
Httpcheck
Hubble
Ibm Aix Njmon
Ibm Cex
Ibm Mq
Ibm Spectrum Virtualize
Ibm Spectrum
Ibm Zhmc
Icecast
Iis
Influxdb
Intelgpu
Ipfs
Isc Dhcpd
Isc Dhcpd
Iscbind
Jarvis
Jenkins
Jmx
Journald
K8s Kubelet
K8s Kubeproxy
K8s State
Kafka Consumer Lag
Kafka Zookeeper
Kafka
Kannel
Keepalived
Ksm
Kubelet
Kubeproxy
Lighttpd
Linode
Litespeed
Logind
Logstash
Loki
Lsx
Lustre
Lvm
Lynis
Maxscale
Megacli
Meilisearch
Mesos
Minecraft
Modbus Rtu
Mogilefs
Mongodb
Monit
Mosquitto
Mqtt Blackbox
Msexchange
Mssql
Mtail
Mysql
Nagios
Nats
Nature Remo
Netapp Ontap
Netapp Solidfire
Netatmo
Nextcloud
Nextdns
Nginx
Nginxplus
Nginxunit
Nginxvts
Nrpe
Nsd
Ntpd
Nvidia Smi
Nvidia
Nvme
Obs Studio
Openrc
Openroadm
Openvpn Status Log
Openvpn
Openvpn Status Log
Openvswitch
Openweathermap
Patroni
Pgbackrest
Pgbouncer
Pgpool2
Philips Hue
Phpdaemon
Phpfpm
Pihole
Pika
Pimoroni Enviro Plus
Ping
Podman
Portcheck
Postfix
Postgres
Postgresql
Powerdns Recursor
Powerdns
Powerdns Recursor
Powerpal
Proftpd
Prometheus
Proxmox
Proxysql
Pulsar
Puppet
Pws
Rabbitmq
Radio Thermostat
Radius
Raritan Pdu
Redis Queue
Redis
Response Time
Rethinkdb
Retroshare
Riakkv
Ripe Atlas
Rspamd
S7 Plc
Sabnzbd
Salicru Eqx
Samba
Scaleio
Sense Energy
Sensors
Shelly
Site24x7
Slurm
Sma Inverter
Smartctl
Smartd
Sml
Snmp
Softether
Solis
Solr
Sonic
Spacelift
Sphinx
Spigotmc
Springboot2
Sql
Squid
Squidlog
Starlink
Statuspage
Steam A2s
Storcli
Storidge
Strongswan
Sunspec
Supervisord
Suricata
Synology Activebackup
Sysload
Systemdunits
Tacas
Tado
Tankerkoenig
Tcpendpoints
Tengine
Tesla Vehicle
Tesla Wall Connector
Tomcat
Tor
Traefik
Twitch
Typesense
Ubiquity Ufiber
Unbound
Upsd
Uptimerobot
Uwsgi
Varnish
Vault Pki
Vcsa
Vernemq
Vertica
Vscode
Vsphere
W1sensor
Warp10
Weblog
Webserverslog
Whois
Whoisquery
Windows
Wireguard
X509
X509check
Xiaomi Mi Flora
Yourls
Yugabytedb
Zerto
Zfspool
Zookeeper
Book Your Free Demo
See how Netdata can improve visibility, reduce downtime, and simplify monitoring — no commitment required.