


Real-Time Observability That Works at Scale
Netdata delivers per-second visibility with ML-based anomaly detection on every metric, AI-powered root cause analysis, and 90% cost reduction. Zero configuration. Component-level alerts. Complete data sovereignty.

Why SRE Teams Choose Netdata
Solve the biggest observability challenges facing modern SRE teams
80% Faster MTTR
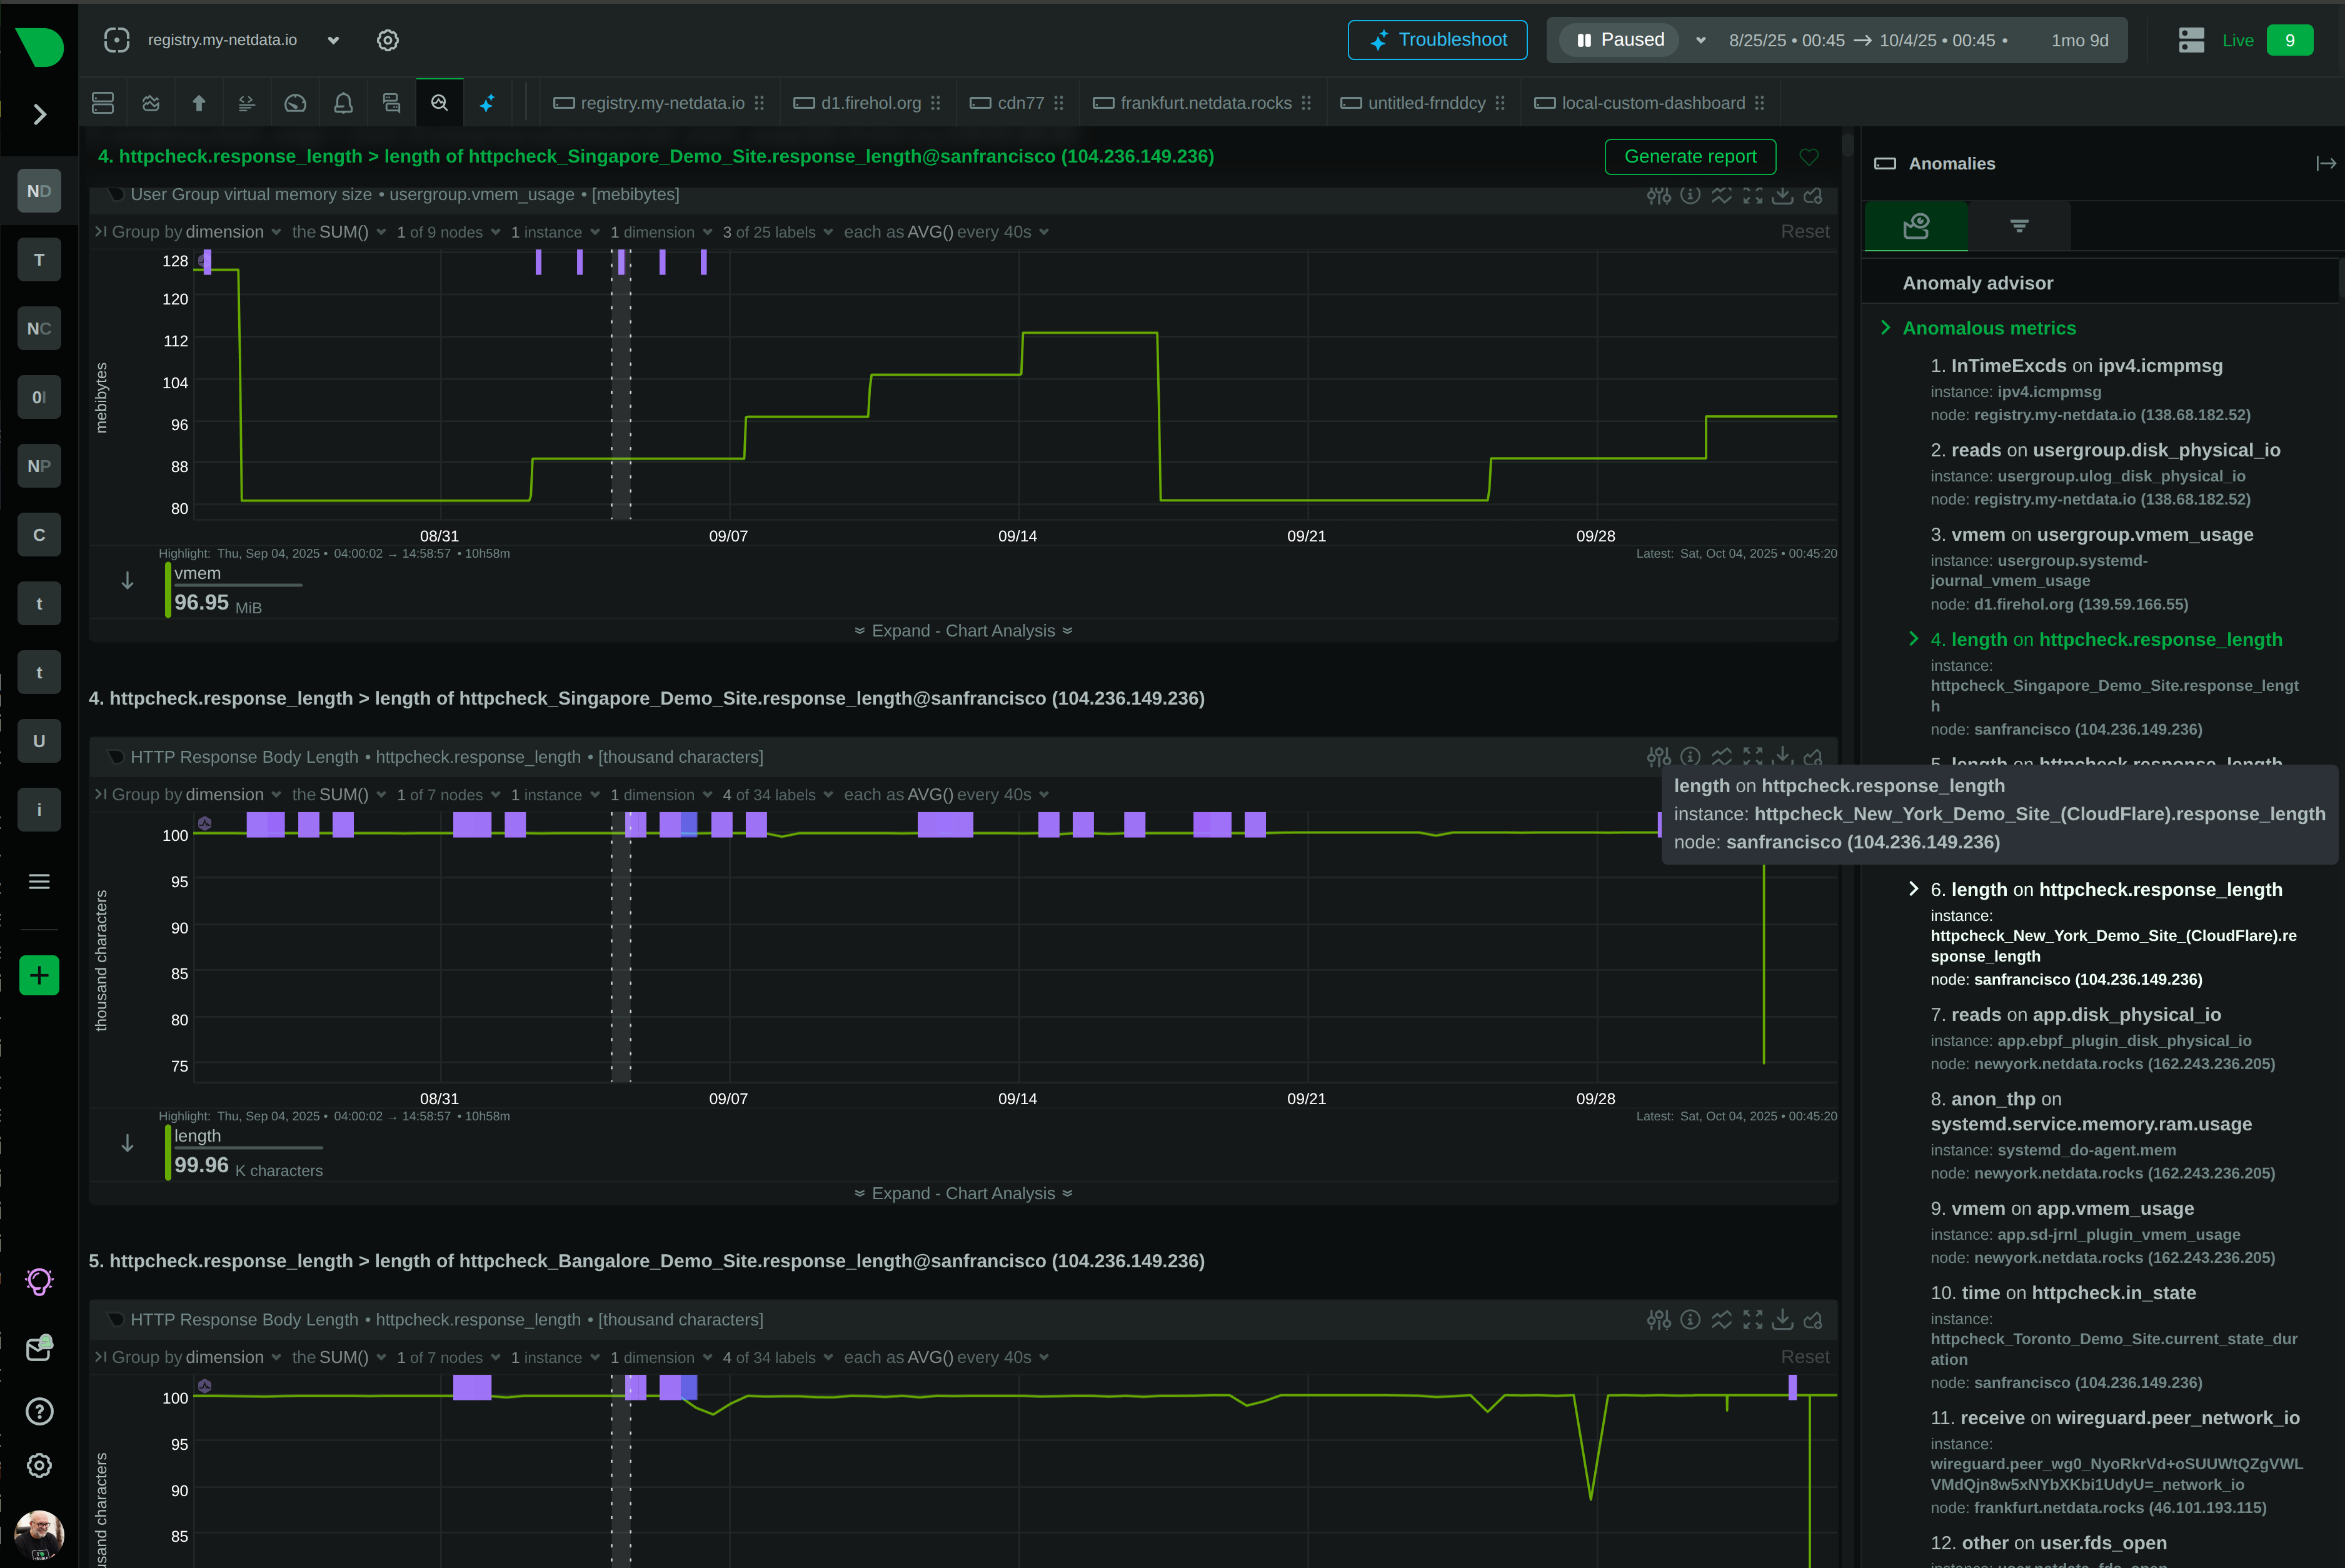
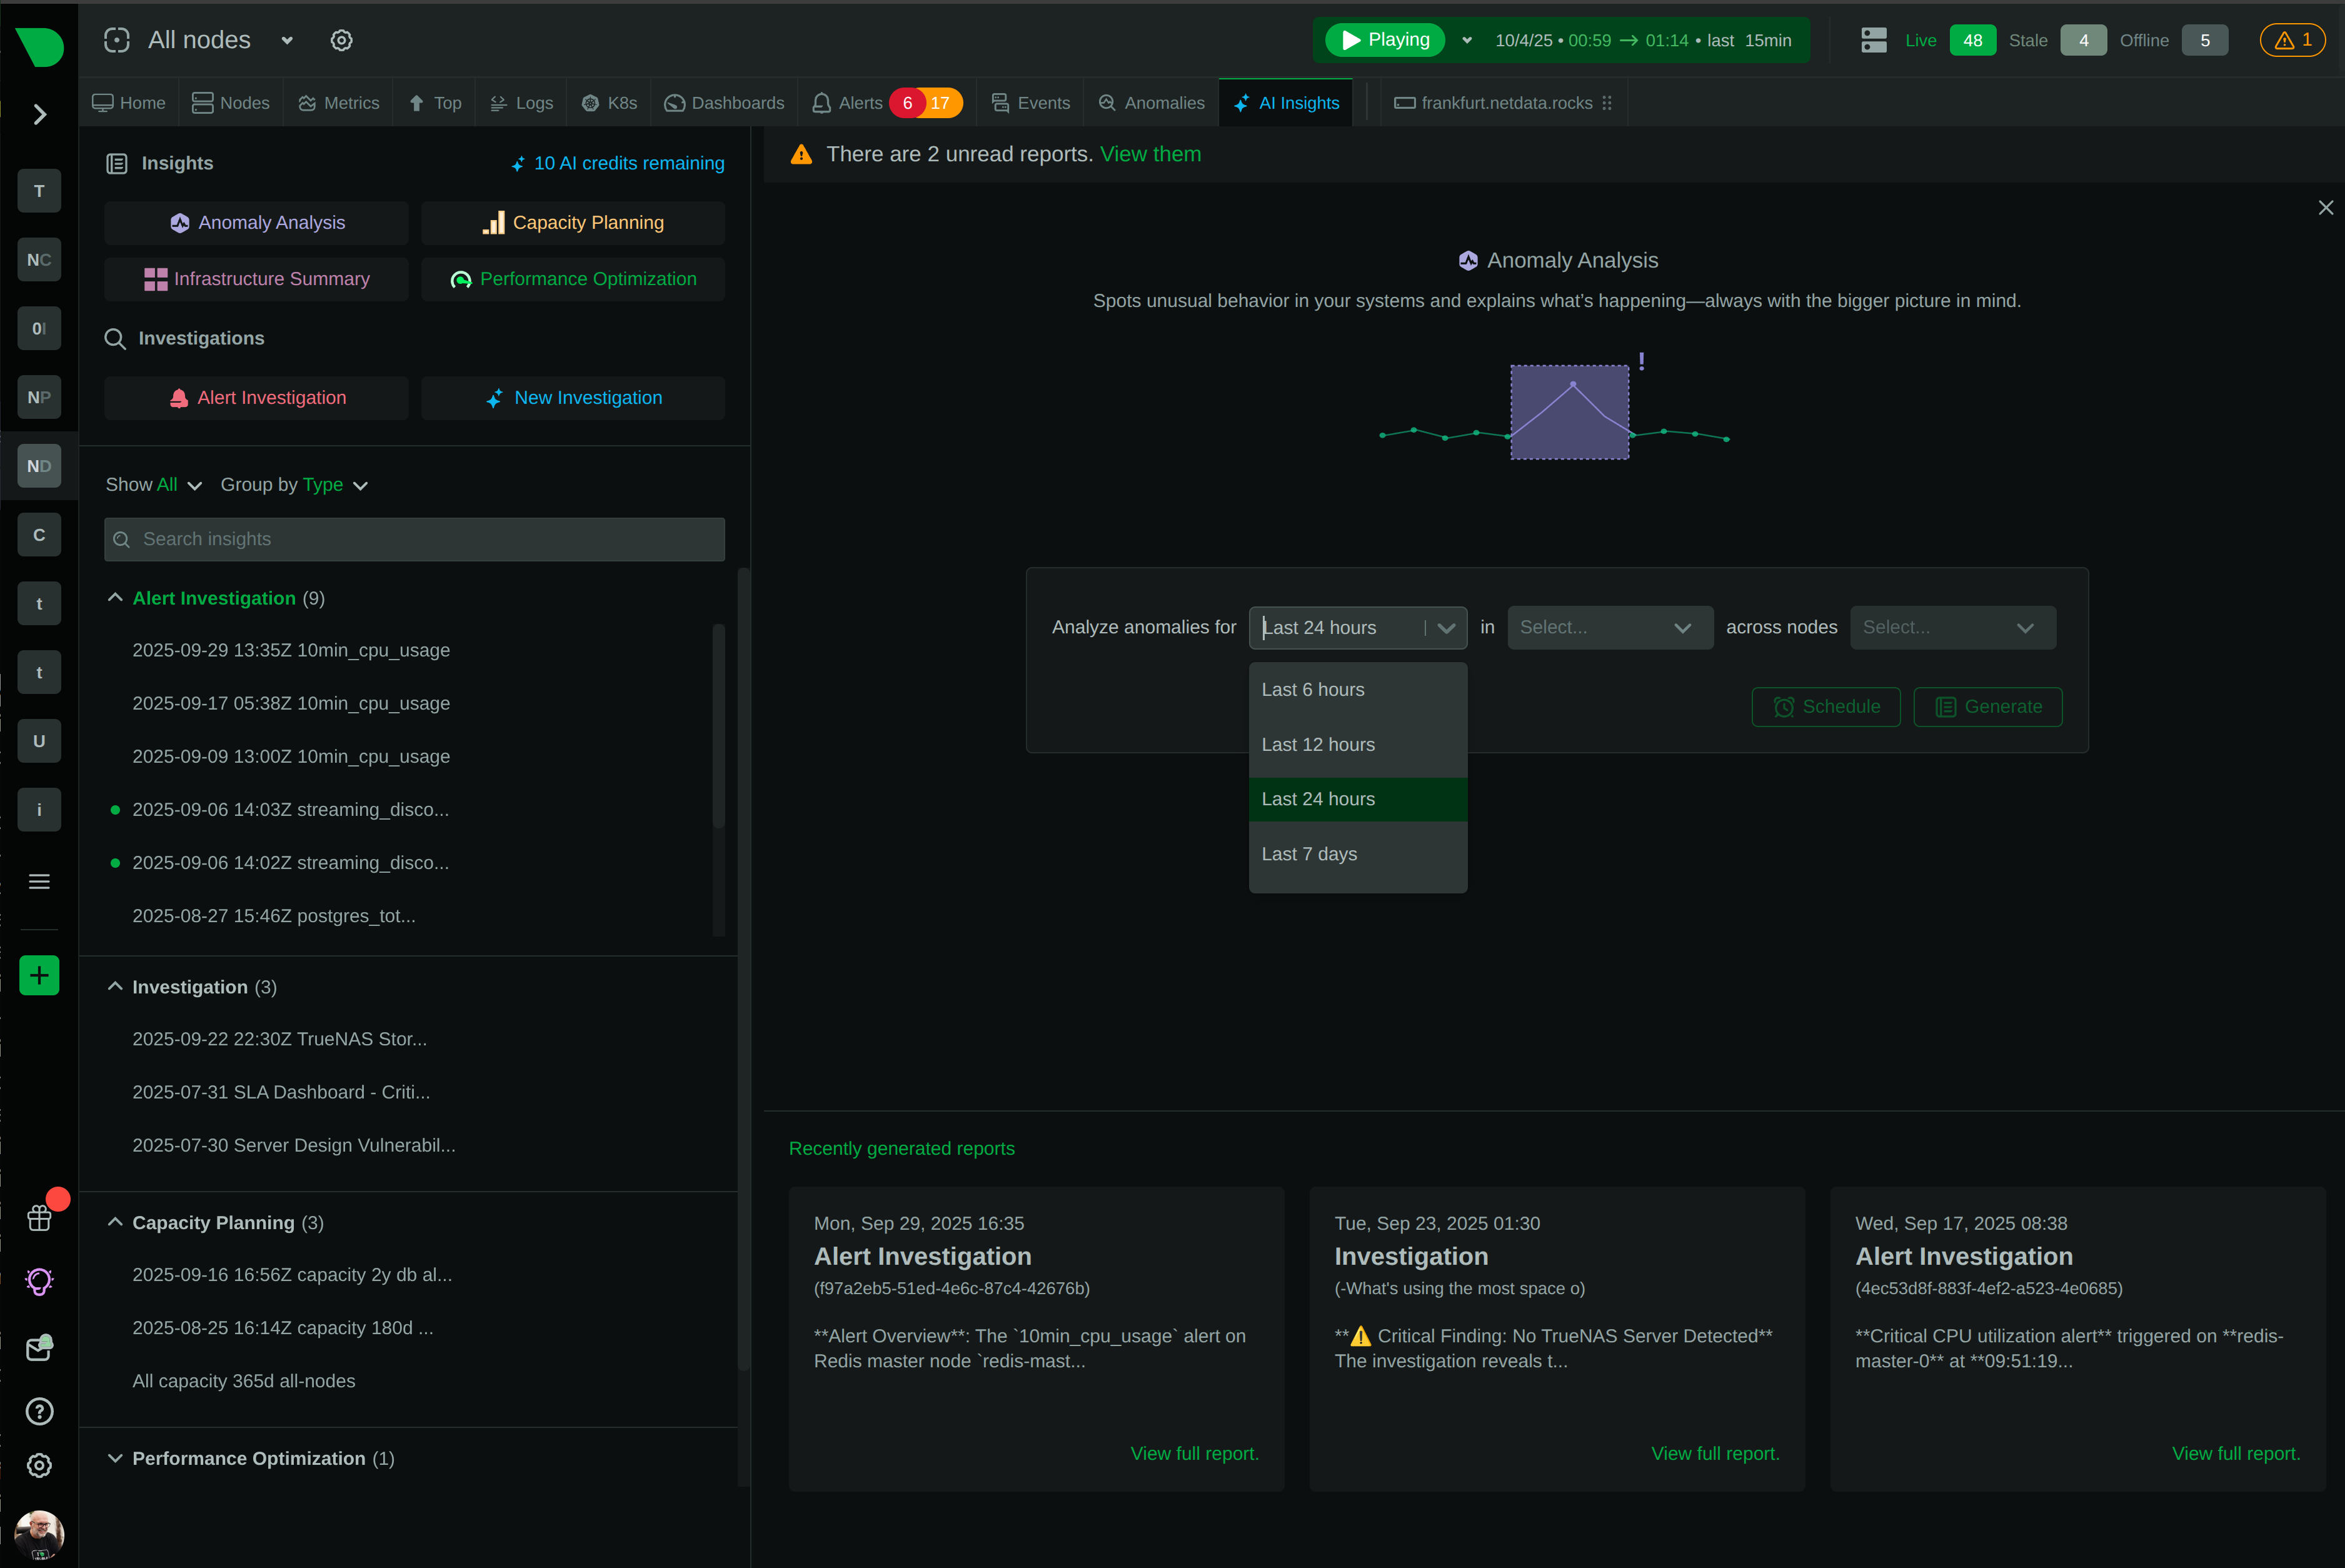
AI-powered Anomaly Advisor surfaces root cause in the top 30-50 metrics instantly. No manual correlation, no dashboard hunting - just answers in seconds, not hours.
90% Cost Reduction
Predictable per-node pricing with unlimited metrics, logs, and users. No volume charges, no surprise bills, no data egress fees. Costs scale linearly with your infrastructure.
Intelligent Alerting
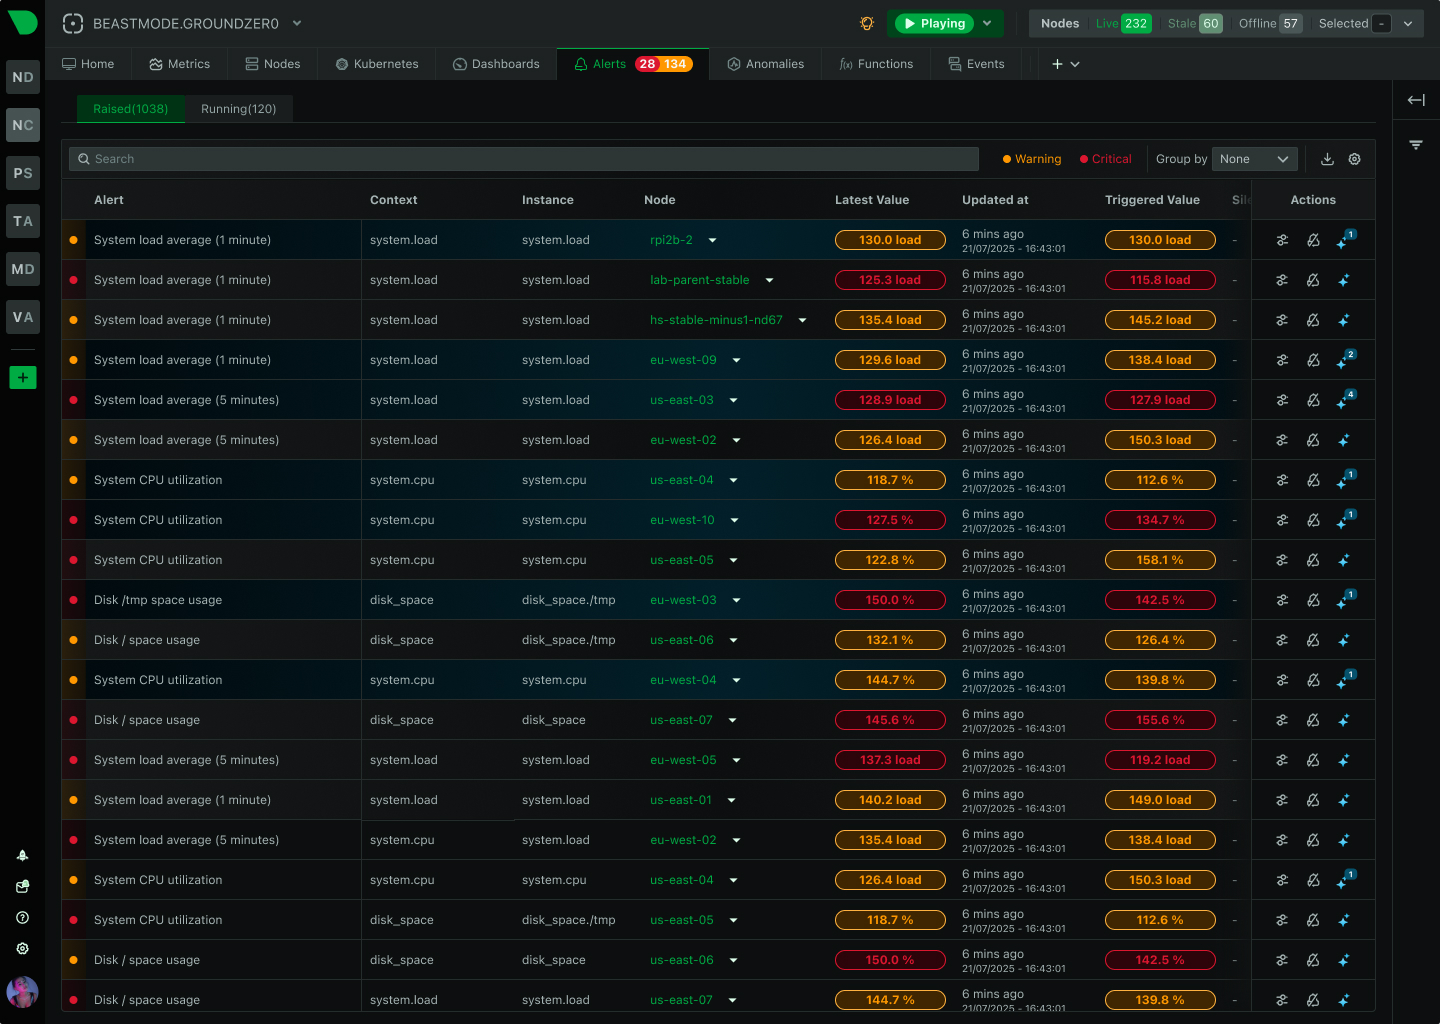
400+ pre-configured component-level alerts with dynamic thresholds, hysteresis, and delay logic. Alerts are accurate and actionable because they monitor specific components, not generic infrastructure.
60-Second Time to Value
One-line install, automatic discovery of 800+ integrations, algorithmic dashboards, and pre-configured alerts. From installation to production visibility in under a minute.
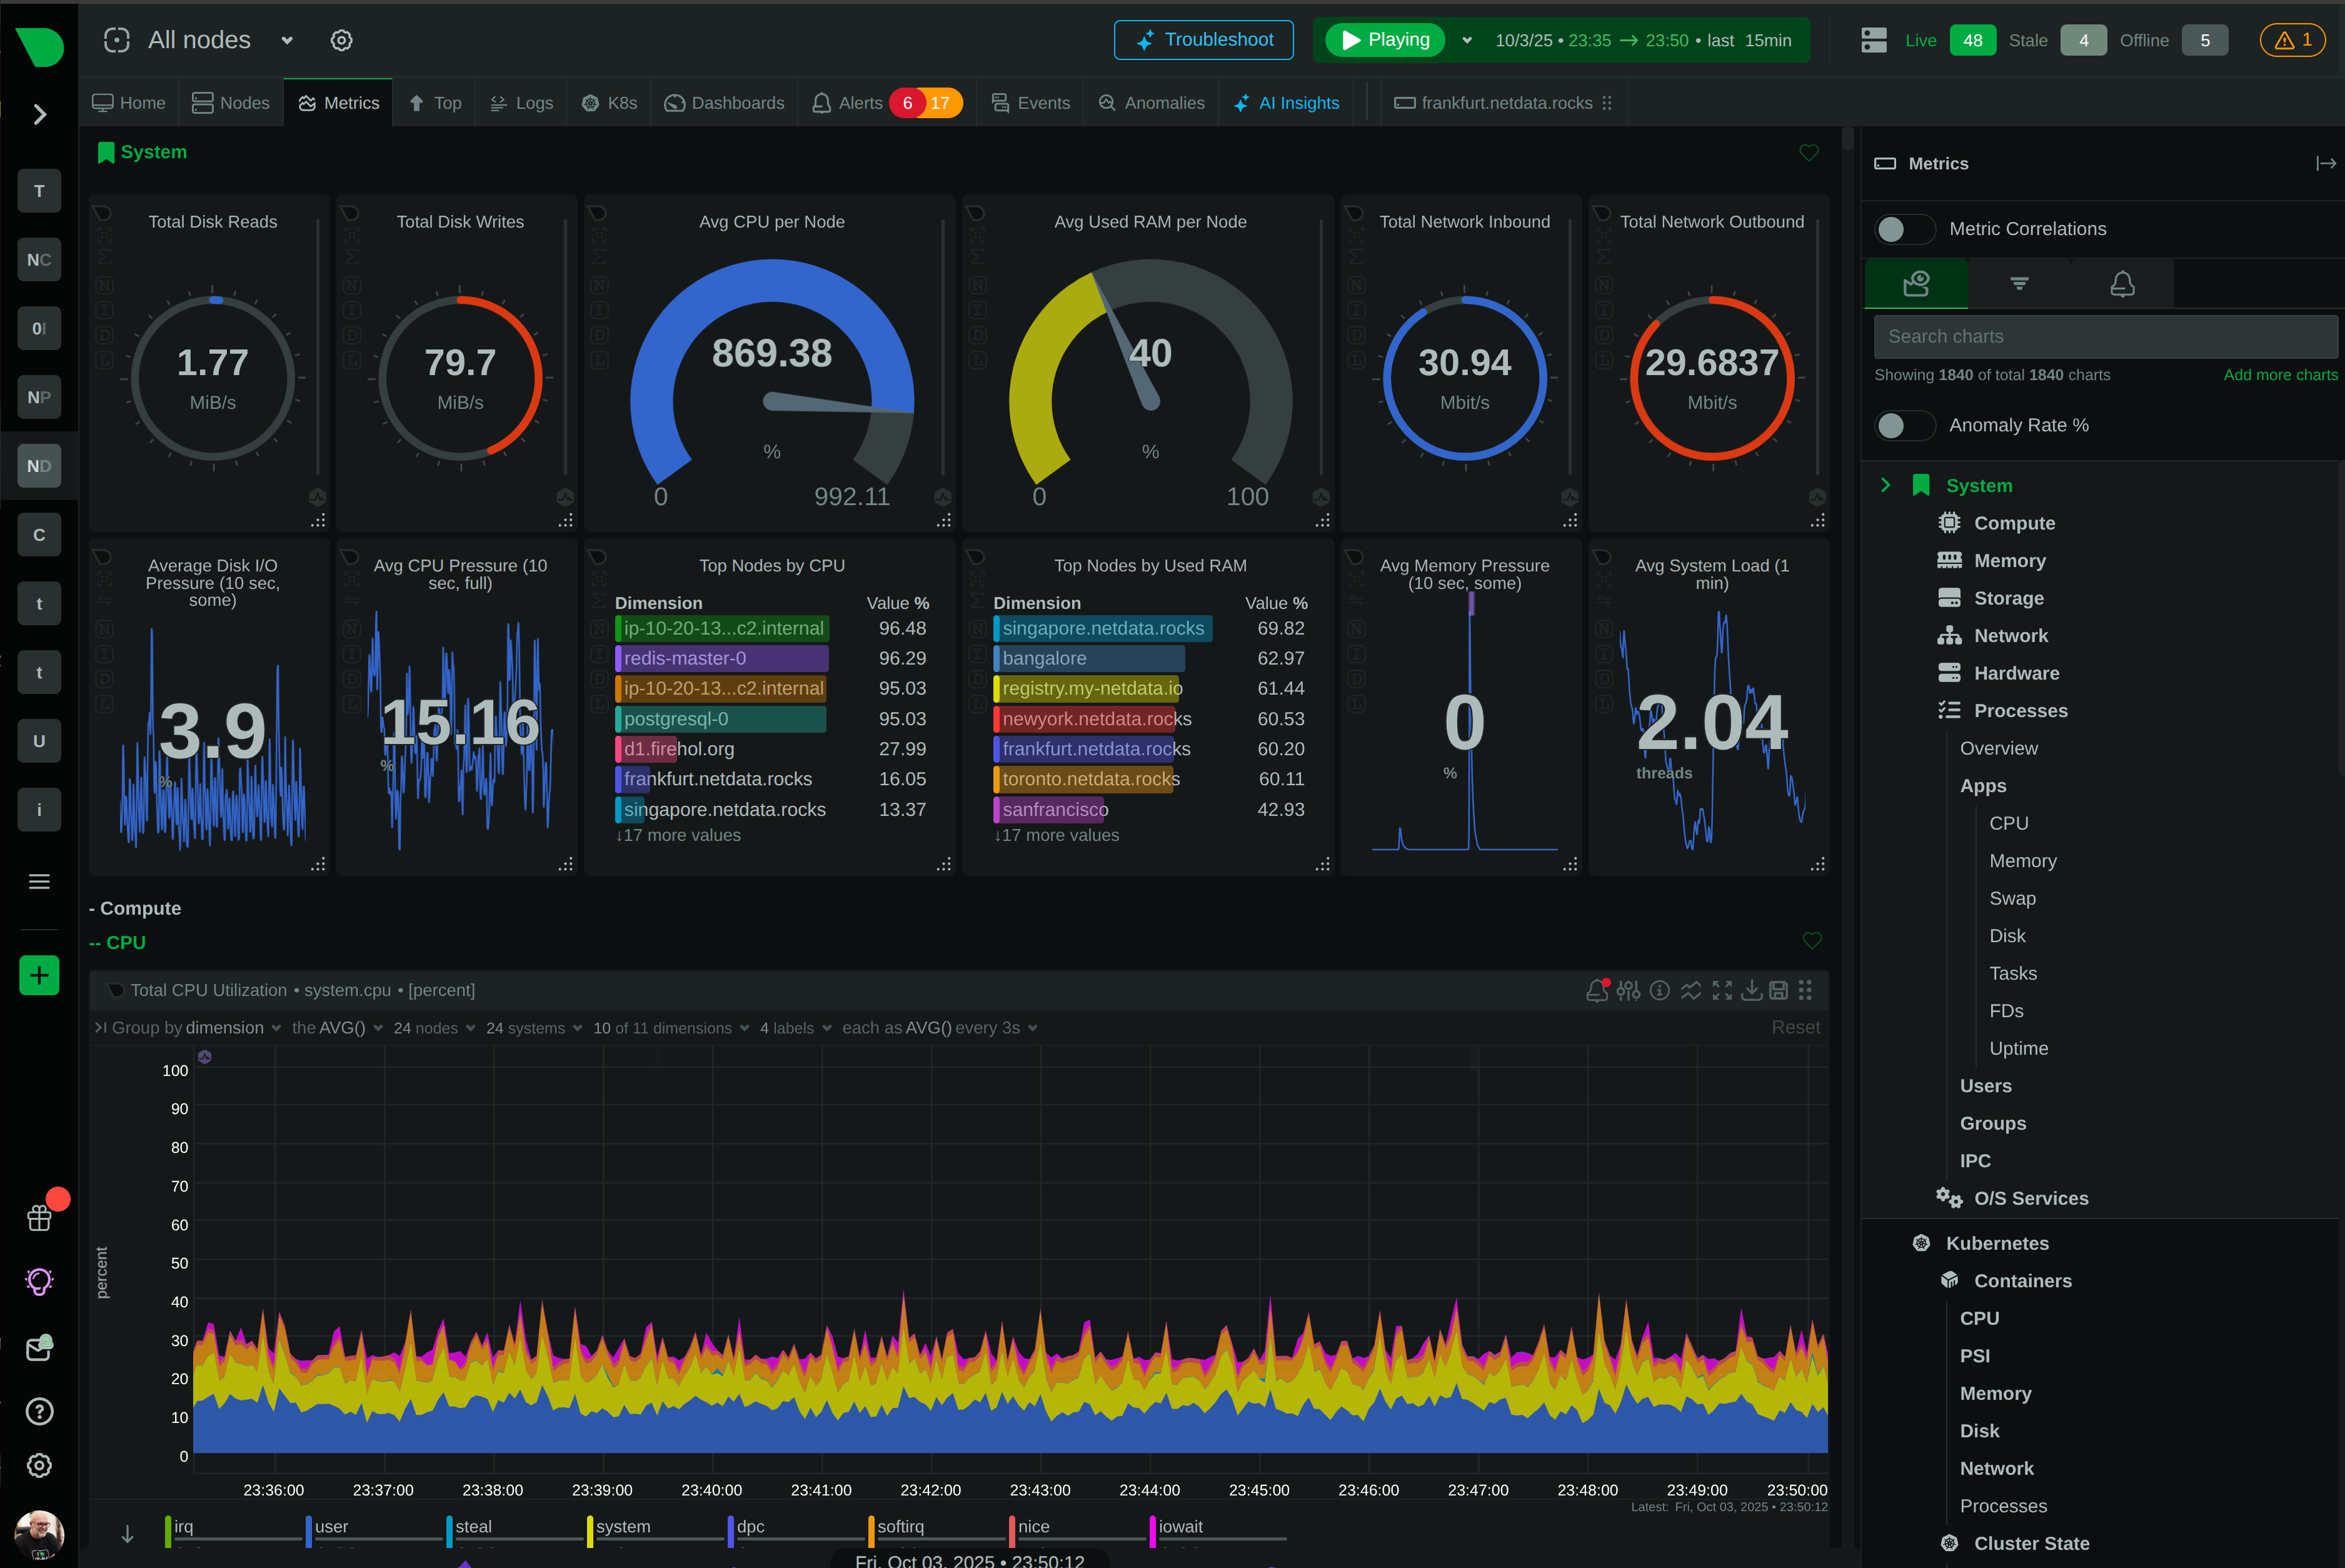
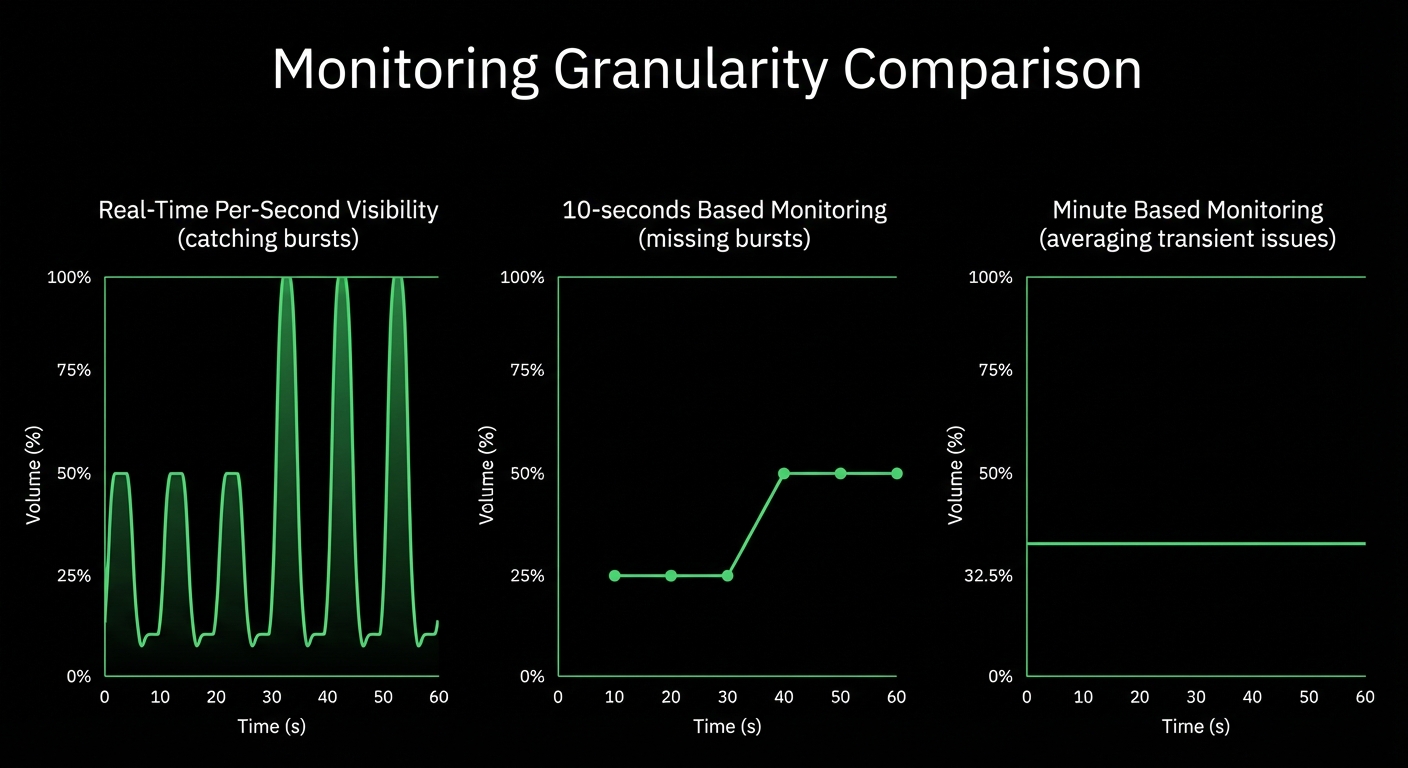
Per-Second Precision
True real-time monitoring with 1-second collection and sub-2-second total latency. Catch transient issues, microbursts, and cascading failures that 30-second monitoring completely misses.
Edge-Native Intelligence
Distribute the code, not the data. ML runs locally on every node, data stays on-premises, and costs scale linearly. No centralized bottlenecks, no vendor lock-in, complete data sovereignty.
Trusted by SRE teams worldwide


Transform Your SRE Operations
Actionable Component-Level Alerts
400+ pre-configured alerts
See Alert System
Slash Costs Without Sacrificing Visibility
Predictable per-node pricing
Calculate Your Savings
Troubleshoot at the Speed of Thought
Sub-2-second total latency
Experience Real-Time
Zero Configuration, Infinite Scalability
800+ auto-discovered integrations
See All Integrations

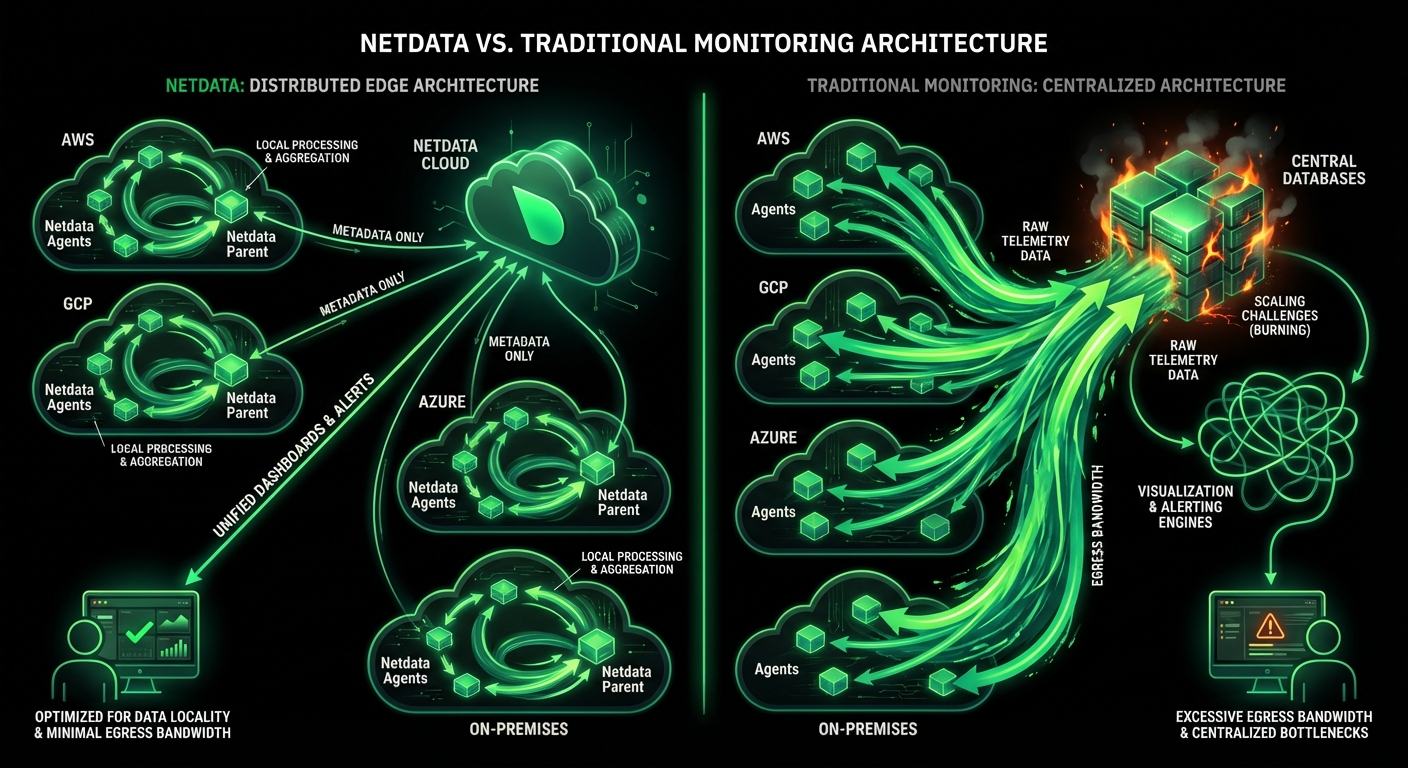
Netdata vs Traditional Monitoring
Built for Modern SRE Teams
See how Netdata’s edge-native architecture solves the pain points plaguing traditional observability platforms - without the complexity, cost explosions, or configuration burden.
Capability
Netdata
Traditional Monitoring
Data Granularity
✅ Per-Second
1-second collection, sub-2-second total latency
⚠️ Per-Minute or Worse
30-60 second intervals miss 90% of incidents
ML Anomaly Detection
✅ Every Metric
18 models per metric, consensus-based detection
⚠️ Limited Metrics
Manual configuration, cloud-based, sampling delays
Cost Model
✅ Predictable Per-Node
Unlimited metrics, logs, users - linear scaling
❌ Volume-Based
Per-metric, per-GB, per-user charges - exponential costs
Configuration Required
✅ Zero Setup
Auto-discovery, algorithmic dashboards, pre-configured alerts
❌ Extensive Manual Work
Weeks of dashboard building, threshold tuning, integration
Alert Design
✅ Advanced Component-Level
400+ pre-configured, dynamic thresholds, hysteresis
⚠️ Basic Threshold-Based
Static thresholds, manual configuration required
Data Architecture
✅ Edge-Native
Distributed intelligence, data sovereignty, linear scaling
❌ Centralized
Single bottleneck, vendor lock-in, exponential complexity
MTTR
✅ 5-15 Minutes
AI-powered RCA, Anomaly Advisor, instant context
⚠️ 1-4 Hours
Manual investigation, dashboard hunting, tool switching
Time to Value
✅ 60 Seconds
One-line install to production visibility
❌ 2-8 Weeks
Setup, configuration, dashboard building, tuning
Data Sovereignty
✅ Complete Control
All data on-premises, GDPR/HIPAA compliant by design
⚠️ Vendor-Controlled
Data in vendor cloud, compliance challenges, egress fees
Complete Observability for SRE Teams
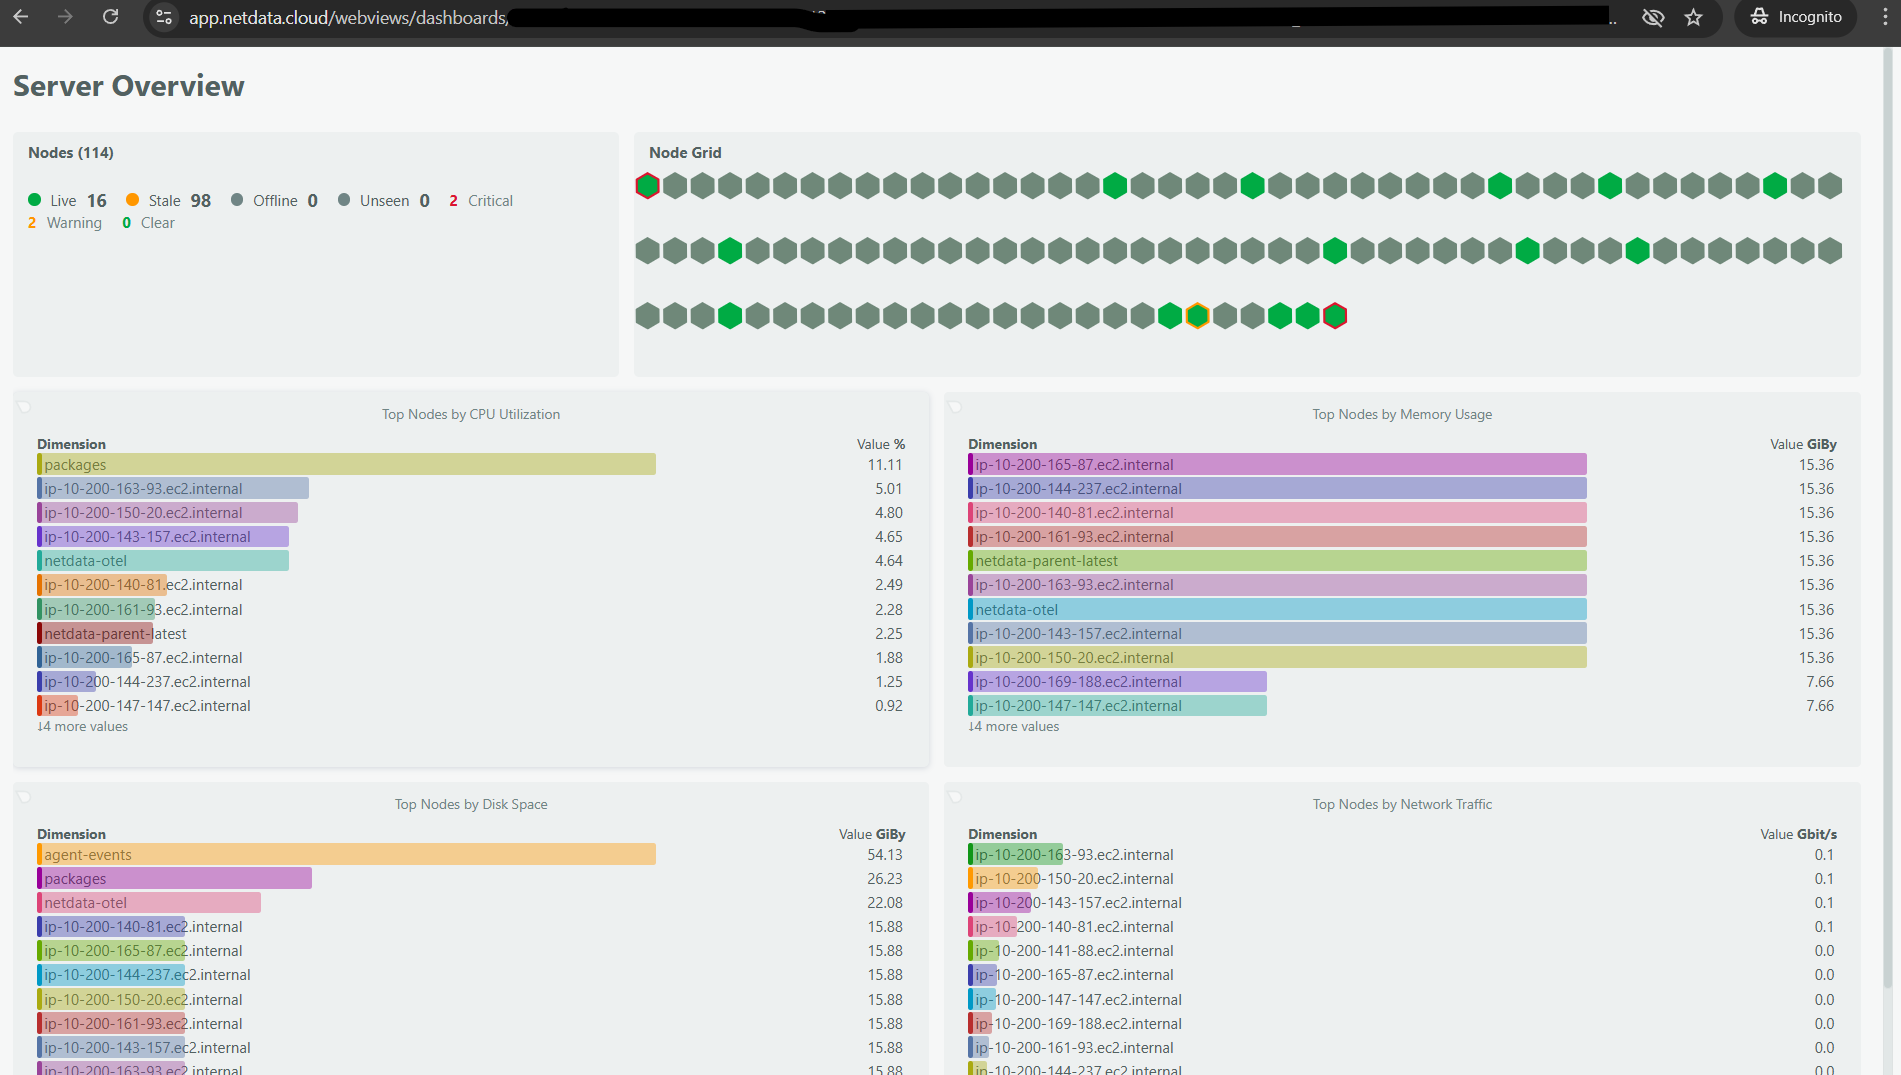
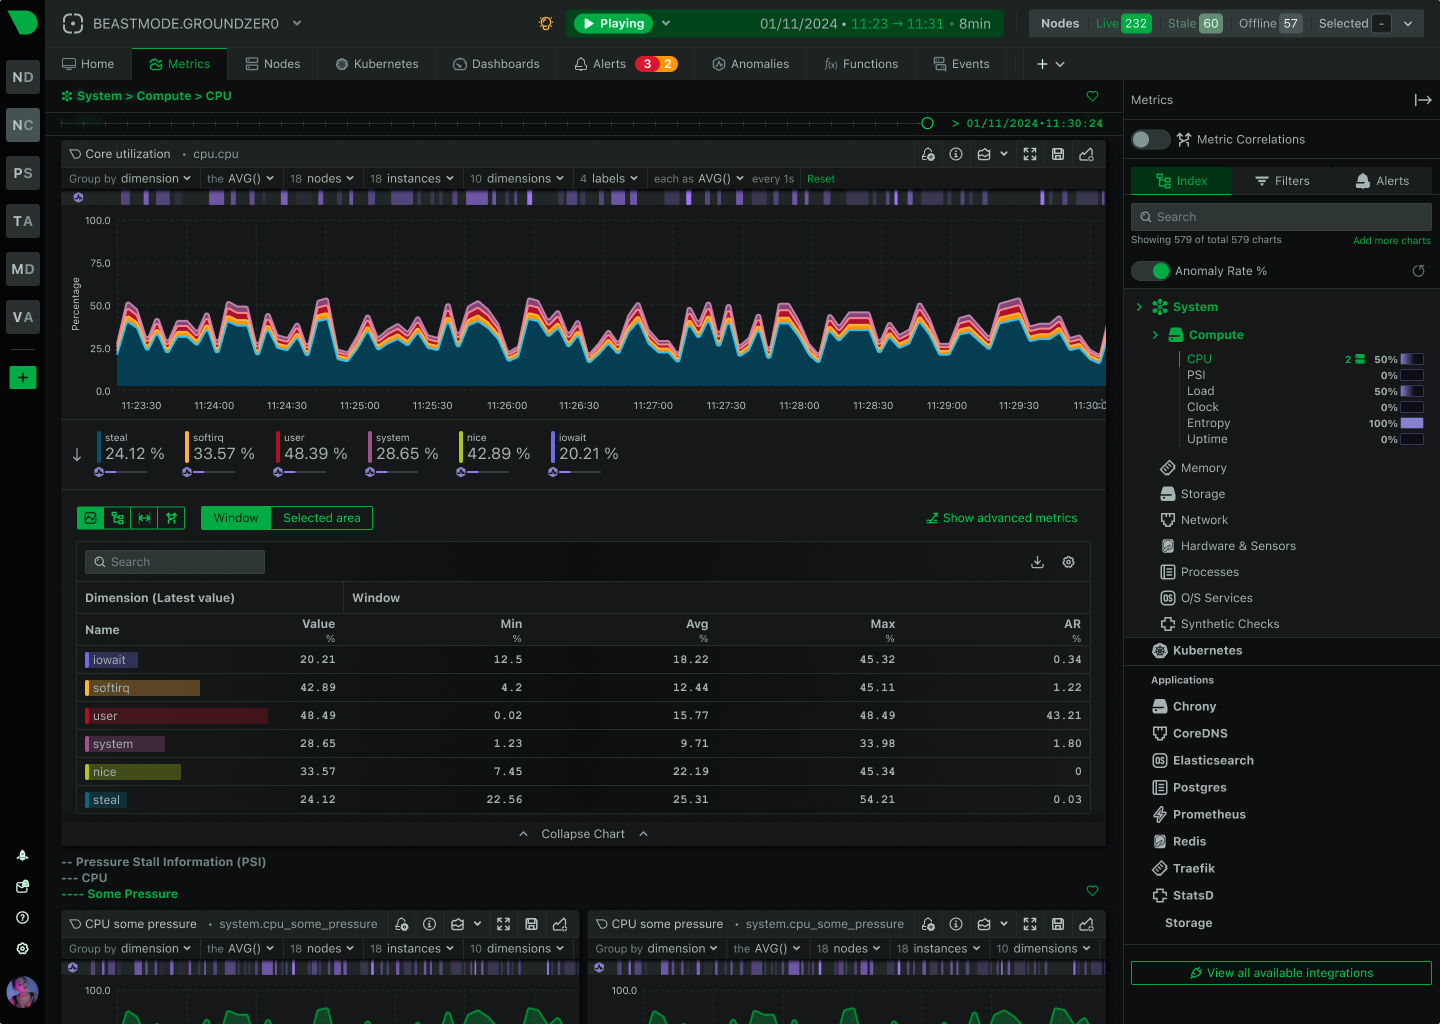
Per-Second Visibility Across Everything
Netdata collects 3,000-20,000 metrics per second per node with 1-second granularity and sub-2-second total latency. Auto-discover 800+ integrations covering systems, containers, applications, network devices, and cloud services - all with zero configuration.
Industry-leading 0.6 bytes/sample storage efficiency
Explore Metrics Management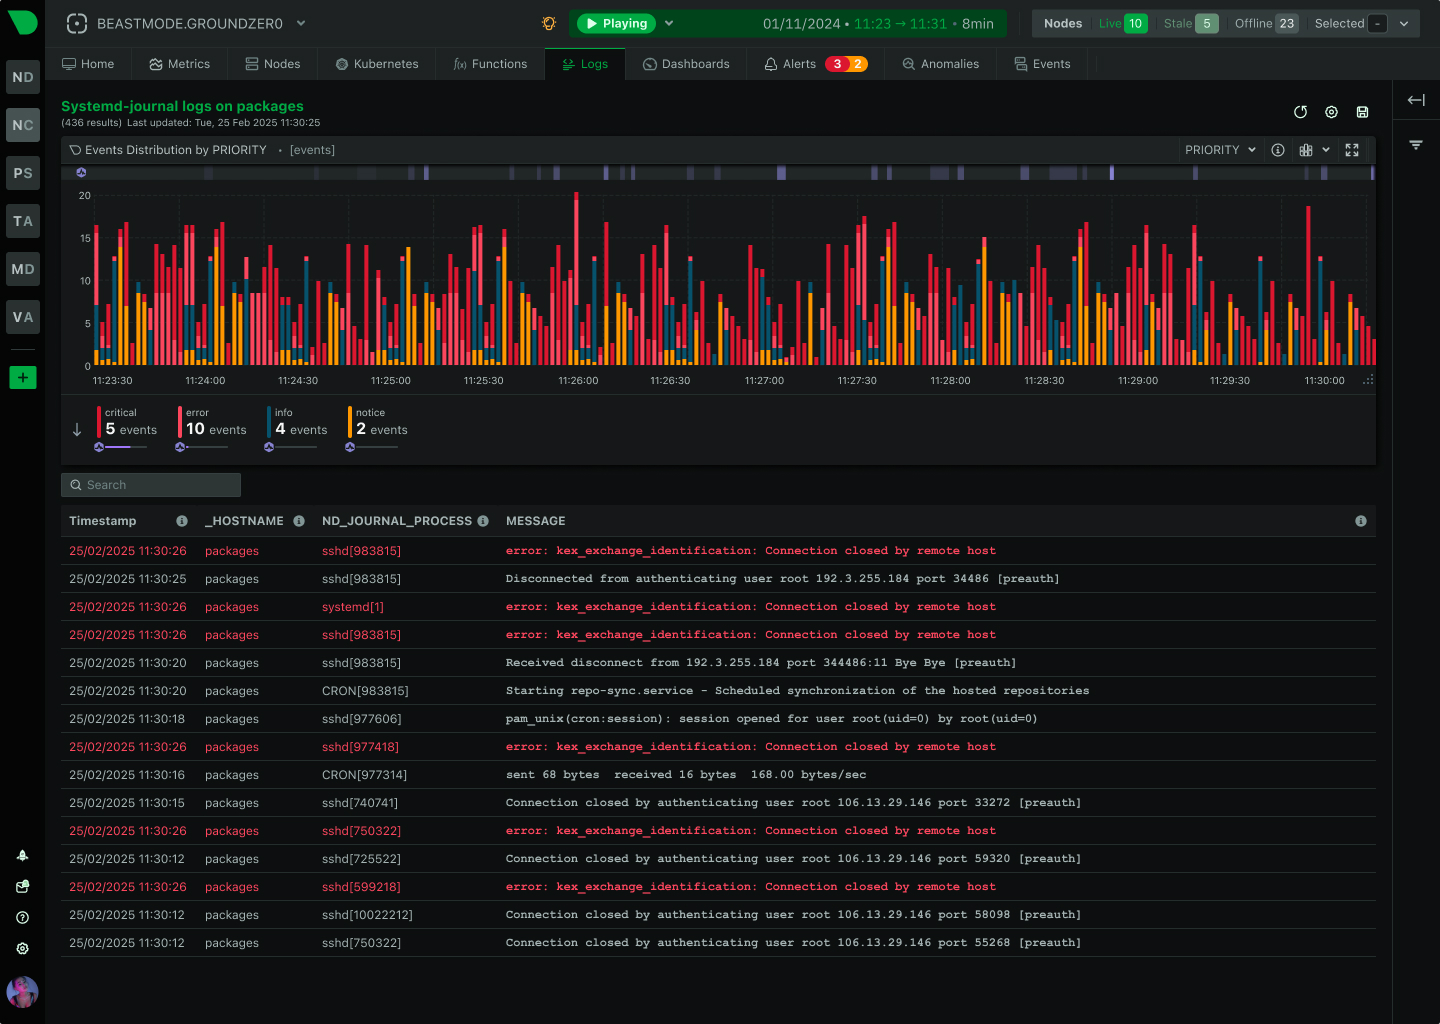
Built for Modern Infrastructure
Netdata adapts to your stack - from bare metal to Kubernetes, from on-premises to multi-cloud
Kubernetes & Containers
Auto-discover pods, containers, services, and nodes. Per-second metrics for every container with complete lifecycle tracking. Native cgroups v1/v2 support for Docker, containerd, Podman, and LXC.
Multi-Cloud Native
Monitor AWS, Azure, and GCP with automatic cloud service detection. Collect CloudWatch, Azure Monitor, and GCP metrics alongside infrastructure data. No data egress charges - everything stays on-premises.
Linux & Unix Systems
Comprehensive coverage for all Linux distributions, FreeBSD, and macOS. Direct kernel interface for CPU, memory, disk, network, and process metrics. SNMP auto-discovery for network devices and legacy systems.
Windows Monitoring
Native Windows agent with performance counters, Event Logs, ETW, and TraceLogging. Monitor Hyper-V, IIS, SQL Server, Active Directory, and all Windows services with zero configuration.
Network Performance
Per-second bandwidth, latency, packet loss, and connection tracking. SNMP device monitoring with auto-discovery. VPC flow logs analysis and service-to-service connectivity mapping.
Edge & IoT Devices
Lightweight footprint (<100MB RAM on 32-bit systems) ideal for edge computing and IoT. Parent-child architecture aggregates metrics from thousands of edge devices efficiently.

April 22, 2026
Nagios Plugins Collector: Run Your Existing Checks and Custom Scripts Inside Netdata
Netdata can now execute Nagios-compatible plugins and custom scripts in any language, tracking check states, execution metrics, and automatically charting performance data with built-in alerting.
April 20, 2026
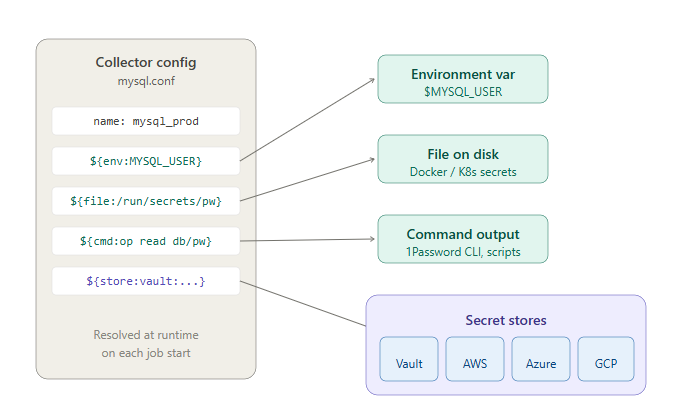
Secrets Management: Get Credentials Out of Your Netdata Configuration Files
Netdata now supports referencing secrets from environment variables, files, commands, and external secret stores like HashiCorp Vault, AWS Secrets Manager, Azure Key Vault, and GCP Secret Manager directly in collector configurations.
April 16, 2026
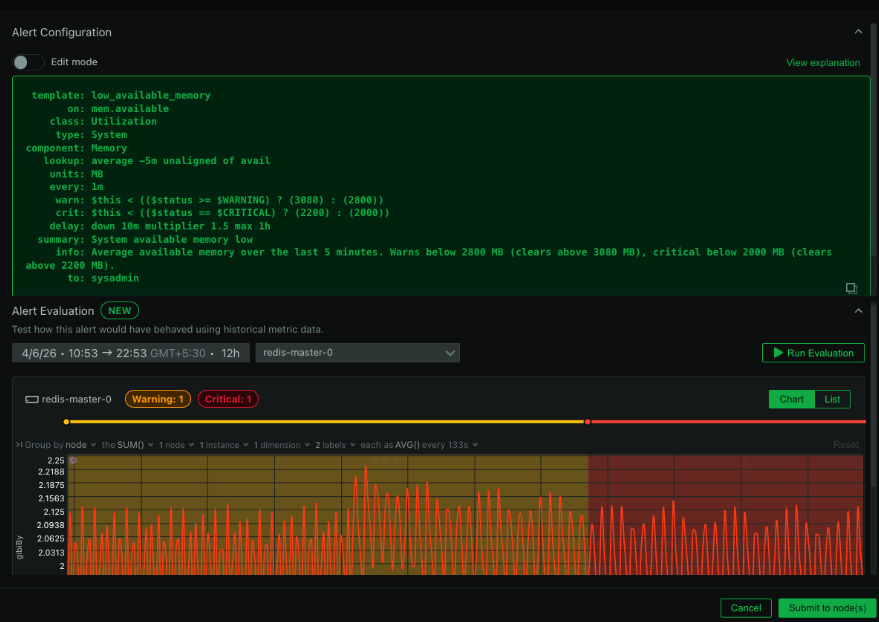
Smarter Alert Management: Test on Historical Data, Review Transitions, and Preview Silencing Schedules
Three new alerting capabilities in Netdata: evaluate alert definitions against historical metrics before deploying, review alert transition timelines, and preview recurring silencing schedules before saving.