









 EV Charging Network Monitoring
Per-Second Visibility Into Every Charger, Across Every Site
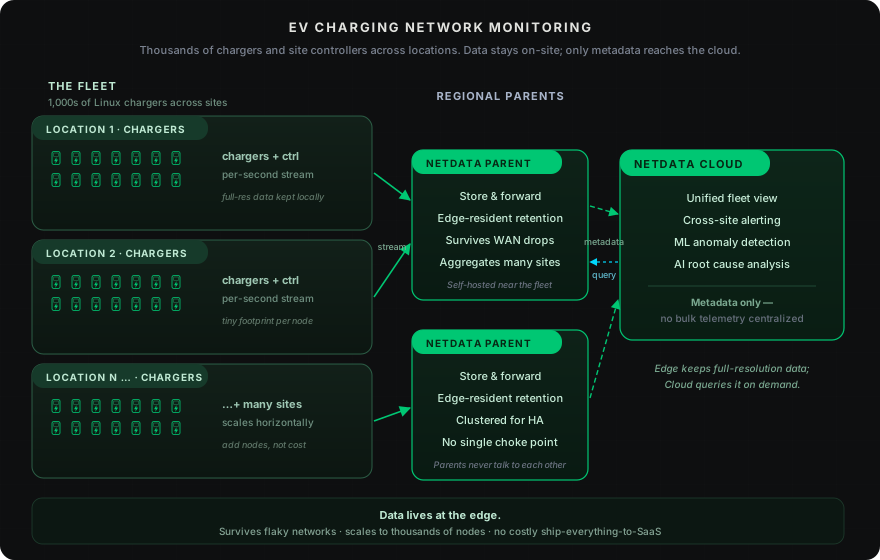
Thousands of Linux-based chargers and site controllers, each running a full Netdata Agent that collects, stores, and analyzes metrics locally. Availability problems are caught before they cost a charging session, and your network stays observable even when individual sites lose connectivity.

Built for Charger Fleets at Scale
Edge-native architecture that sees every controller, every second, without shipping telemetry to a distant cloud.
Per-Second Detection
CPU, memory, storage, network, and process metrics collected every second on each charger controller. Saturation and faults surface in real time, not minutes later.

Anomaly Detection on Every Charger
18 unsupervised ML models train locally per metric, establishing a per-charger baseline so abnormal behavior is flagged before the device goes offline.

Survives Flaky Site Connectivity
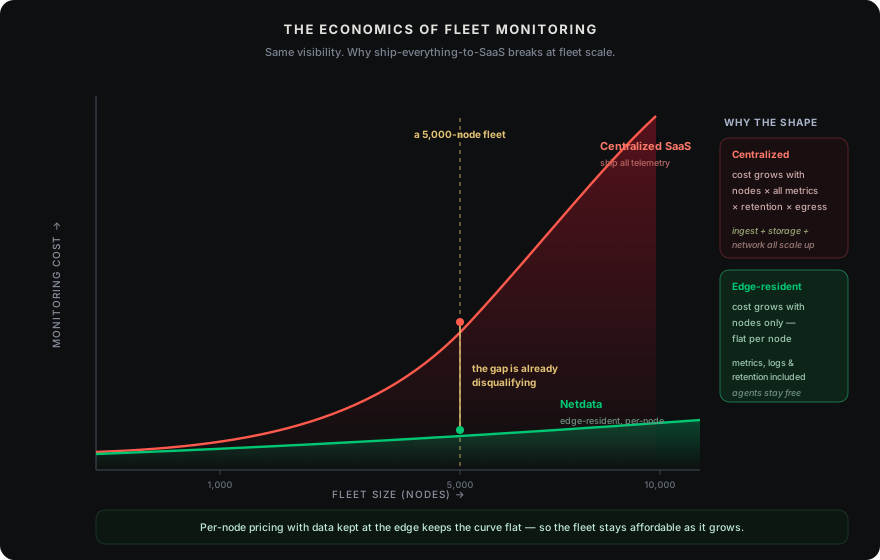
Agents buffer locally during network partitions and backfill Parents when links return. No blind spots during WAN drops or cellular outages.

Site and Region Rollups
Netdata Parents aggregate thousands of chargers by location and region, giving operators fleet-wide dashboards without centralizing all raw telemetry.

Unified Fleet Visibility
Netdata Cloud provides cross-site dashboards, distributed queries, and centralized alerting while keeping all metric data at the edge.

Console Access Without SSH
Built-in Functions surface processes, network connections, and systemd-journal logs directly in the dashboard, so operators troubleshoot chargers without remote shell access.
Trusted by operators managing distributed infrastructure worldwide







































Why Charge Point Operators Choose Netdata
Catch Controller Failures Before Sessions Drop
80% faster MTTR
Explore troubleshooting features
Predictable Economics at Fleet Scale
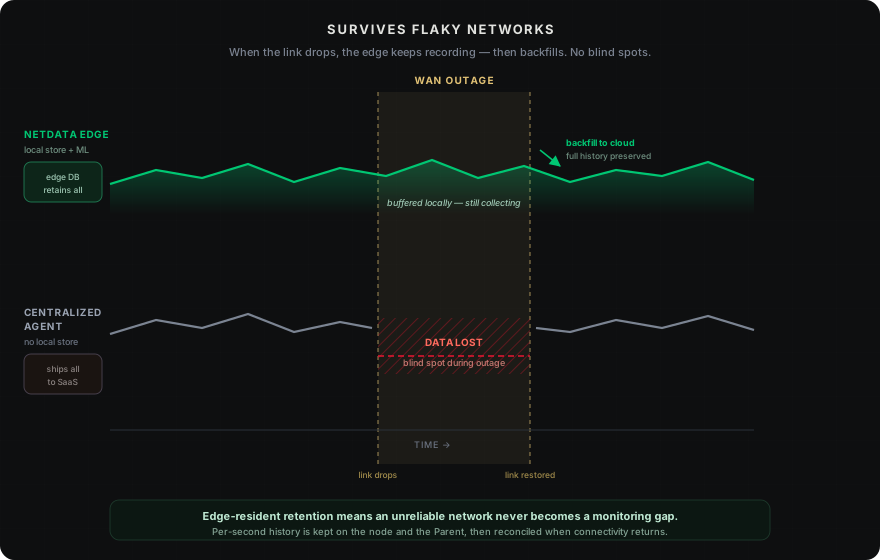
90% cost reduction vs traditional stacks
See how pricing works
Resilient Monitoring on Unreliable Networks
Store-and-forward by design
Learn about edge monitoring
Consolidate Tools Across the Entire Fleet
One platform replaces ~7 tools
Explore the platform

Deploy in Minutes, Operate for Years
From install to insight in under a minute
Read about zero configuration


Edge-native fleet monitoring vs. centralized SaaS
Architecture Designed for Distributed Chargers
Shipping every metric from thousands of remote endpoints to a central cloud is economically and technically the wrong model for EV charging networks. Netdata keeps data at the edge and distributes intelligence to each controller.
Capability
Netdata
Centralized SaaS / Traditional Tools
Data Location
Where telemetry is stored and processed
✅ Edge-Resident
Metrics stored on each charger or site Parent
⚠️ Centralized Cloud
All telemetry shipped to remote backend
Network Resilience
Behavior during site connectivity loss
✅ Store-and-Forward
Local buffering with automatic backfill
❌ Data Loss Risk
Blind spots during WAN or cellular outages
Metric Granularity
Resolution of collected data
✅ Per-Second (1s)
Every metric, every second, no sampling
⚠️ 10-60s Intervals
Coarse averages hide transient faults
Anomaly Detection
ML applied to per-charger baselines
✅ Edge-Based ML
18 models per metric, trained locally
⚠️ Optional / Cloud-Based
Selected metrics, central processing required
Cost Model
How pricing scales with fleet growth
✅ Per-Node Pricing
Predictable, agents free and open source
❌ Volume-Based
Costs explode with per-second data at scale
Setup Complexity
Effort to reach first useful dashboard
✅ Zero Configuration
Auto-discovery, automated dashboards
⚠️ Manual Configuration
Dashboards and collectors built by hand
Log Management
Access to charger controller logs
✅ Advanced
OS logs in place + any source via OpenTelemetry
❌ Separate Pipeline
Shipping, indexing, and storage infrastructure
Remote Troubleshooting
Investigating a charger without SSH
✅ Built-in Functions
Processes, connections, units in browser
⚠️ Requires SSH or Agent
Separate remote access tools needed
Scalability
Performance as charger count grows
✅ Linear Scaling
Adding nodes adds no central bottleneck
⚠️ Central Bottlenecks
Query and ingestion load concentrates
What Netdata Shows You on Every Charger
OS-Level Metrics
CPU saturation, memory pressure, disk exhaustion, and network interface errors collected per second on every charger controller. Detect resource contention before it crashes the charging-management process.
Per-second OS visibility on every device
Learn about infrastructure monitoring


Frequently Asked Questions

September 8, 2026
Infrastructure Knowledge For AI Root Cause Analysis
Netdata AI now learns your infrastructure the way a new SRE would: a shared context document your team writes, and a memory layer built from conversations that gets more accurate every time you use it.

June 28, 2026
Fleet Observability: Linux Edge Device Monitoring
Learn how edge-resident fleet observability monitors thousands of Linux devices behind NAT, on cellular, and through outages. Read the full guide now!

June 23, 2026
5 Best SolarWinds Alternatives for 2026
Discover the 5 best SolarWinds alternatives for 2026, built for the cloud-native, dynamic infrastructure legacy tools can't handle. Read the guide now!