









 Continuous Operations
24/7 Visibility That Never Sleeps
When every second of uptime matters, you need observability that operates at the speed of your infrastructure. Netdata delivers per-second metrics with sub-2-second detection, giving operations teams the real-time visibility required to maintain always-on services.


Built for Always-On Operations
The observability platform designed for teams that cannot afford blind spots

Sub-2-Second Detection
Per-second collection with 1-second visualization latency. See issues as they happen, not minutes later.

80% Faster Resolution
AI-powered root cause analysis and ML anomaly detection cut troubleshooting time dramatically.
90% Lower Costs
Edge-native architecture eliminates egress fees, with no charges for metrics volume.

400+ Pre-Built Alerts
Component-level alerts provide actionable, precise monitoring. Ships ready to use with 800+ integrations.
AI Troubleshooting
Anomaly Advisor surfaces root cause in top 30-50 metrics. Ask AI explains any alert instantly.
Zero Configuration
Auto-discovery of 800+ integrations. Dashboards generate algorithmically. Productive in 60 seconds.
Trusted by operations teams running 24/7 infrastructure







































Real-Time Intelligence for Continuous Operations
Catch Issues Before They Cascade
10-60× more granular than standard solutions
Explore real-time monitoring

Resolve Incidents in Minutes, Not Hours
80% MTTR reduction
Learn about AI troubleshooting

Keep Costs Predictable as You Scale
0.6 bytes per metric sample
See cost efficiency

Give Every Shift Equal Visibility
Zero learning curve
See visualization features


Feature Comparison
Continuous Operations Capabilities
How Netdata compares to traditional monitoring for 24/7 operations
Capability
Netdata
Traditional Monitoring
Data Granularity
✅ Per-second
Catches 2-10 second anomalies that matter
⚠️ Per-minute
Averages hide critical transient issues
Detection Latency
✅ Sub-2 seconds
Collection to visualization in 1 second
⚠️ 30-90 seconds
Pipeline delays add significant latency
Anomaly Detection
✅ 18 ML models per metric
Automatic baselines, consensus-based detection
⚠️ Manual thresholds
Requires expertise, constant tuning
Root Cause Analysis
✅ AI-powered
Anomaly Advisor ranks causes automatically
⚠️ Manual investigation
Context switching across multiple tools
Configuration Needed
✅ Zero to minimal
Auto-discovery, algorithmic dashboards
❌ Extensive
Weeks of dashboard and alert setup
Cost Model
✅ Per-node pricing
No charges for metrics volume or Logs Monitoring (querying logs in place)
❌ Volume-based
Bills grow 3-10× faster than infrastructure
Continuous Operations Capabilities
Per-Second Visibility
True real-time monitoring with 1-second collection and sub-2-second total latency. Gaps in charts reveal system stress - if Netdata can't collect, your applications are struggling.
10-60× more granular than standard monitoring
Learn more


Why Operations Teams Choose Netdata
Key advantages for continuous operations environments
True Real-Time Monitoring
Per-second data collection with sub-2-second latency reveals issues that minute-averaged tools miss entirely.

AI Root Cause Analysis
Anomaly Advisor automatically ranks metrics by severity. Root cause typically appears in top 30-50 results.

Predictable Costs
Predictable per-node pricing for infrastructure monitoring, with no charges for metrics volume, Logs Monitoring (querying logs in place), users, data retention or containers. No volume surprises from cardinality explosions.

Instant Productivity
Zero configuration with auto-discovery. Algorithmic dashboards adapt automatically to your infrastructure.

Skill-Independent Quality
Junior and senior engineers get identical visibility. No query languages or dashboard building required.

Data Sovereignty
All observability data stays on your infrastructure. SOC 2 Type 2 certified with GDPR/HIPAA alignment.

August 17, 2026
Chart Annotations For Deploys, Incidents & Changes
Netdata Cloud now lets you pin notes to a specific moment on a chart — deployments, incidents, config changes, maintenance windows — shared across your whole Space and one click away from a root-cause correlation.
April 10, 2026
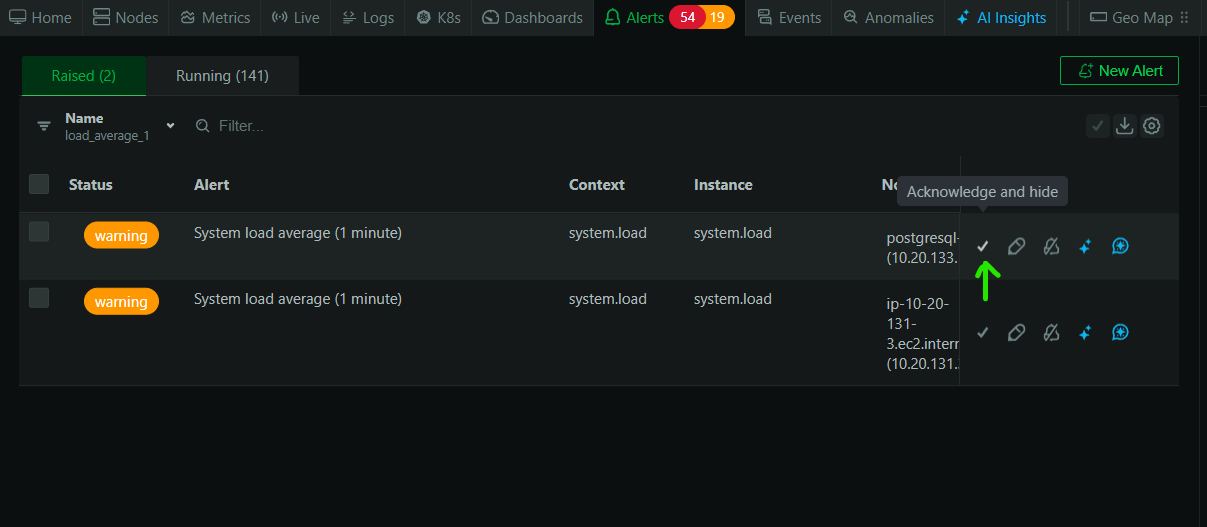
Alert Acknowledgement: Mark It as Seen, Keep Working
Acknowledge Netdata alerts individually or in bulk to clear the noise and focus on what needs attention. They return if the state changes. Try it now!

February 3, 2026
Howard Conference & Expo 2026: Smarter Observability
Meet Netdata at the Howard Conference & Expo 2026 in Fairhope to see how real-time observability beats traditional monitoring. Book a meeting now!