







 Windows Event Log Monitoring & Observability
See Every Signal, Miss Nothing Critical
Traditional Windows Event Log monitoring drowns teams in noise while missing real issues. Netdata transforms event monitoring with per-second infrastructure metrics, ML-based anomaly detection, and AI-powered troubleshooting - delivering comprehensive visibility at 90% lower cost than traditional platforms.


Why Teams Choose Netdata for Windows Event Logs
Six breakthrough capabilities that transform Windows monitoring

Per-Second Visibility
Catch transient issues invisible to 30-second monitoring. See what’s happening now, not what happened minutes ago.
ML Anomaly Detection
18 models per metric detect anomalies automatically. 99% false positive reduction through consensus-based detection.
90% Cost Reduction
Predictable per-node pricing eliminates surprise bills. Monitor everything with no charges for metrics volume or Logs Monitoring (querying logs in place).
60-Second Deployment
From installation to full dashboard in one minute. Zero configuration, automatic discovery, instant insights.

Unified Observability
Windows metrics plus Event Logs in one interface. Correlate infrastructure behavior with log events instantly.
AI Troubleshooting
Ask AI explains issues in plain language. 80% MTTR reduction through automated root cause analysis.
Trusted by operations teams worldwide








































Transform Windows Event Log Monitoring
Detect Issues Before They Escalate
80% MTTR reduction
See Real-Time Detection


Precision Anomaly Detection
99% anomaly false positive reduction
Learn About ML Detection


Slash Costs Without Sacrificing Visibility
90% cost reduction
See Pricing Details


Troubleshoot with AI-Powered Insights
2-3 minute reports
Explore AI Features


Deploy in 60 Seconds, Not Weeks
60 seconds to dashboard
View Installation Guide

Unify Windows and Linux Monitoring
800+ integrations
See All Integrations


Netdata vs Traditional Windows Event Log Monitoring
Why Netdata Transforms Windows Observability
Traditional SIEM platforms charge per GB or per event, forcing teams to reduce visibility to control costs. Netdata’s edge-native architecture and per-node pricing deliver comprehensive monitoring at a fraction of the cost - without sacrificing features or performance.
Capability
Netdata
Traditional SIEM
Data Granularity
✅ Per-Second
Catch transient issues others miss
⚠️ 10-60 Seconds
Averages hide critical patterns
Anomaly Detection
✅ 18 ML Models
99% false positive reduction
⚠️ Manual Thresholds
Requires continuous tuning
Deployment Time
✅ 60 Seconds
Zero configuration required
❌ 6-12 Months
Complex setup and tuning
Pricing Model
✅ Predictable Per-Node
Logs Monitoring (querying logs in place) not billed
❌ Per GB or EPS
Unpredictable, surprise bills
Query Language
✅ Point-and-Click
No PromQL or SPL required
❌ Complex Syntax
Requires specialized training
AI Troubleshooting
✅ Built-In
Ask AI on every alert
⚠️ Add-On Feature
Premium tier or separate product
Data Sovereignty
✅ Edge Storage
Logs stay on Windows servers
❌ Centralized
Data duplication and egress costs
Scalability
✅ Linear
Add nodes without affecting existing
❌ Exponential Complexity
Central bottlenecks at scale
Alert Targeting
✅ Component-Level
Specific service alerts
❌ Generic Thresholds
High volume of generic alerts
Storage Efficiency
✅ 0.6 Bytes/Sample
Years of data in gigabytes
⚠️ 2-16 Bytes/Sample
Terabytes for same retention
Netdata's Windows Event Log Capabilities
Direct Windows Event Log Access
Query Windows Event Logs via native API - no forwarding, no duplication, no WEF/WEC complexity. All system fields indexed automatically. Full-text search across all events. Histogram visualization for pattern detection.
Zero pipeline overhead
Learn More


Key Benefits for Windows Operations Teams
Six transformative advantages that make Netdata the ideal Windows Event Log monitoring solution

Real-Time Visibility
Per-second metrics reveal transient issues invisible to 30-second monitoring. See what’s happening now, not what happened minutes ago.

Intelligent Detection
ML-based anomaly detection on every metric. 99% false positive reduction through consensus-based approach requiring unanimous agreement.

Predictable Costs
Predictable per-node pricing for infrastructure monitoring, with no charges for metrics volume, Logs Monitoring (querying logs in place), users, data retention or containers. No surprise bills.

Instant Deployment
60 seconds from installation to full dashboard. Zero configuration, automatic discovery, immediate insights.
AI Troubleshooting
Ask AI explains issues in plain language. Automated reports in 2-3 minutes. 80% MTTR reduction.

Unified Platform
Windows plus Linux plus containers plus cloud in one interface. Same agent, same UI, same skillset.

October 5, 2026
Distributed Tracing In Netdata: OpenTelemetry Traces
Netdata now ingests OpenTelemetry traces over OTLP on the same Agent that collects your metrics and logs. Spans are stored and indexed on your own infrastructure and explored in the new Traces tab in Netdata Cloud.

August 17, 2026
Chart Annotations For Deploys, Incidents & Changes
Netdata Cloud now lets you pin notes to a specific moment on a chart — deployments, incidents, config changes, maintenance windows — shared across your whole Space and one click away from a root-cause correlation.
August 3, 2026
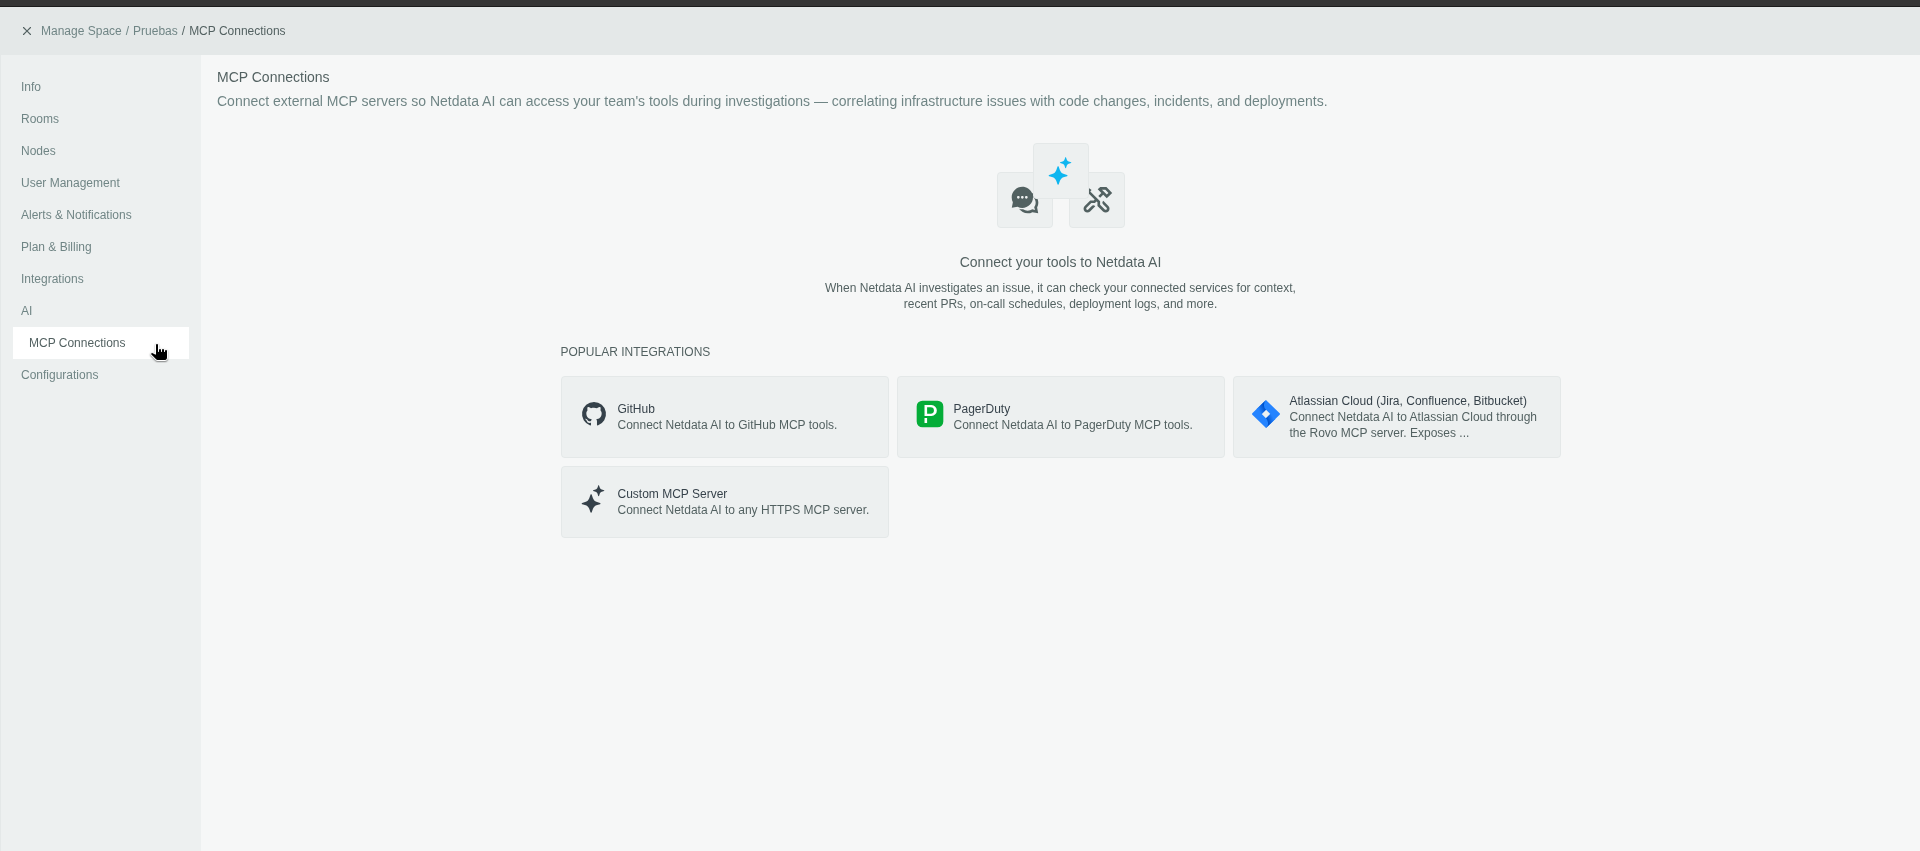
MCP Connections For Observability: AI As MCP Client
Netdata AI can now connect outward to GitHub, PagerDuty, Atlassian, and custom MCP servers via the Model Context Protocol, pulling in the context that explains why an alert fired, not just what changed.