


The World’s Most Popular Open Source Monitoring Platform
Deploy complete infrastructure observability in 60 seconds. Zero configuration. Instant visibility. ML-powered insights from day one. Trusted by millions of engineers worldwide.

Open Source Without the Complexity Tax
Get the flexibility you love with the simplicity you need
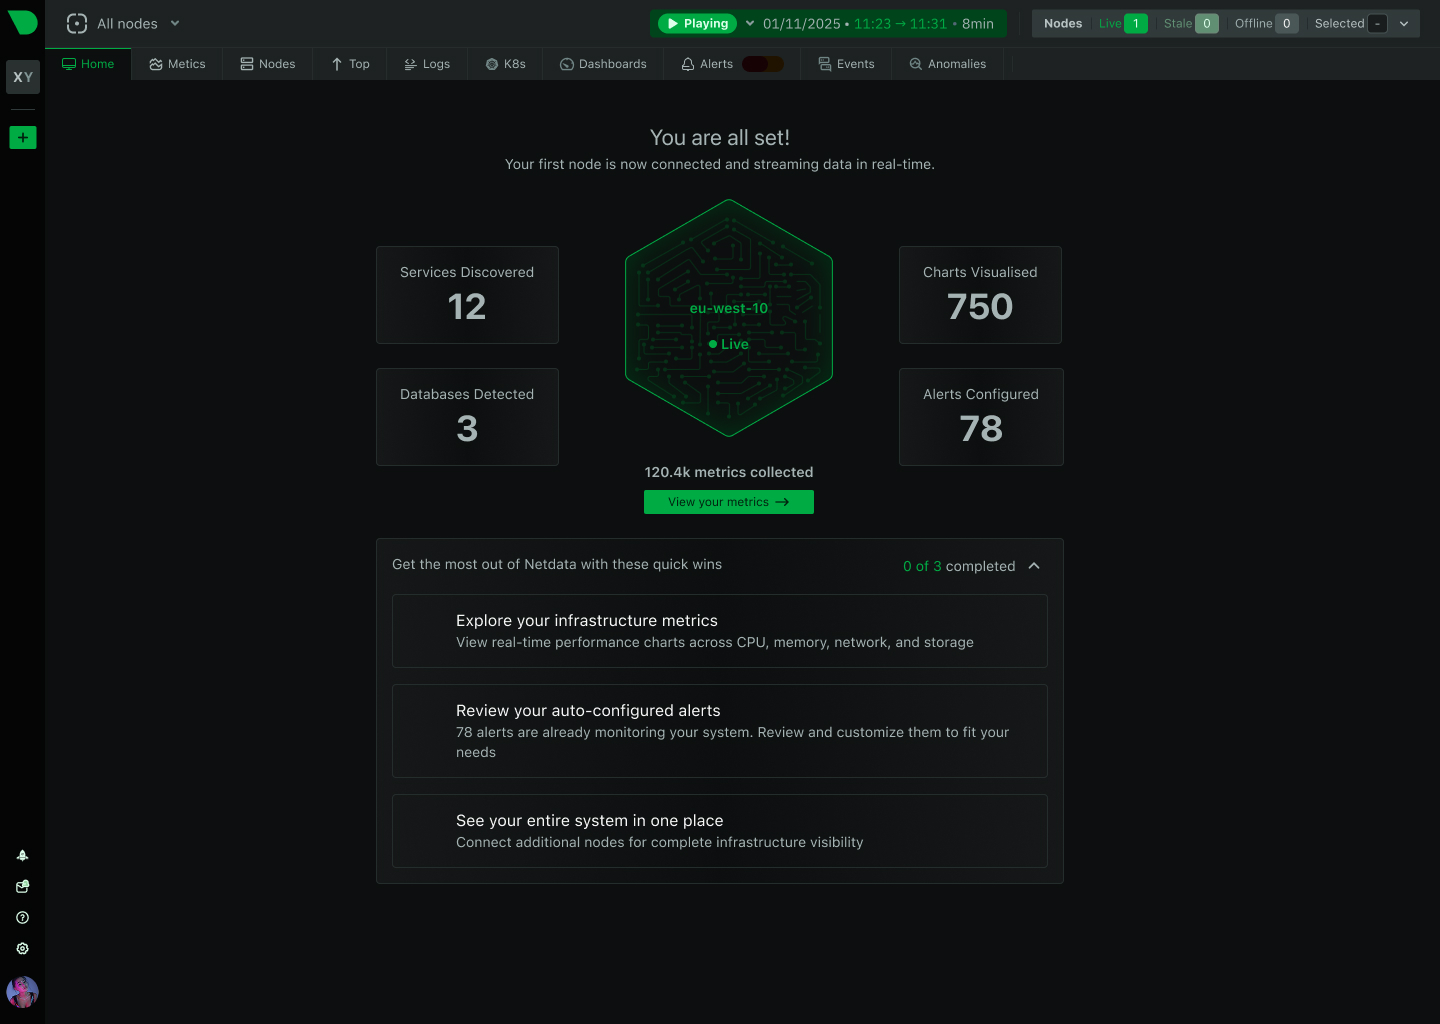
Deploy in 60 Seconds
One-line install. Auto-discovery. Instant dashboards. From installation to insights before your coffee gets cold.
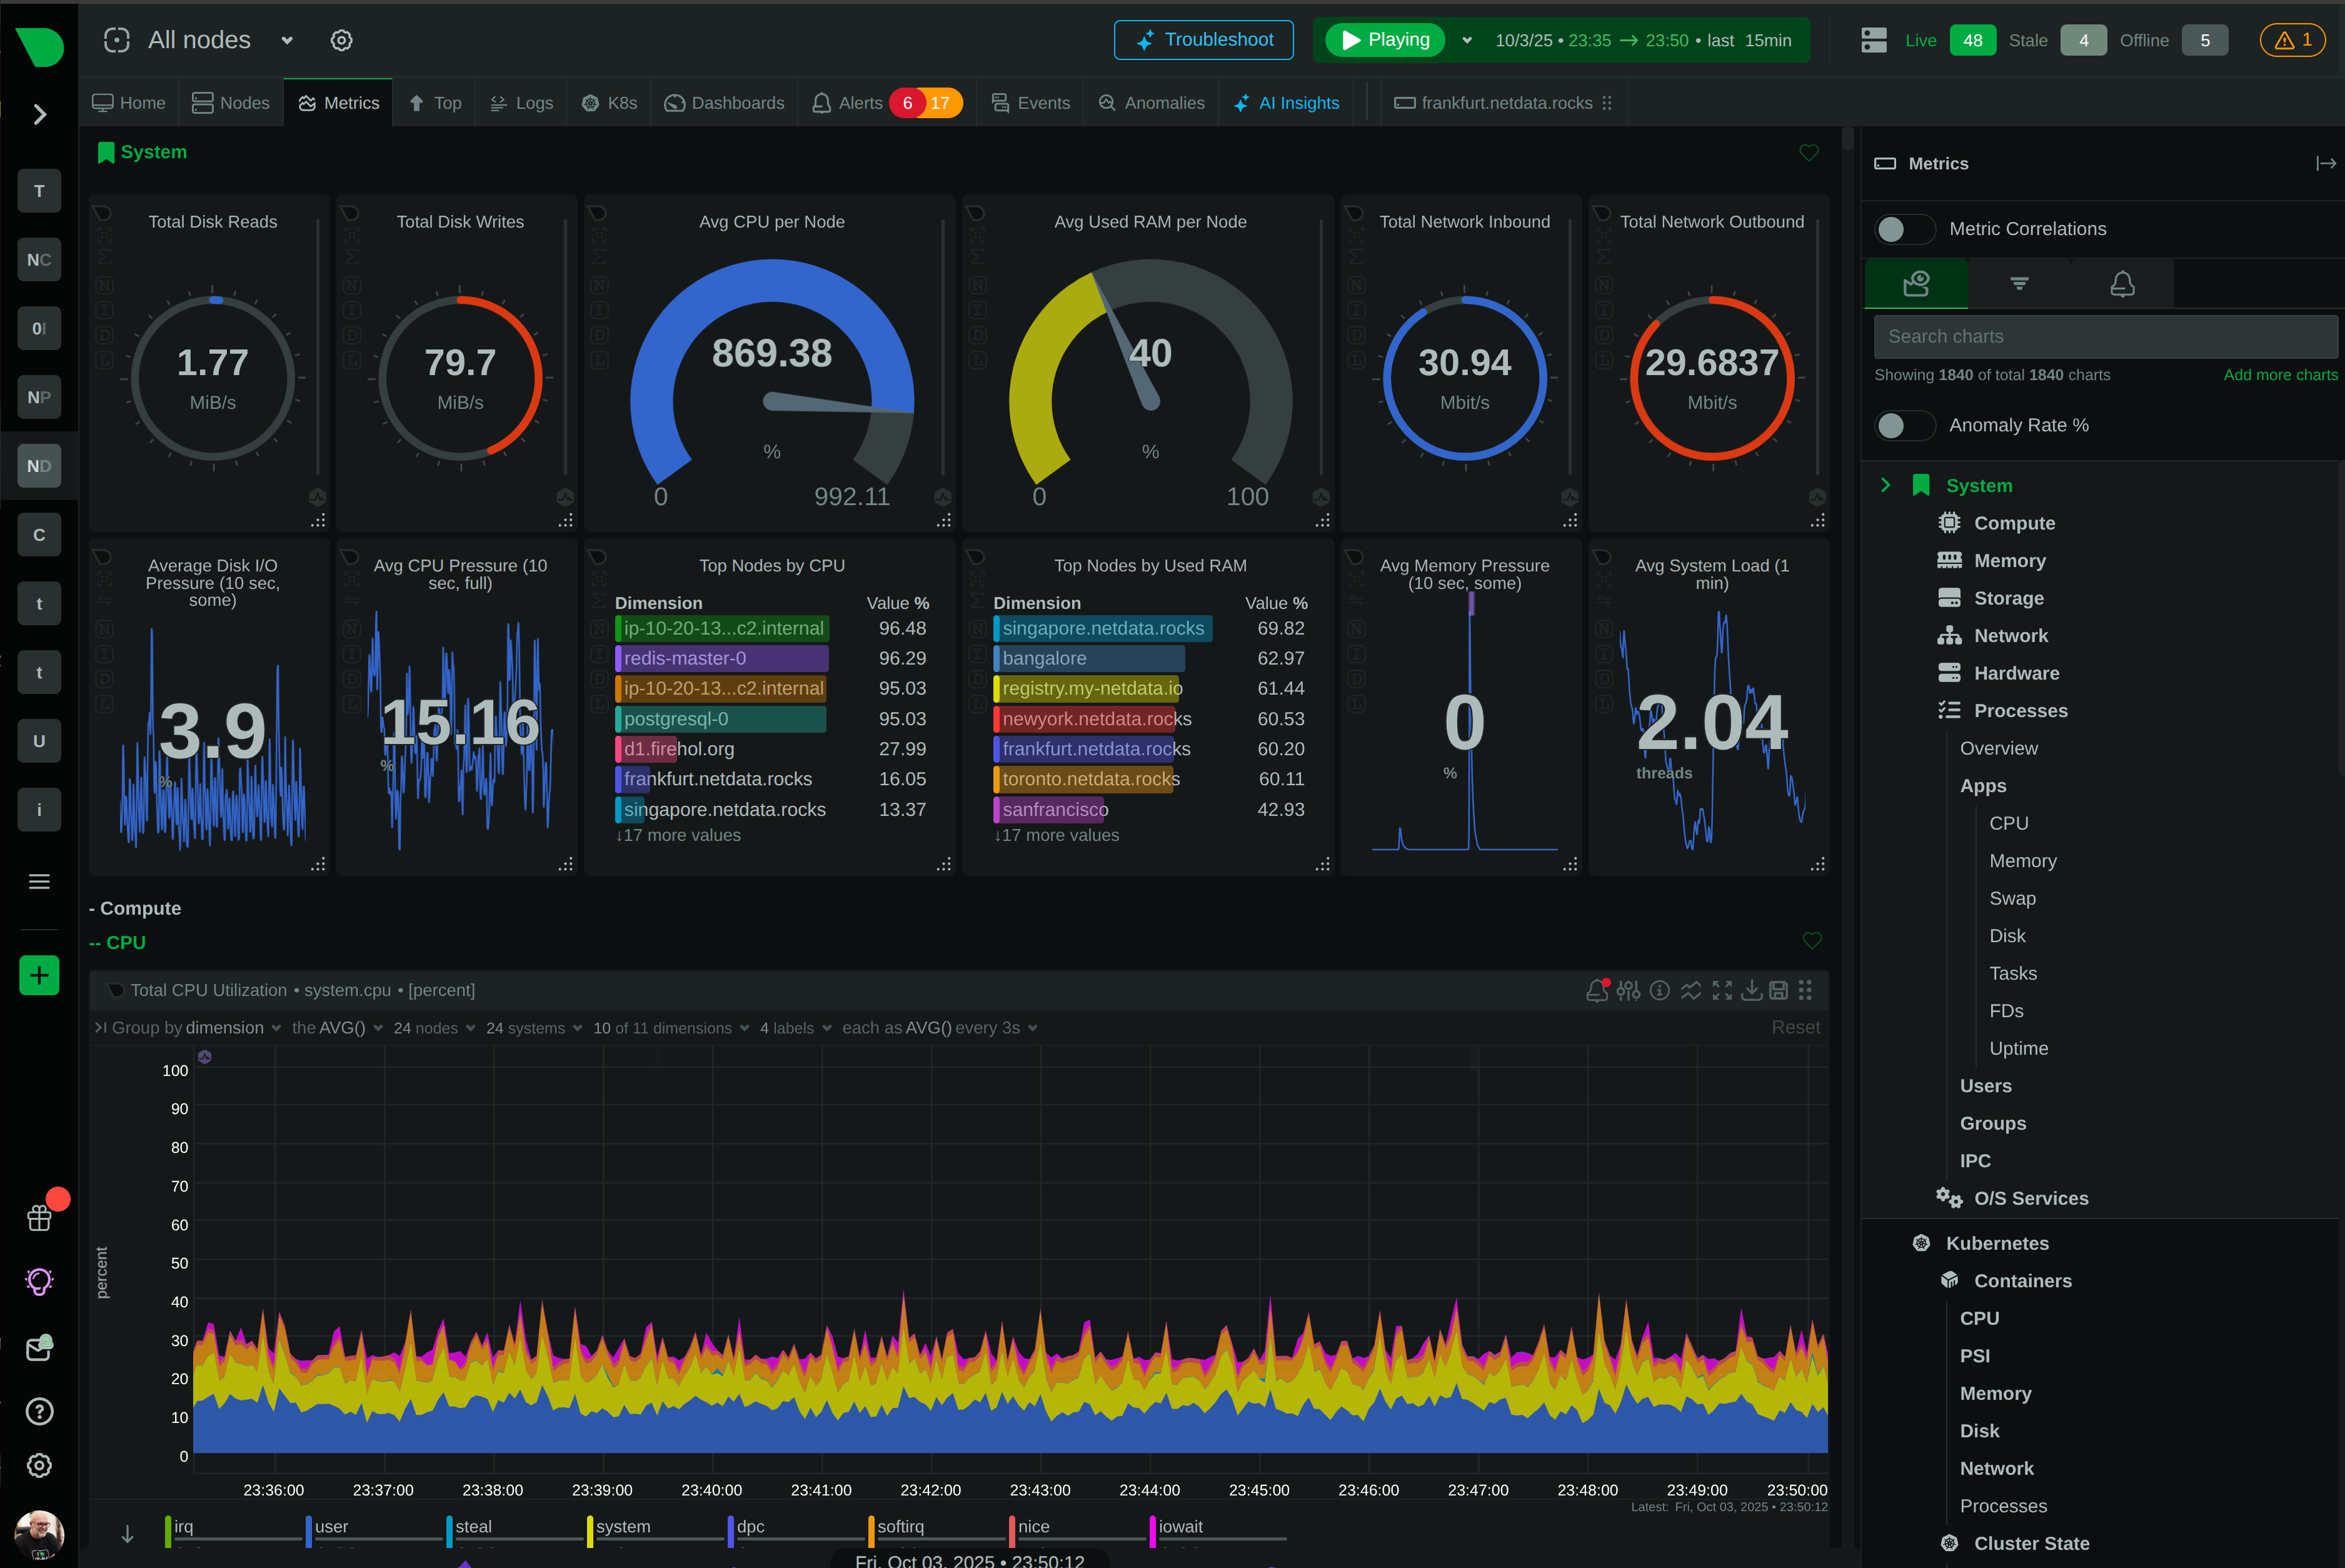
True Real-Time Monitoring
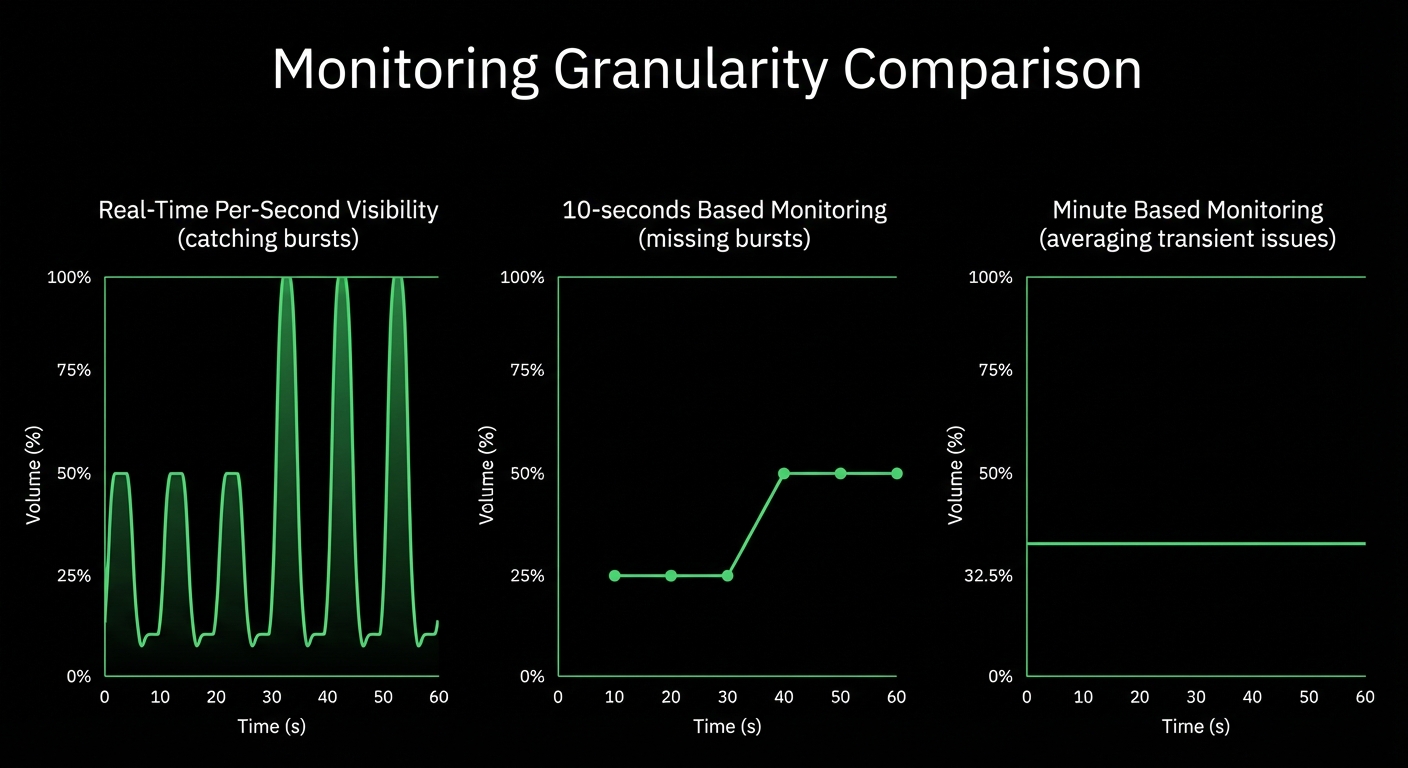
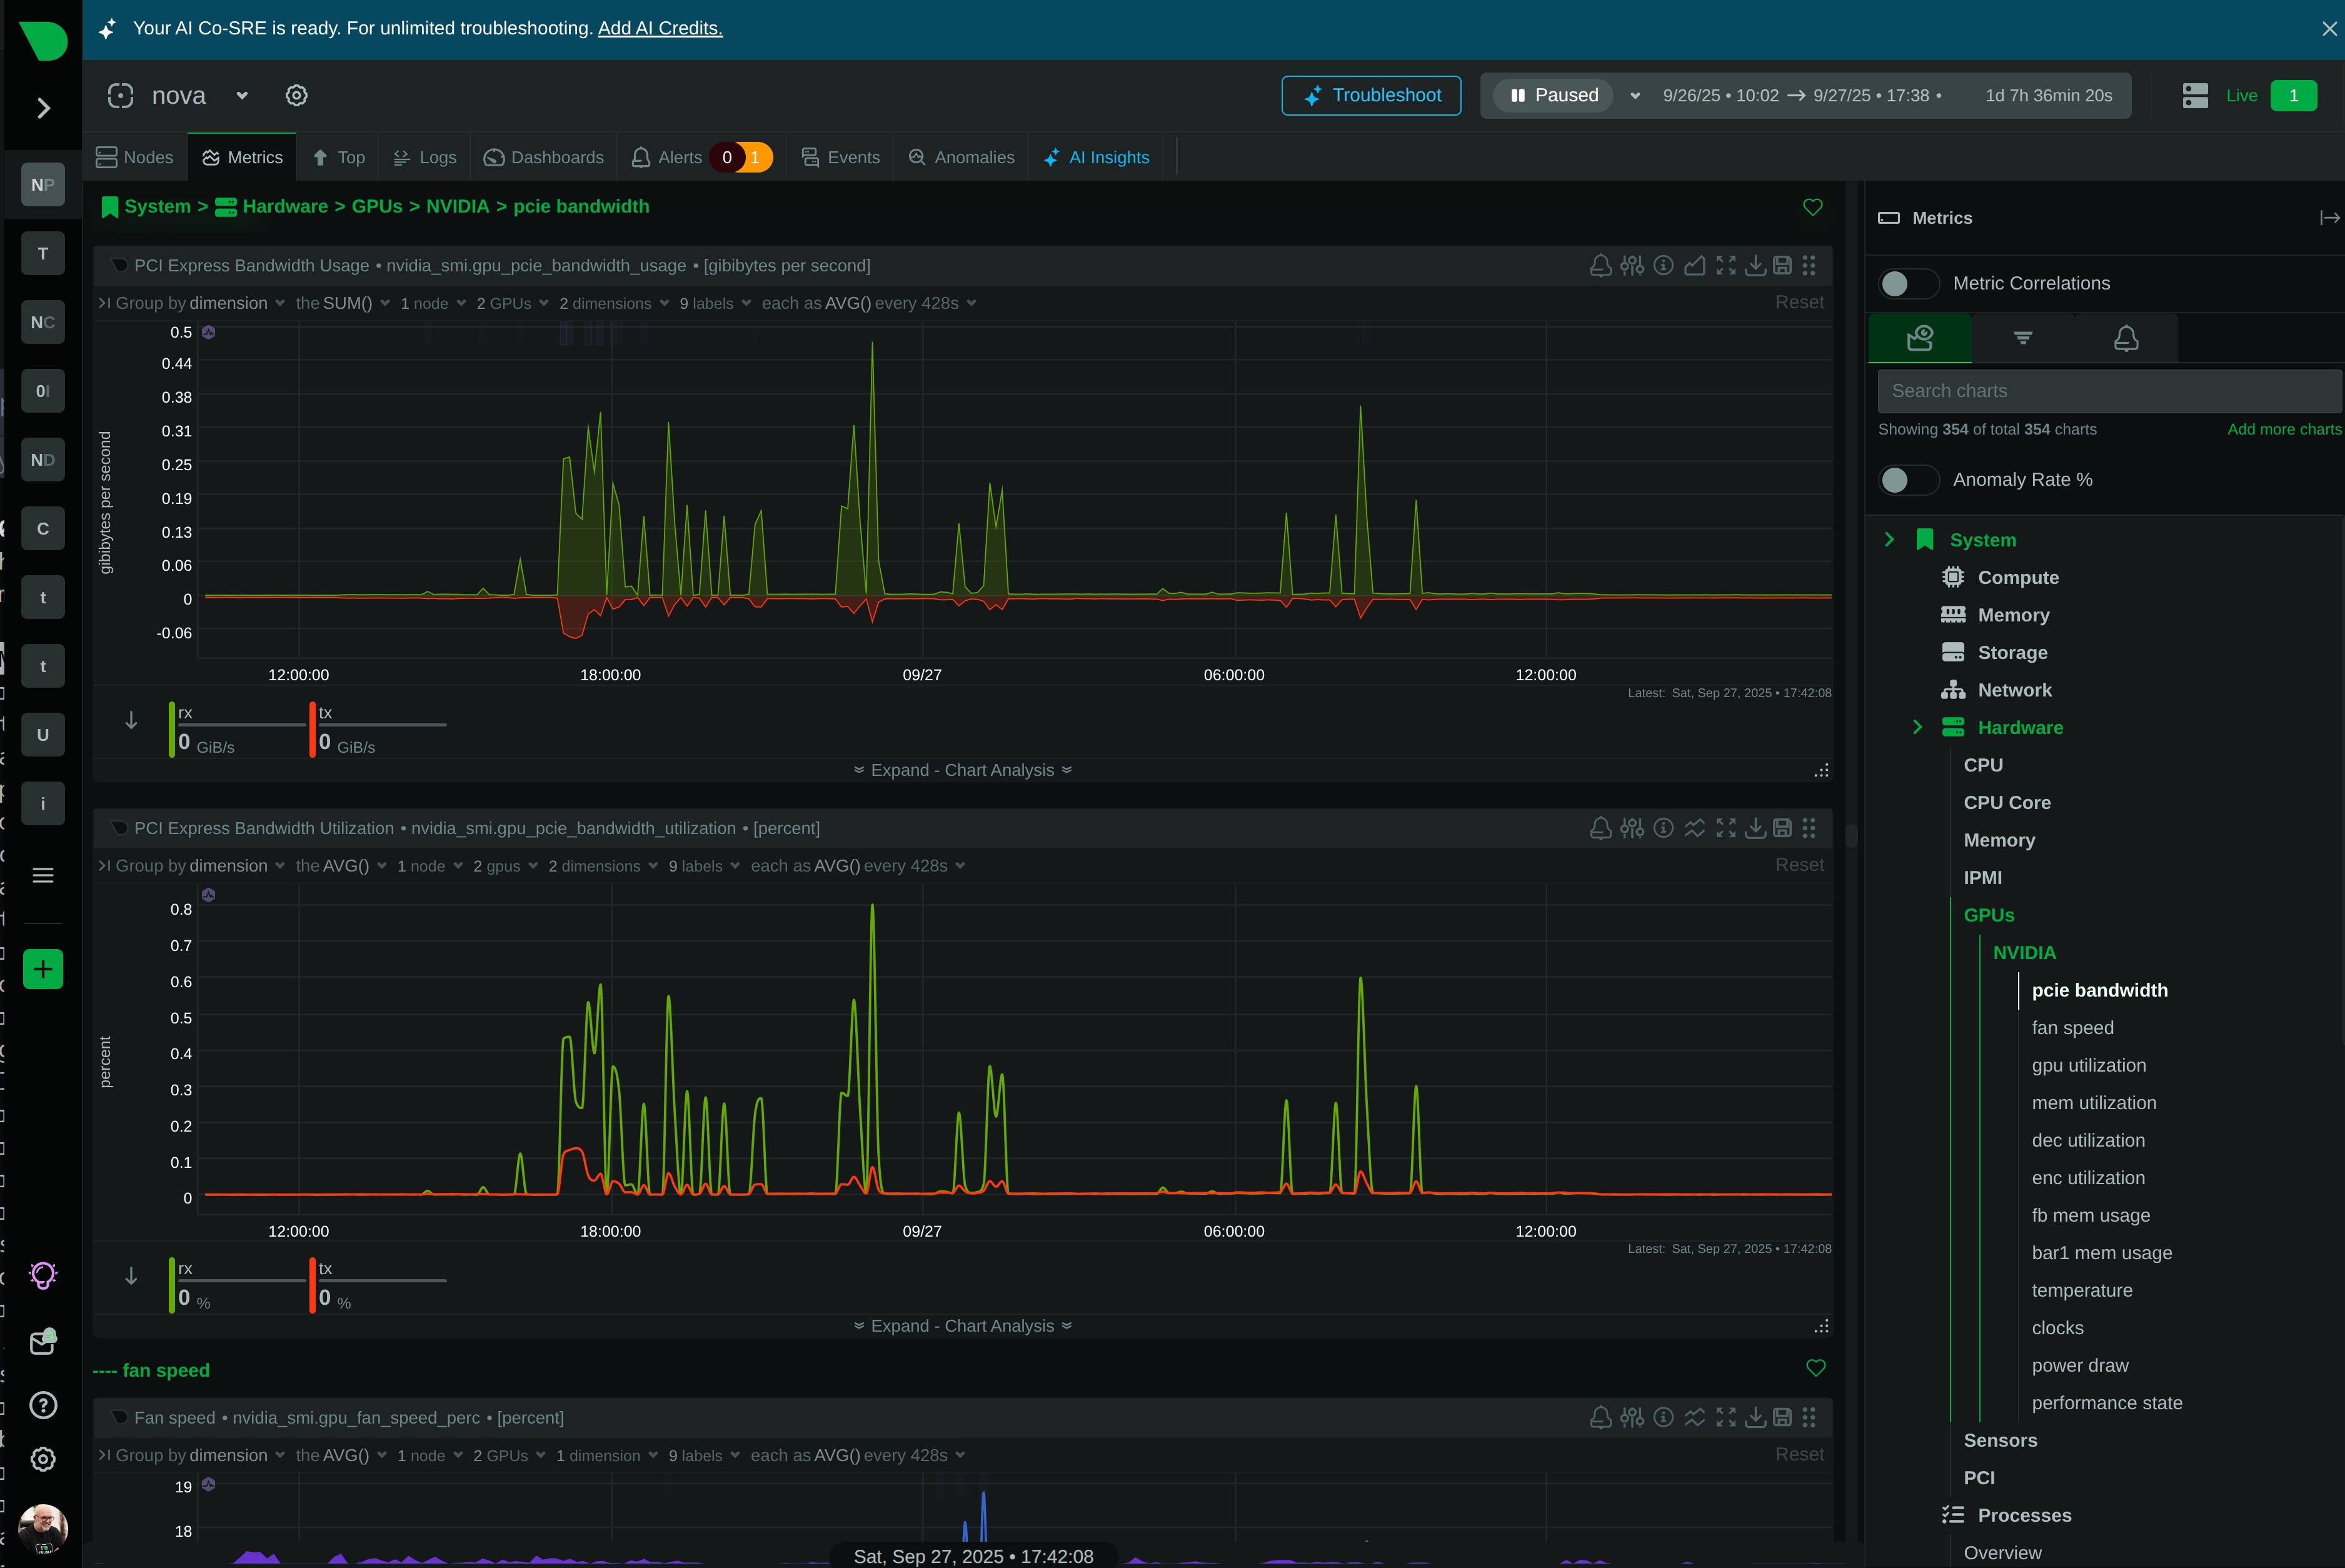
Per-second data collection with 1-second visualization latency. See what’s happening now, not what happened 30 seconds ago.
ML on Every Metric
18 unsupervised models train automatically per metric. 99% false positive reduction through consensus-based anomaly detection.
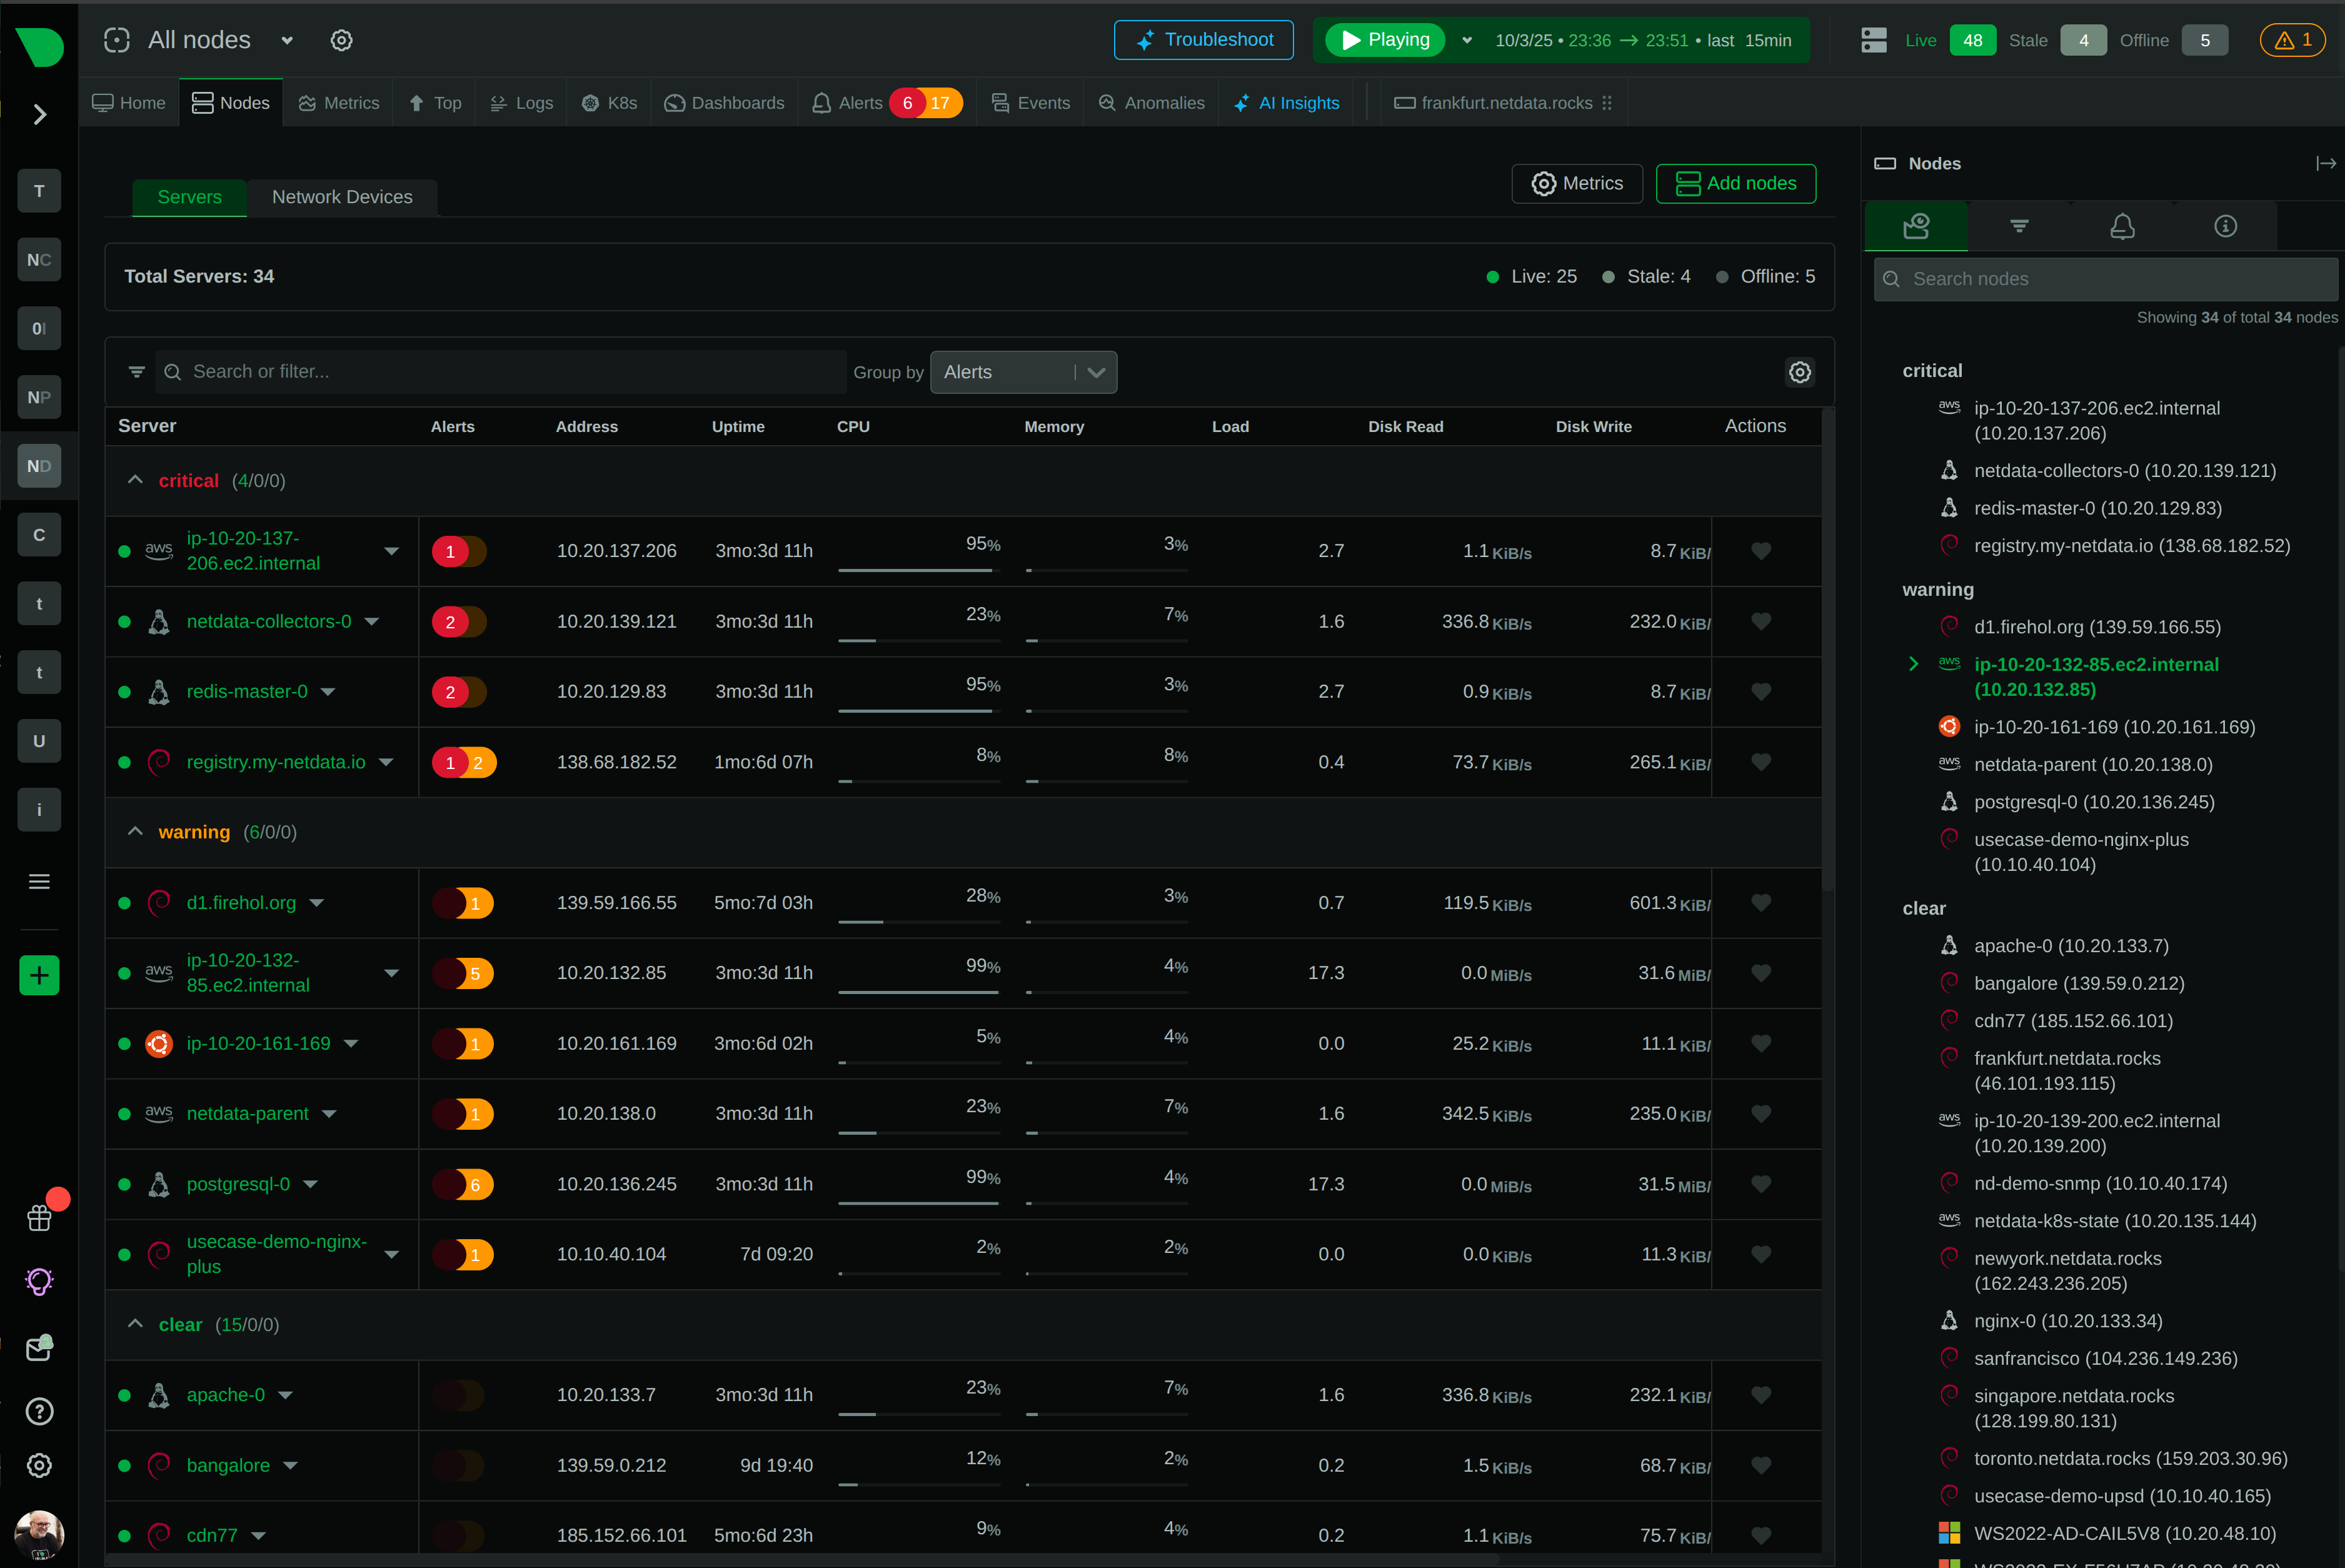
Unified Platform
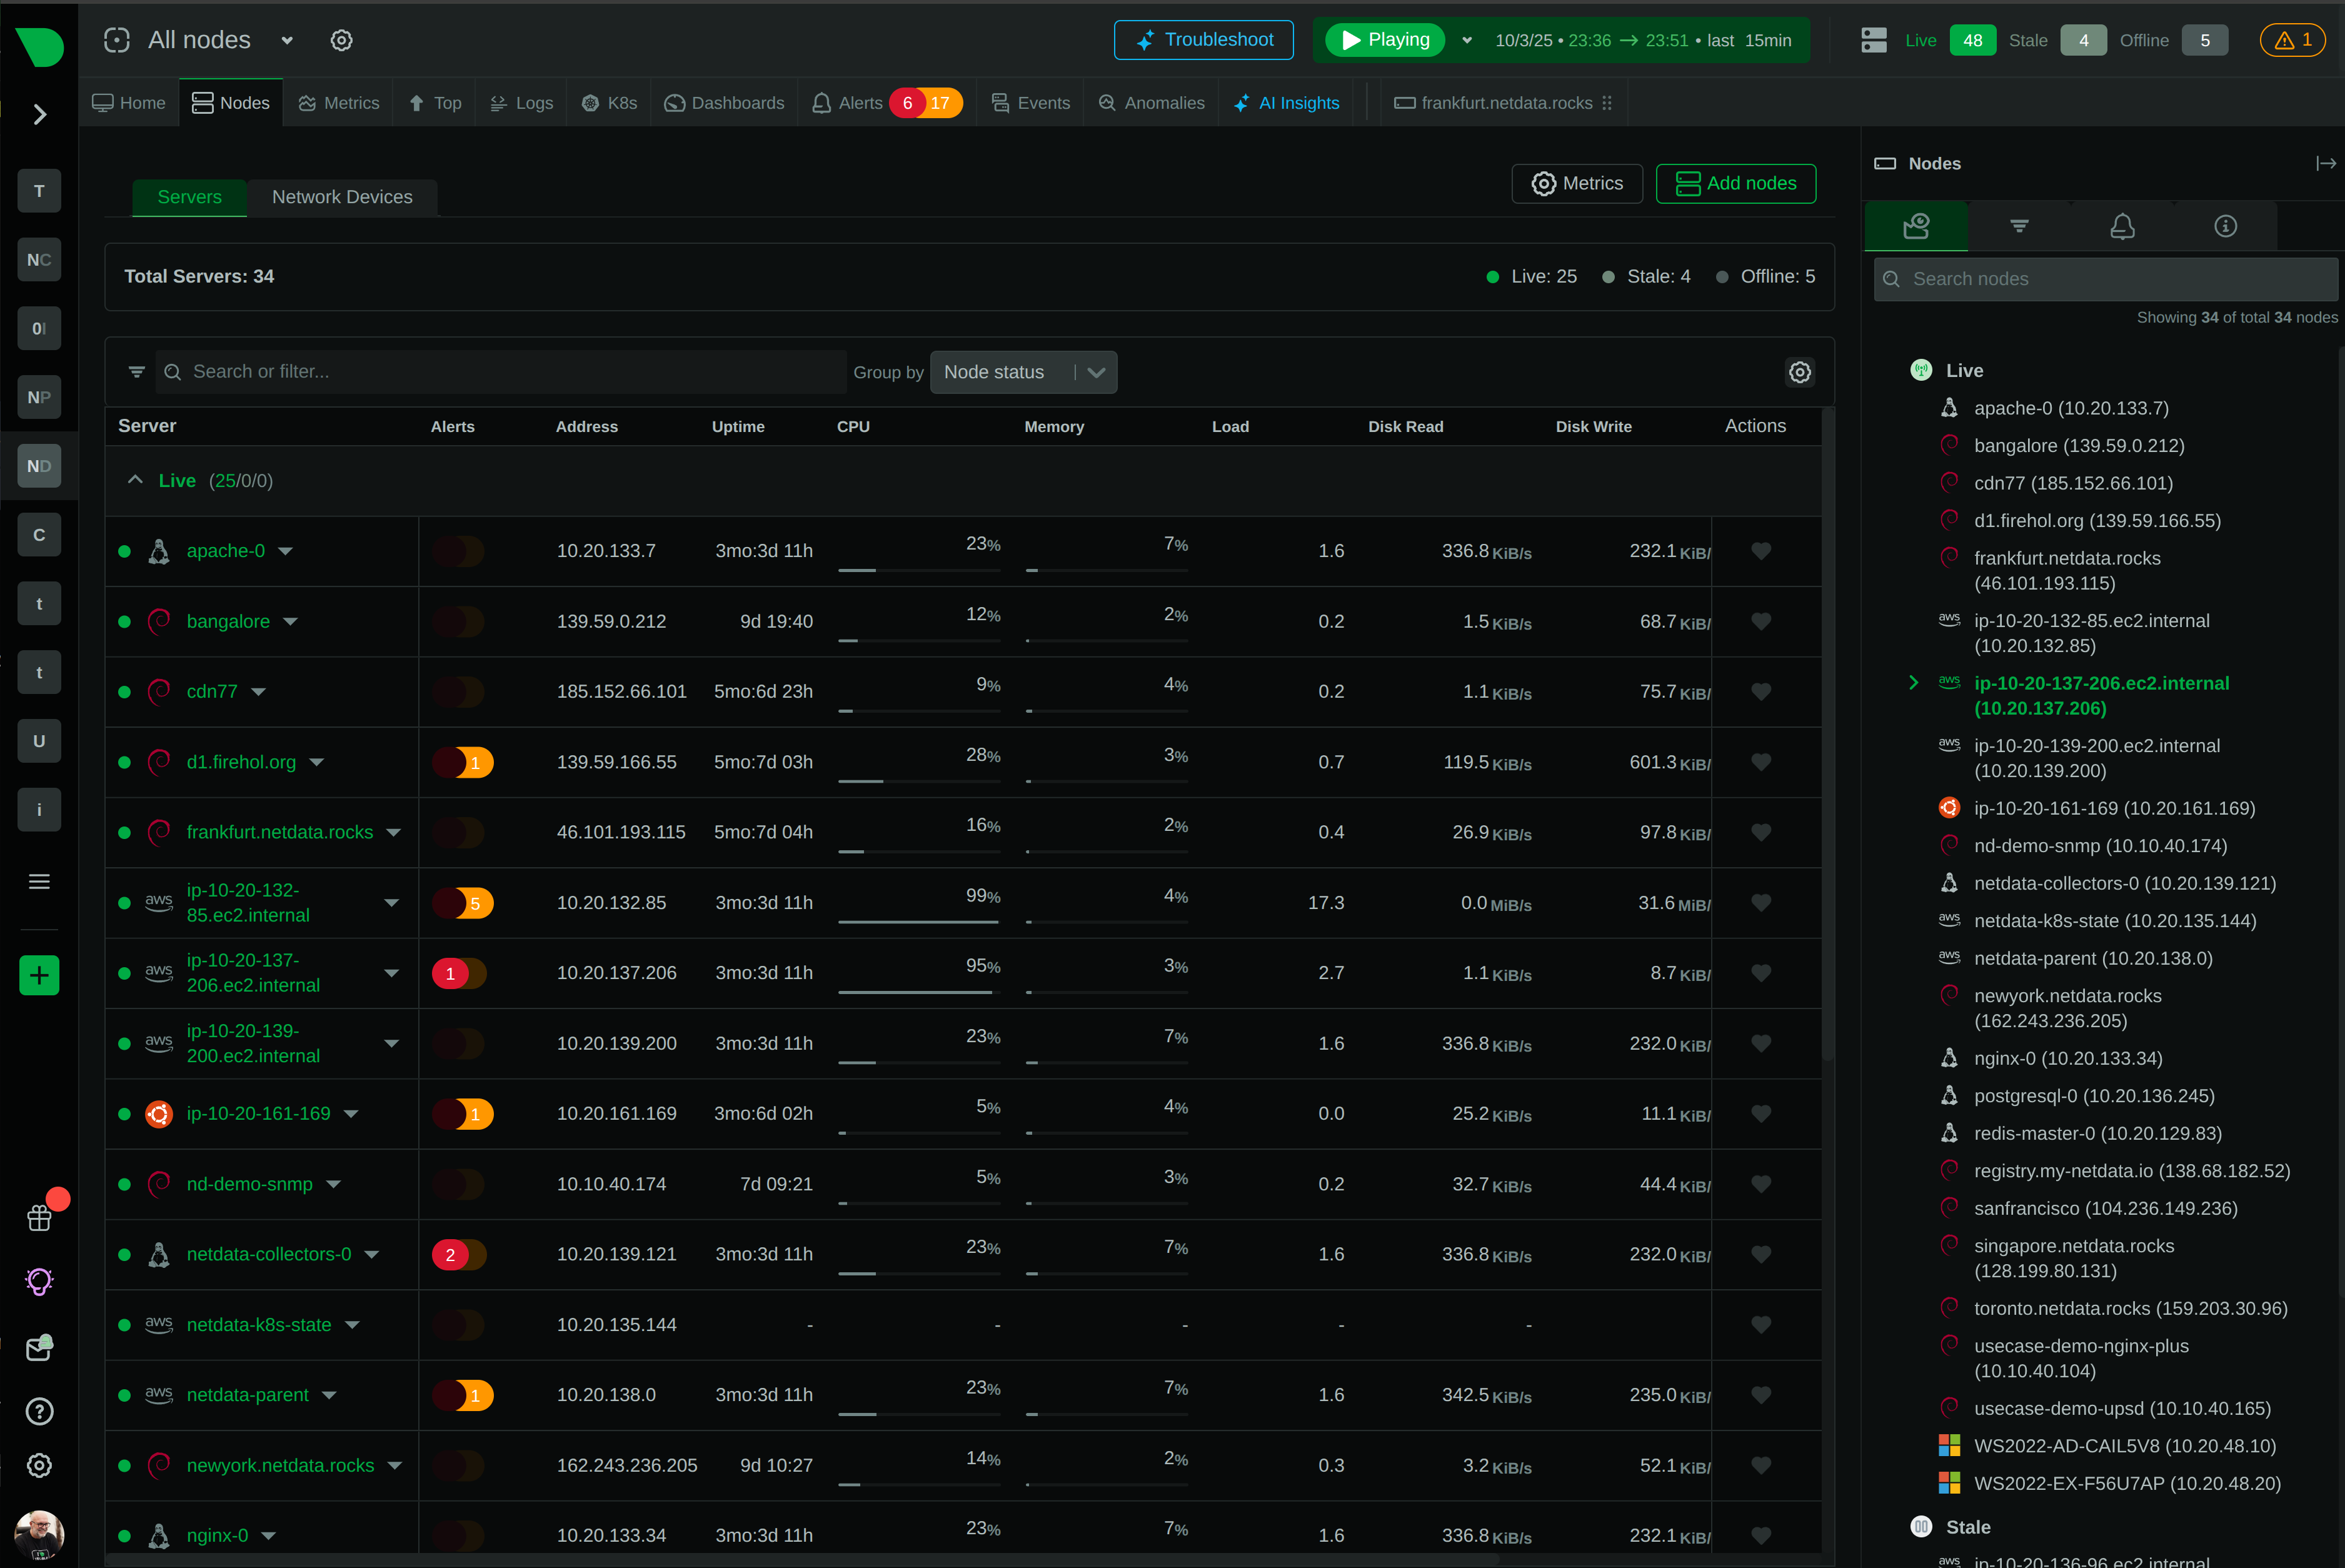
Metrics, logs, processes, connections - all in one interface. No context switching between fragmented tools.
Zero Configuration
800+ integrations auto-discovered. Algorithmic dashboards. No PromQL, no manual building, no query languages required.
Transparent Economics
Per-node pricing with no hidden costs. Unlimited metrics, logs, users. 90% cost reduction vs commercial solutions.
Trusted by DevOps teams worldwide


Why Millions Choose Netdata
Eliminate the Operational Tax of Traditional Open Source
60 seconds to first dashboard vs days/weeks for LGTM stack
See Quick Start Guide
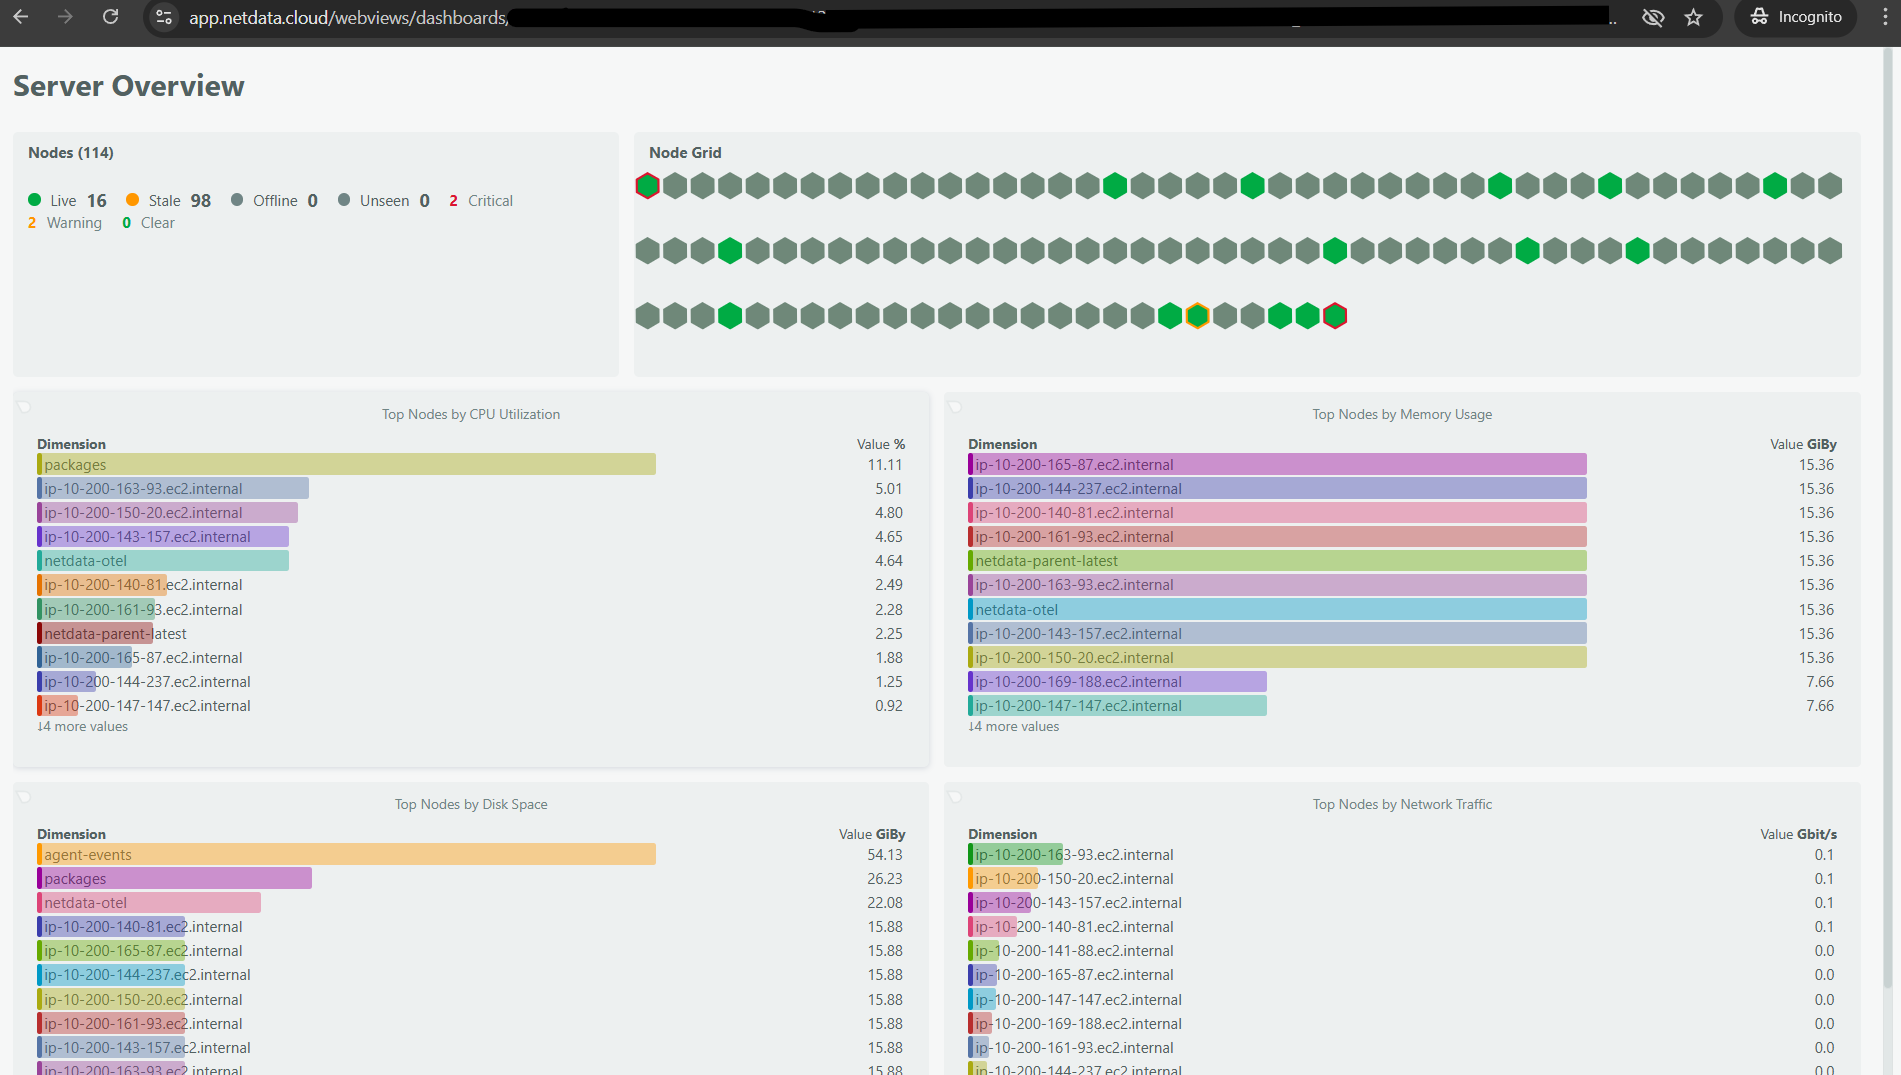
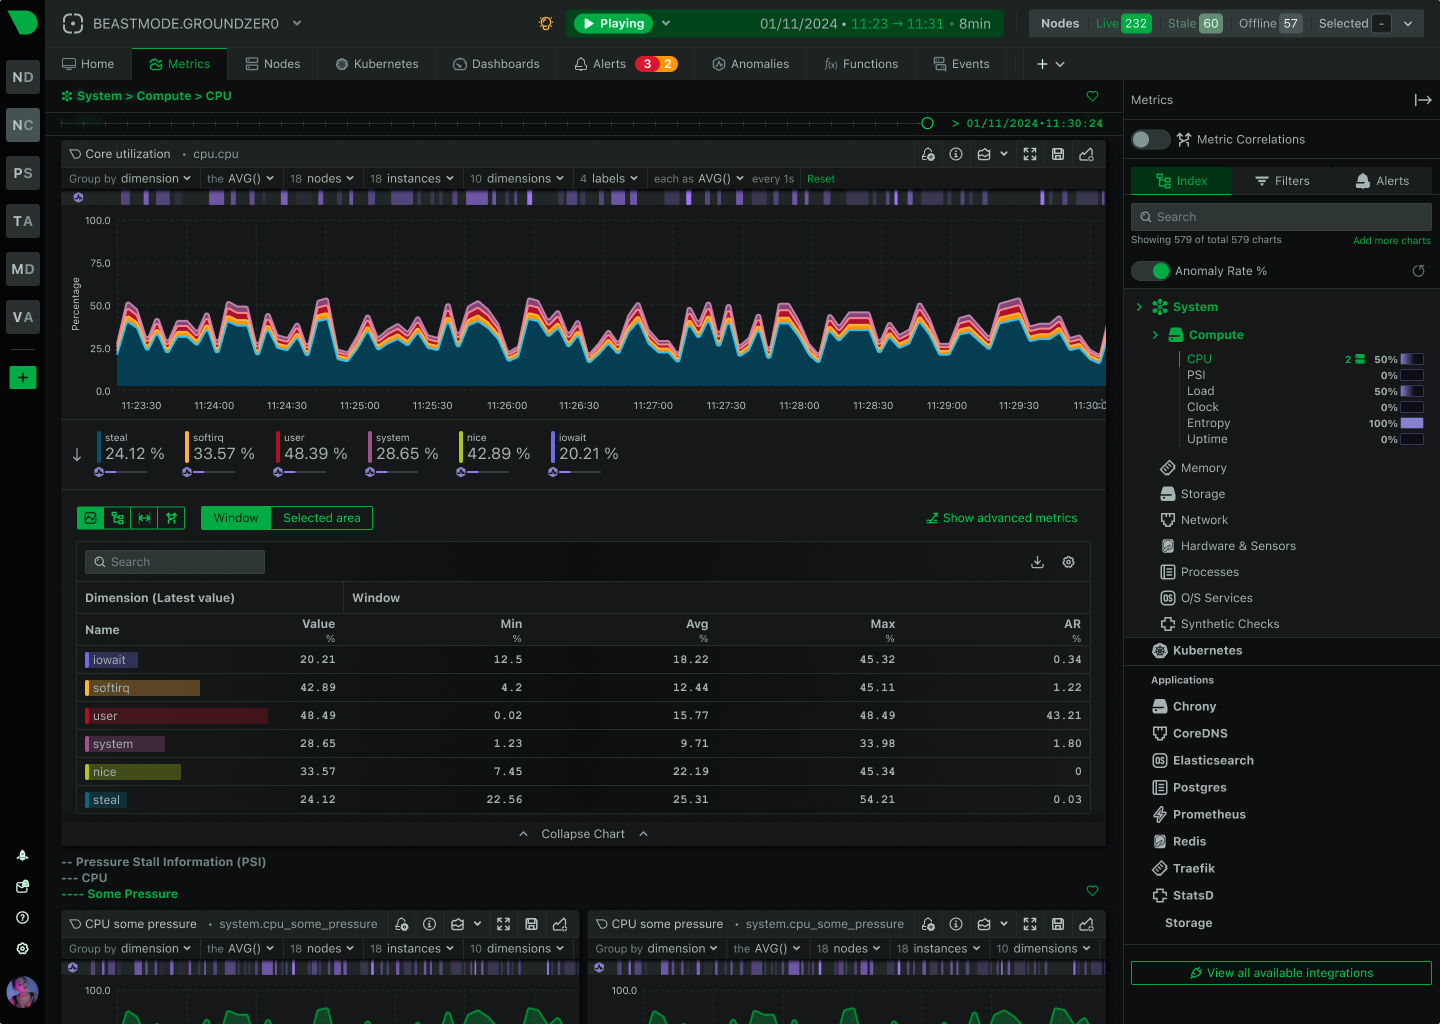
Catch Problems While They’re Still Seconds, Not Incidents
10-30× more granular than standard monitoring
Learn About Real-Time
Unified Intelligence Accelerates Resolution by 80%
80% MTTR reduction through unified visibility
Explore AI Features
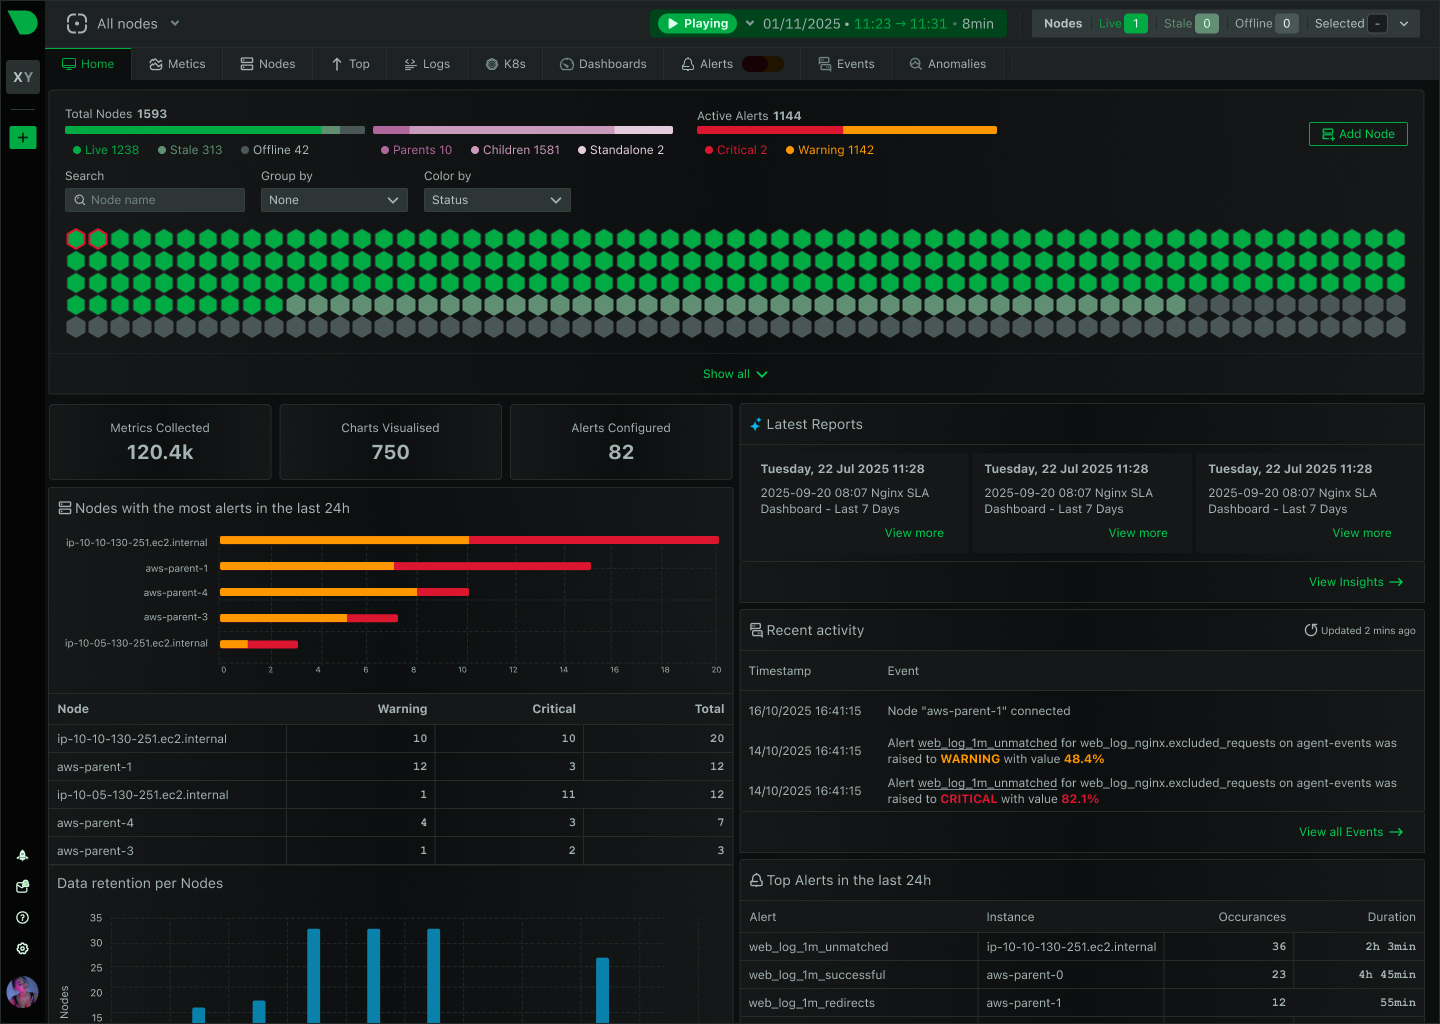
Scale From 10 to 10,000 Nodes Without Changing Architecture
100,000+ node deployments in production
Understand Scalability

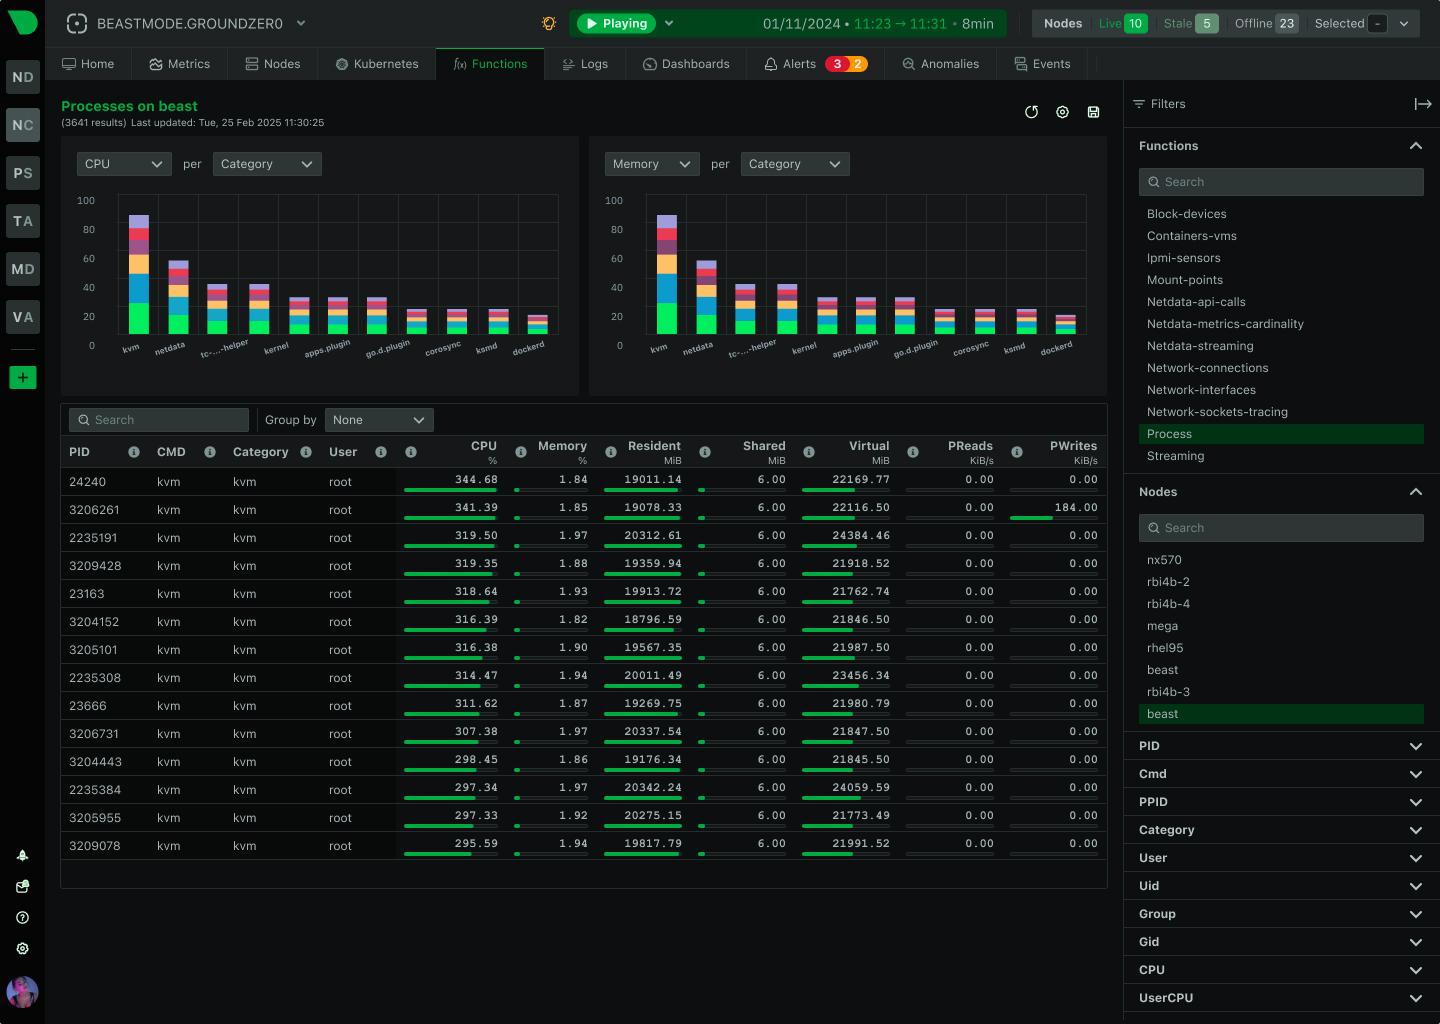
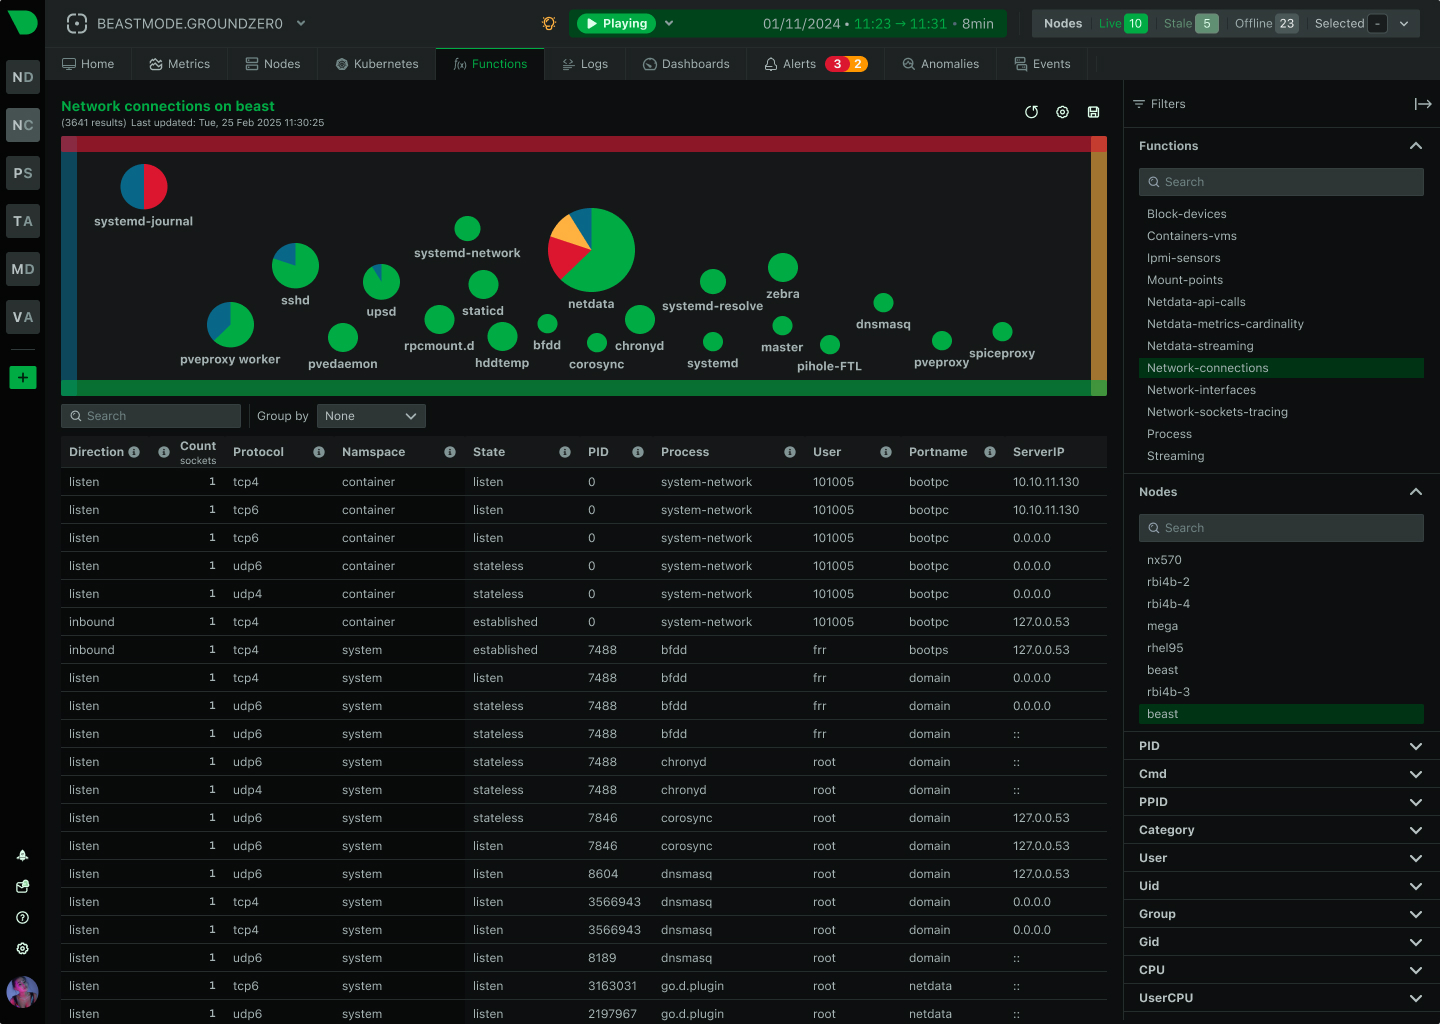
Debug Production Without SSH - Security Team Approved
Replaces 20+ console tools with unified interface
See Netdata Functions
Keep 90% More Budget While Gaining Superior Capabilities
90% cost reduction vs Datadog/New Relic
View Pricing

Open Source Observability Comparison
How Netdata Compares to Traditional Open Source Stacks
See why millions choose Netdata over fragmented open source solutions
Capability
Netdata
Prometheus + Grafana + ELK
Time to First Dashboard
✅ 60 seconds
One-line install, instant visibility
⚠️ Days to weeks
Manual configuration, dashboard building
Data Granularity
✅ Per-second
True real-time, no sampling
⚠️ 10-30 seconds
Near real-time, misses transients
Configuration Required
✅ Zero
Auto-discovery, algorithmic dashboards
❌ Extensive
Collectors, exporters, dashboards
Query Language
✅ None
Point-and-click analysis
❌ PromQL + LogQL
Steep learning curve
ML Anomaly Detection
✅ Automatic
18 models per metric, edge-based
❌ Manual
Requires configuration and tuning
Unified Platform
✅ Metrics + Logs
Single interface, instant correlation
❌ Fragmented
3+ tools, context switching
Operational Overhead
✅ Zero
Self-managing, no maintenance
❌ Dedicated FTE
Constant tuning and scaling
Storage Efficiency
✅ 0.6 bytes/sample
Industry-leading compression
⚠️ 2-16 bytes/sample
Higher storage costs
AI Troubleshooting
✅ Included
Natural language via MCP
❌ Not Available
Manual investigation only
Open Source Excellence Meets Enterprise Capabilities
Built by Engineers, For Engineers
76,300+ GitHub stars. 615+ contributors. 1.5M downloads per day. Active Discord community. Transparent development. Your voice shapes the roadmap.
Join millions of engineers worldwide
View on GitHub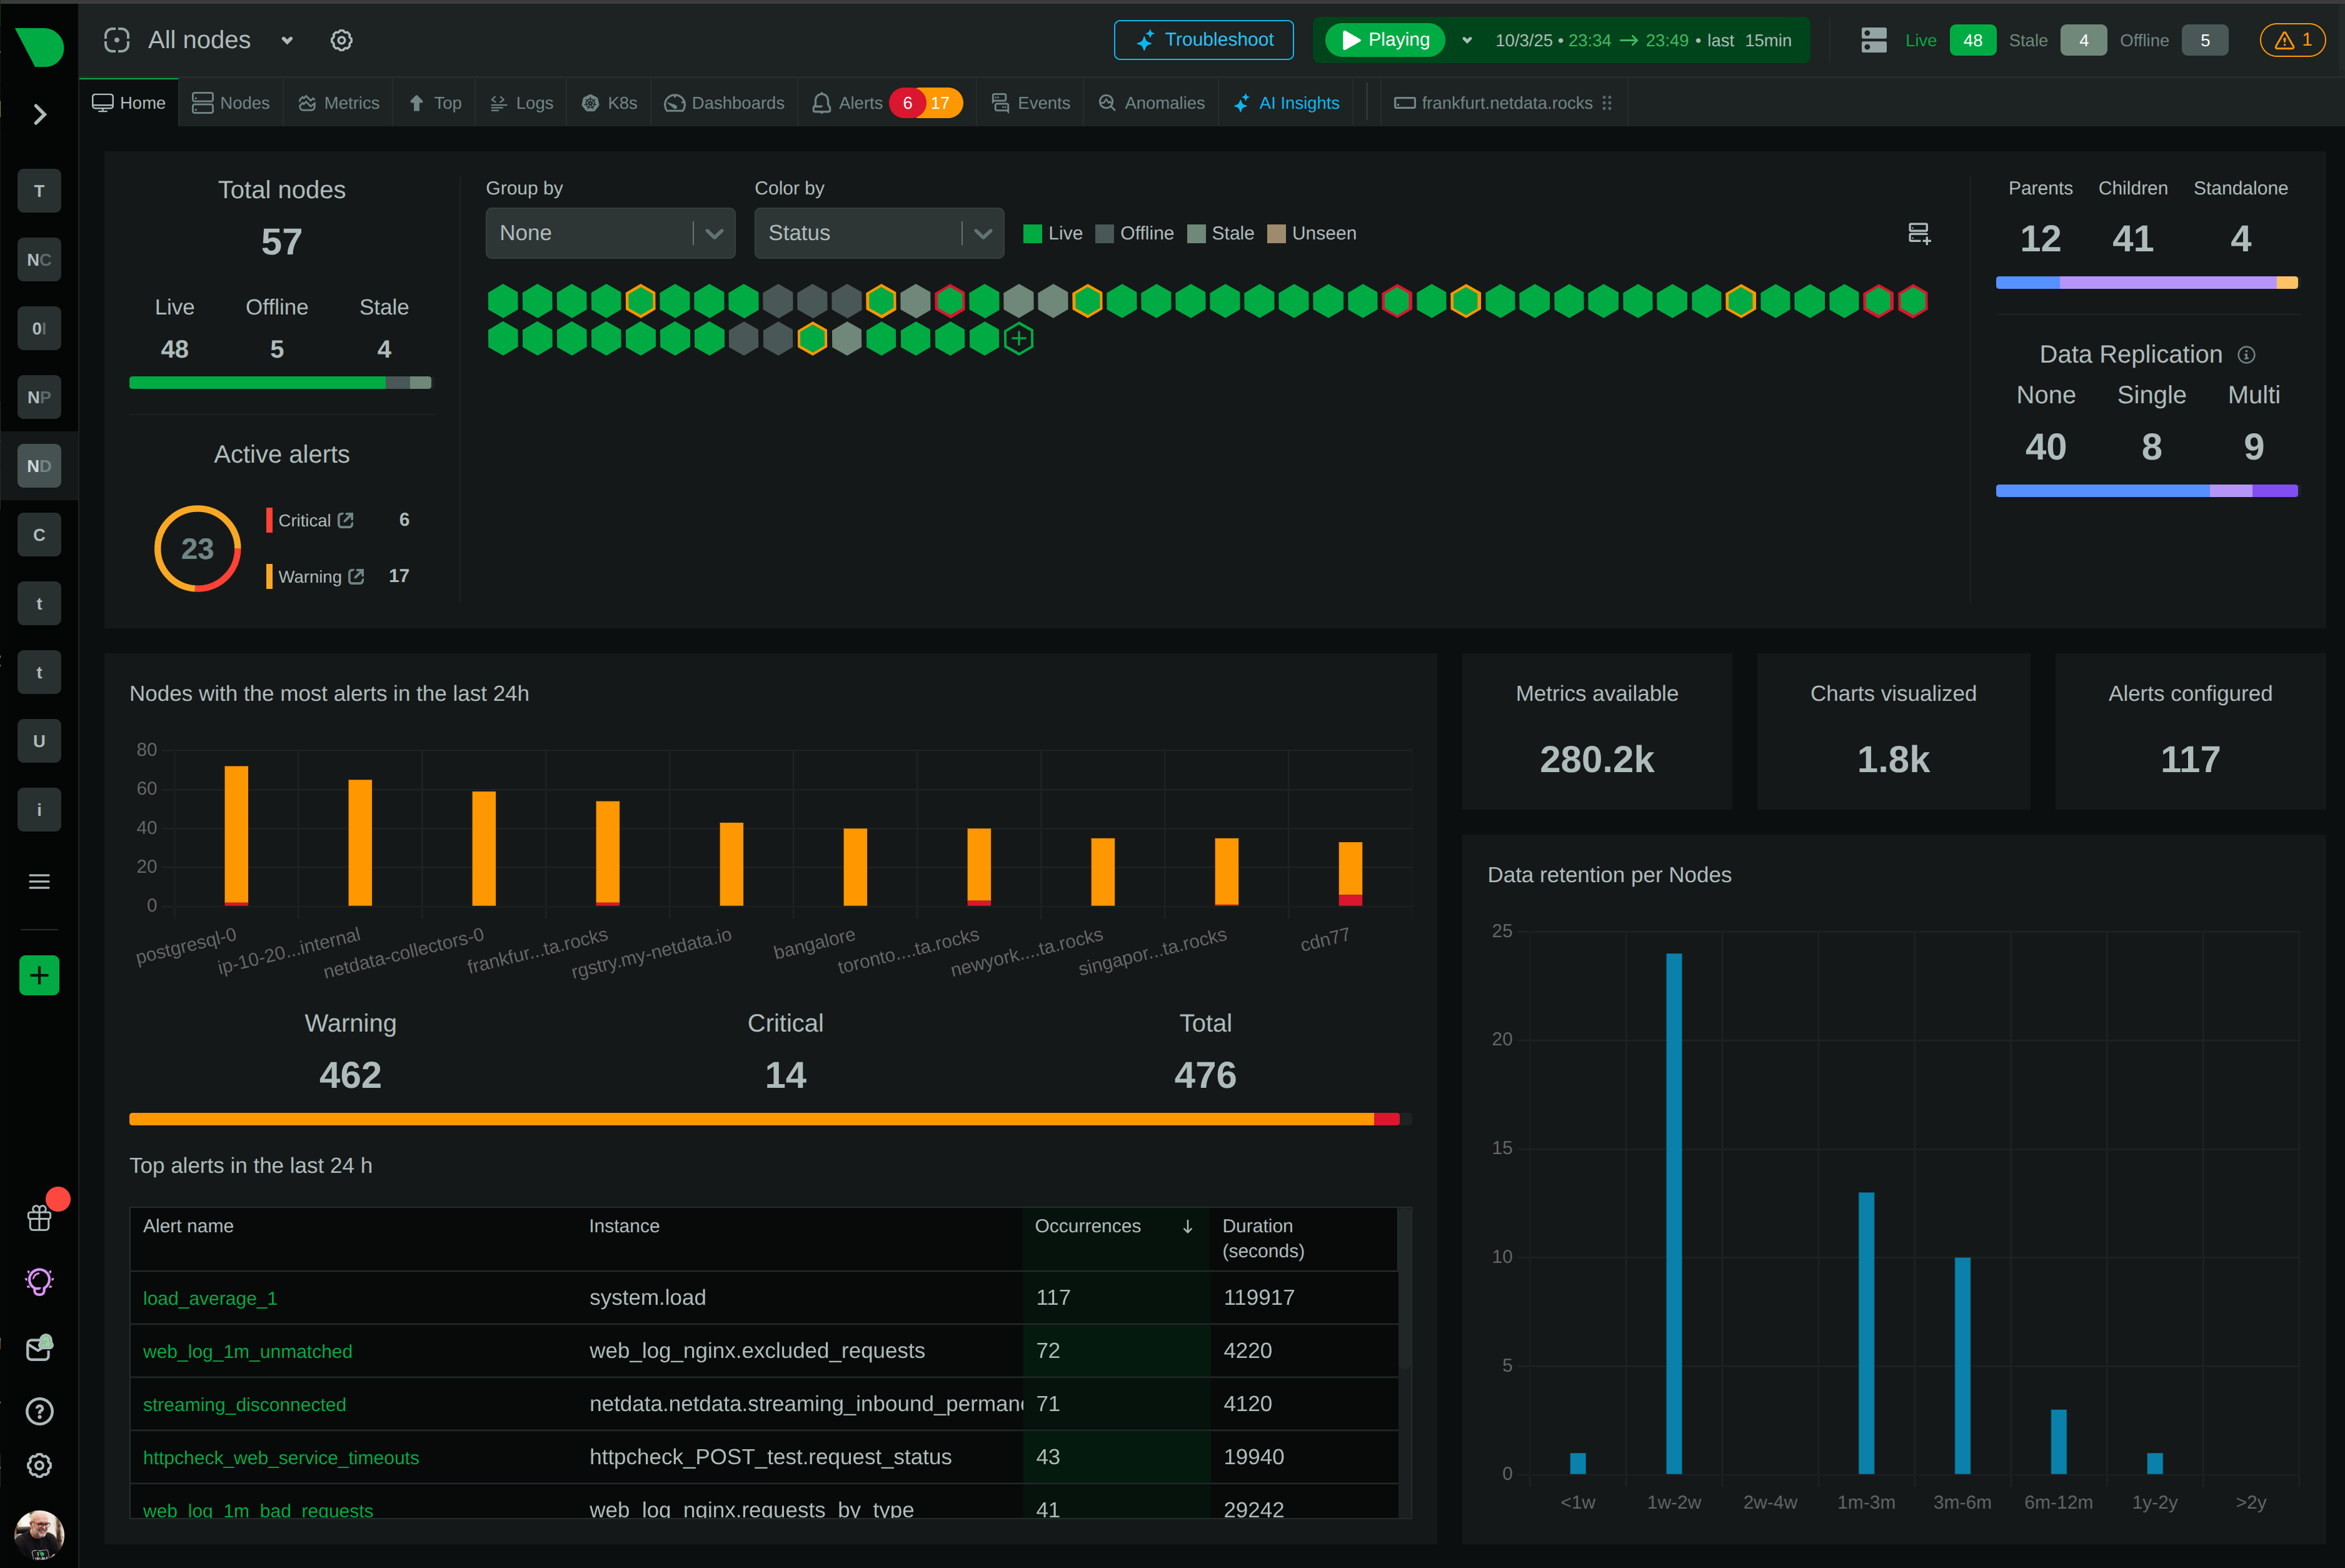
Why Open Source Teams Choose Netdata
The benefits that matter most to engineering teams
Deploy in 60 Seconds
One-line install. Auto-discovery. Instant dashboards. From installation to insights before your coffee gets cold.
Skill Independence
Junior engineers get senior-level visibility automatically. No query language expertise required. Same powerful tools for everyone.
90% Cost Reduction
Transparent per-node pricing. Unlimited metrics, logs, users. No surprise bills based on data volume.
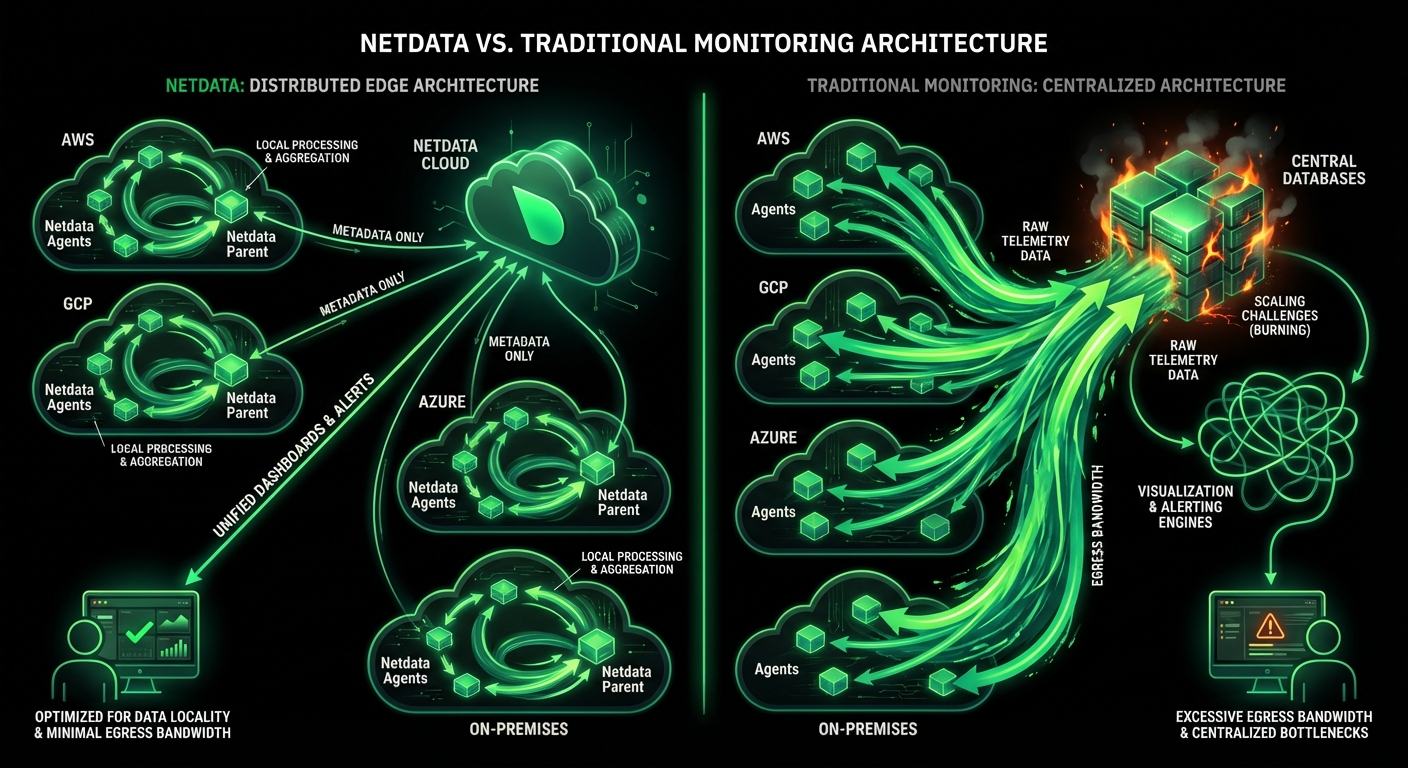
Data Sovereignty
All metrics stay on-premises. Only metadata travels to Cloud. GDPR, HIPAA, PCI DSS aligned by design.
True Real-Time
Per-second data collection with 1-second visualization latency. See what’s happening now, not 30 seconds ago.
ML on Every Metric
18 unsupervised models train automatically. 99% false positive reduction in anomaly detection. Root cause in top 30-50 results.
Unified Platform
Metrics, logs, processes, connections - all in one interface. No context switching between fragmented tools.
Linear Scalability
Grow from 10 to 10,000 nodes without changing architecture. Proven at 100,000+ node deployments.
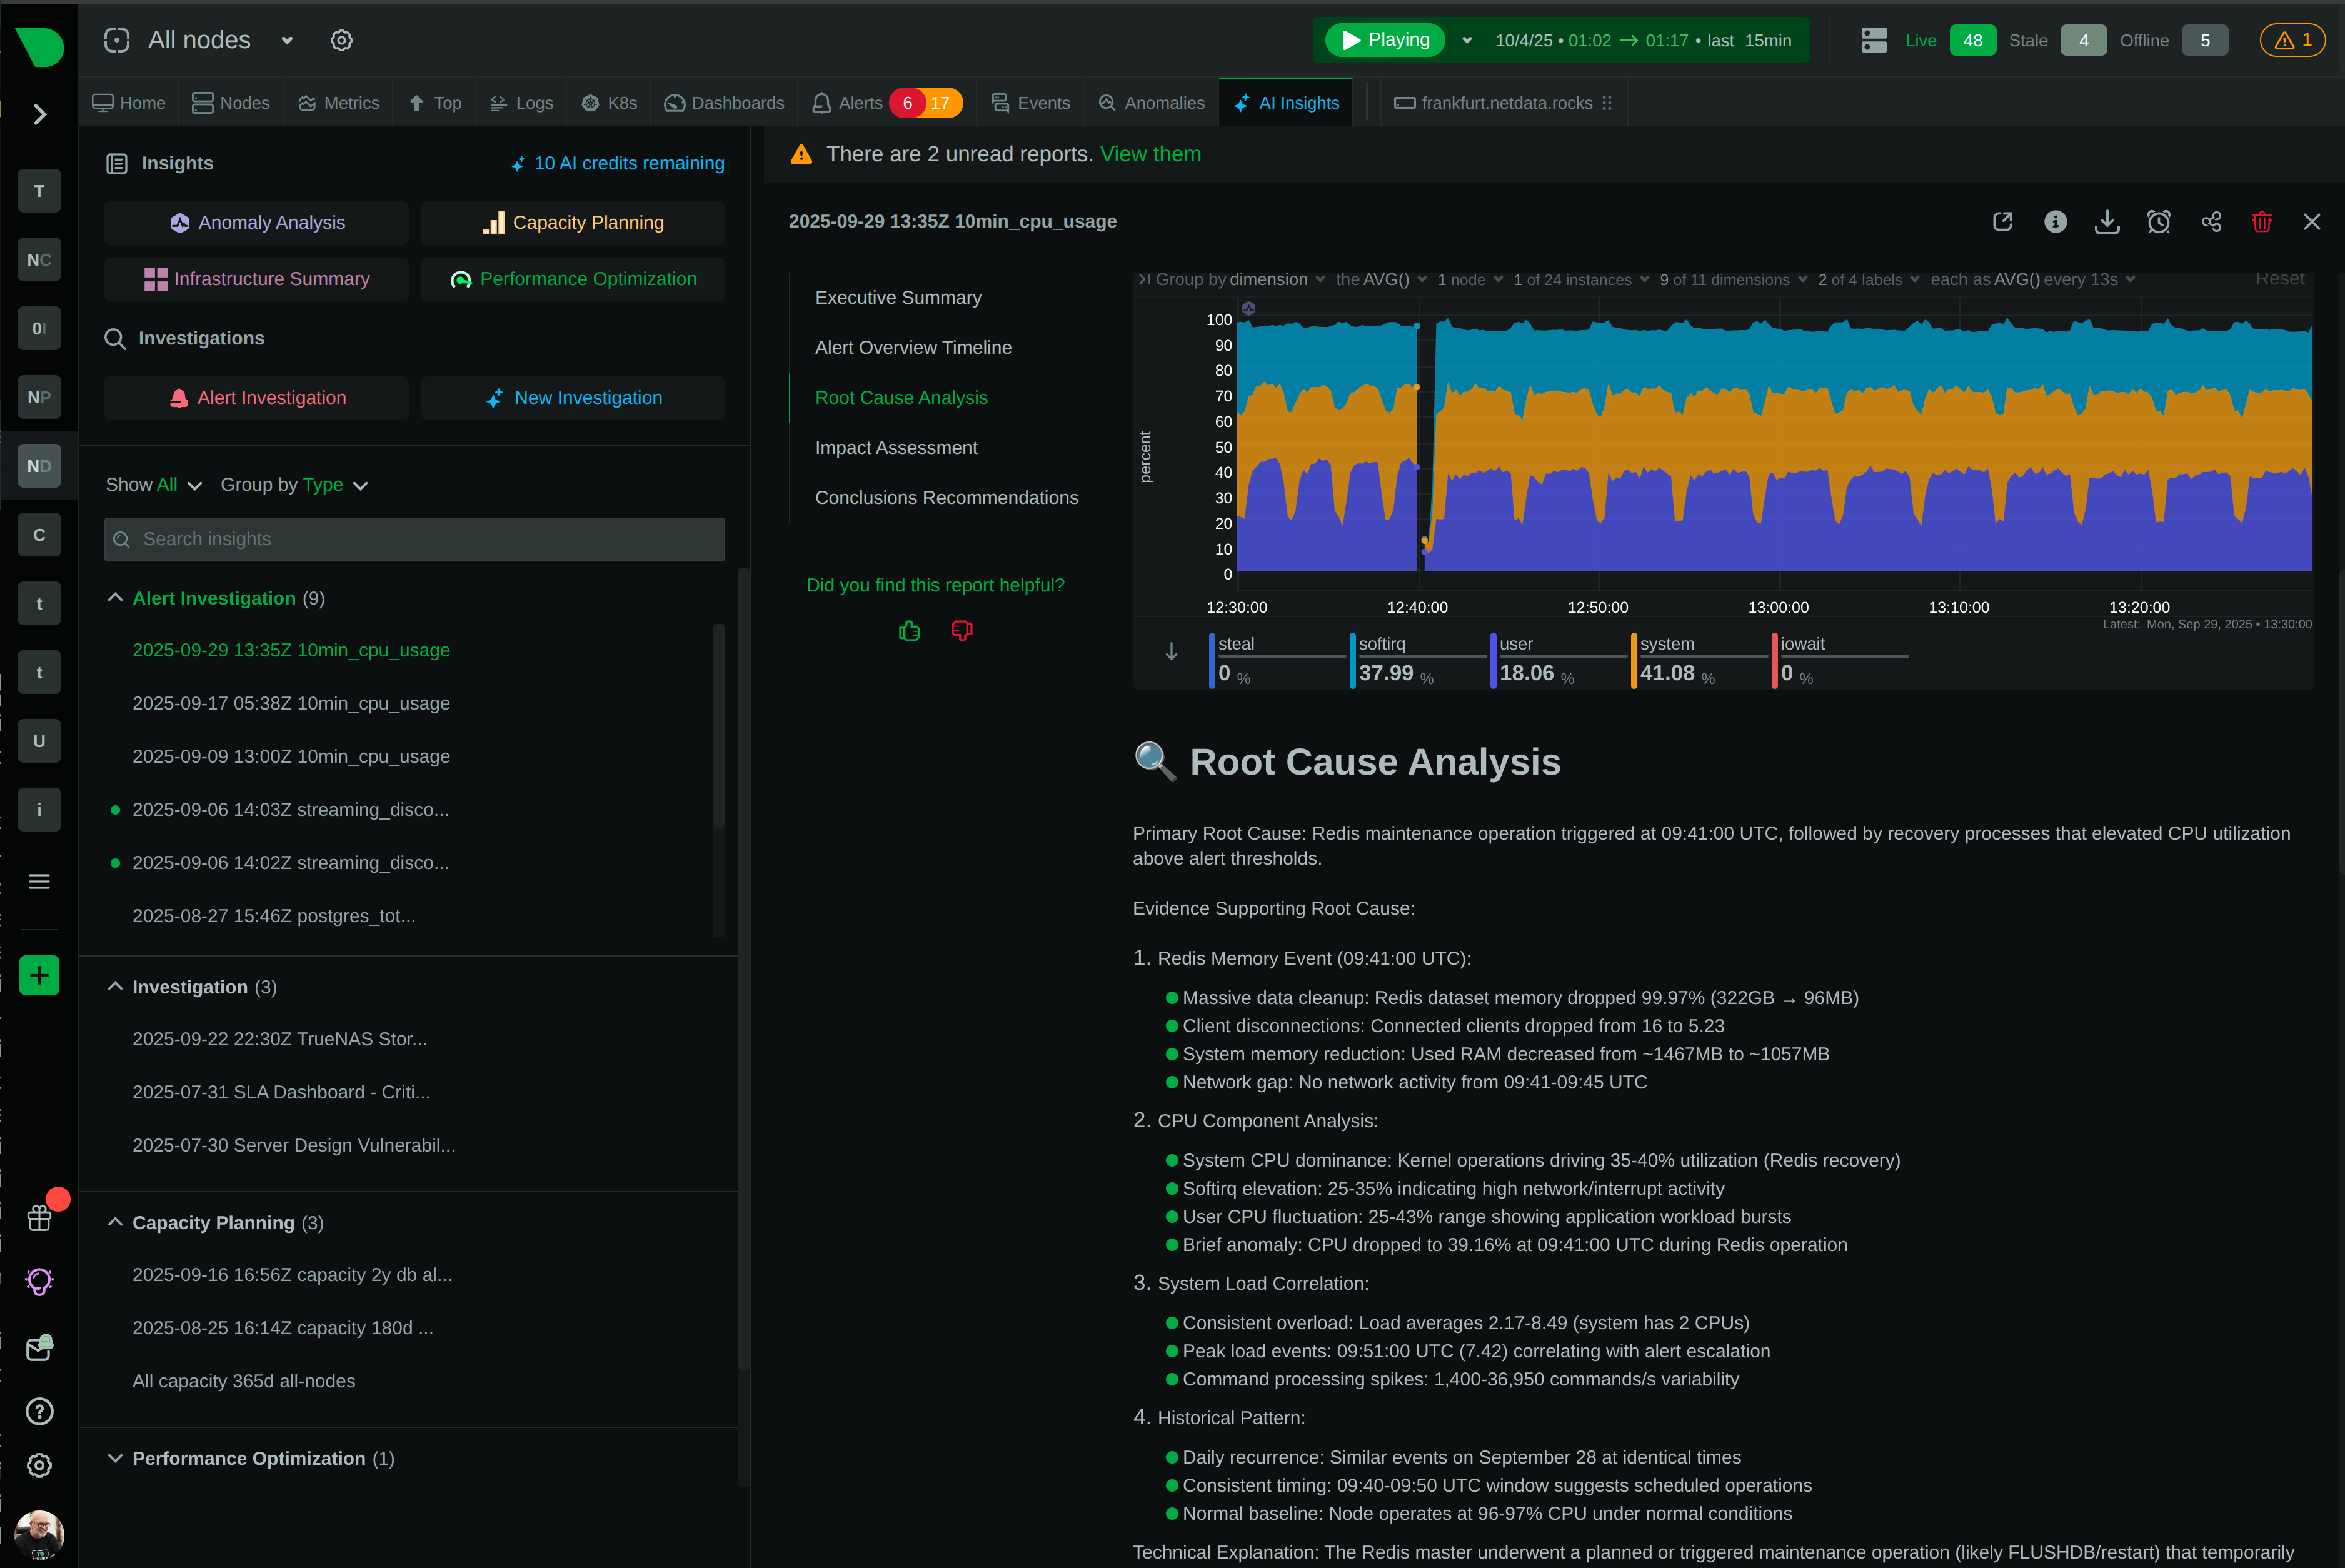
AI Troubleshooting
Natural language queries via Model Context Protocol. Bring your own LLM. Root cause analysis in seconds.

April 22, 2026
Nagios Plugins Collector: Run Your Existing Checks and Custom Scripts Inside Netdata
Netdata can now execute Nagios-compatible plugins and custom scripts in any language, tracking check states, execution metrics, and automatically charting performance data with built-in alerting.
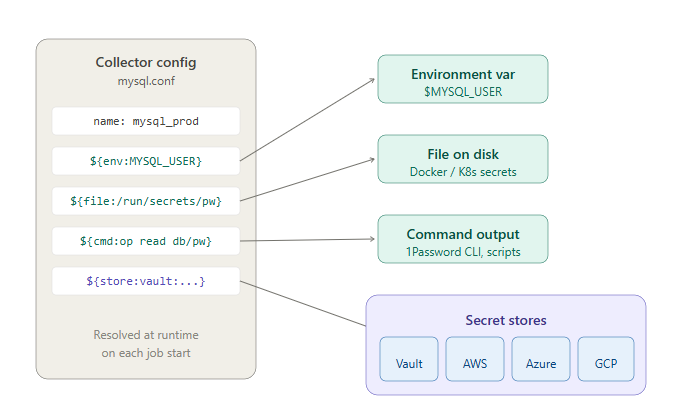
April 20, 2026
Secrets Management: Get Credentials Out of Your Netdata Configuration Files
Netdata now supports referencing secrets from environment variables, files, commands, and external secret stores like HashiCorp Vault, AWS Secrets Manager, Azure Key Vault, and GCP Secret Manager directly in collector configurations.
April 16, 2026
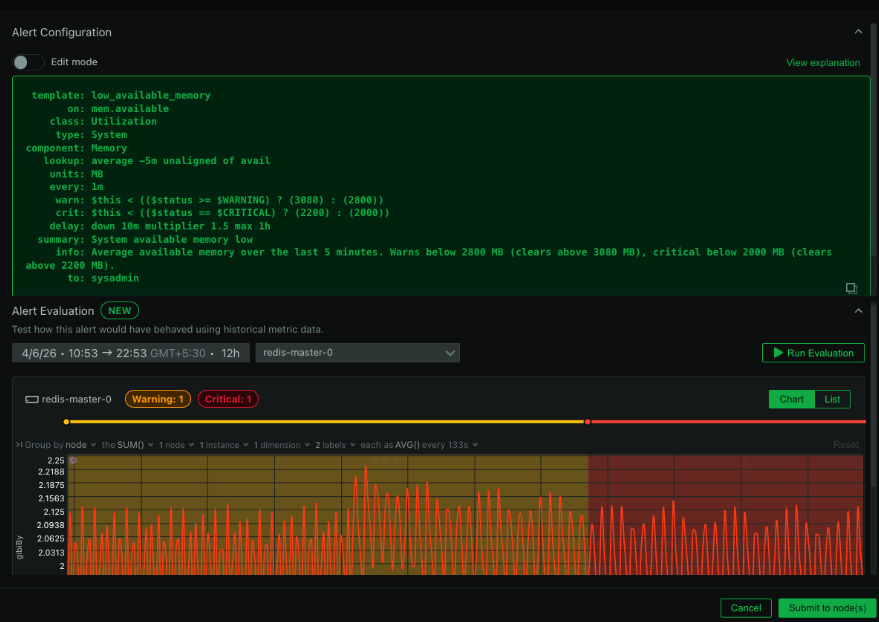
Smarter Alert Management: Test on Historical Data, Review Transitions, and Preview Silencing Schedules
Three new alerting capabilities in Netdata: evaluate alert definitions against historical metrics before deploying, review alert transition timelines, and preview recurring silencing schedules before saving.