
Debug applications with Vercel Observability
vercel logs --environment production --status-code 500 --jsonvercel curl --trace --json /api/hello# Most metrics require Observability Plus
vercel metrics listObservability is available on all plans
You can use Observability on all plans to monitor your projects. Observability Plus is available on Pro and Enterprise teams, providing additional features and metrics, higher limits, and increased retention.
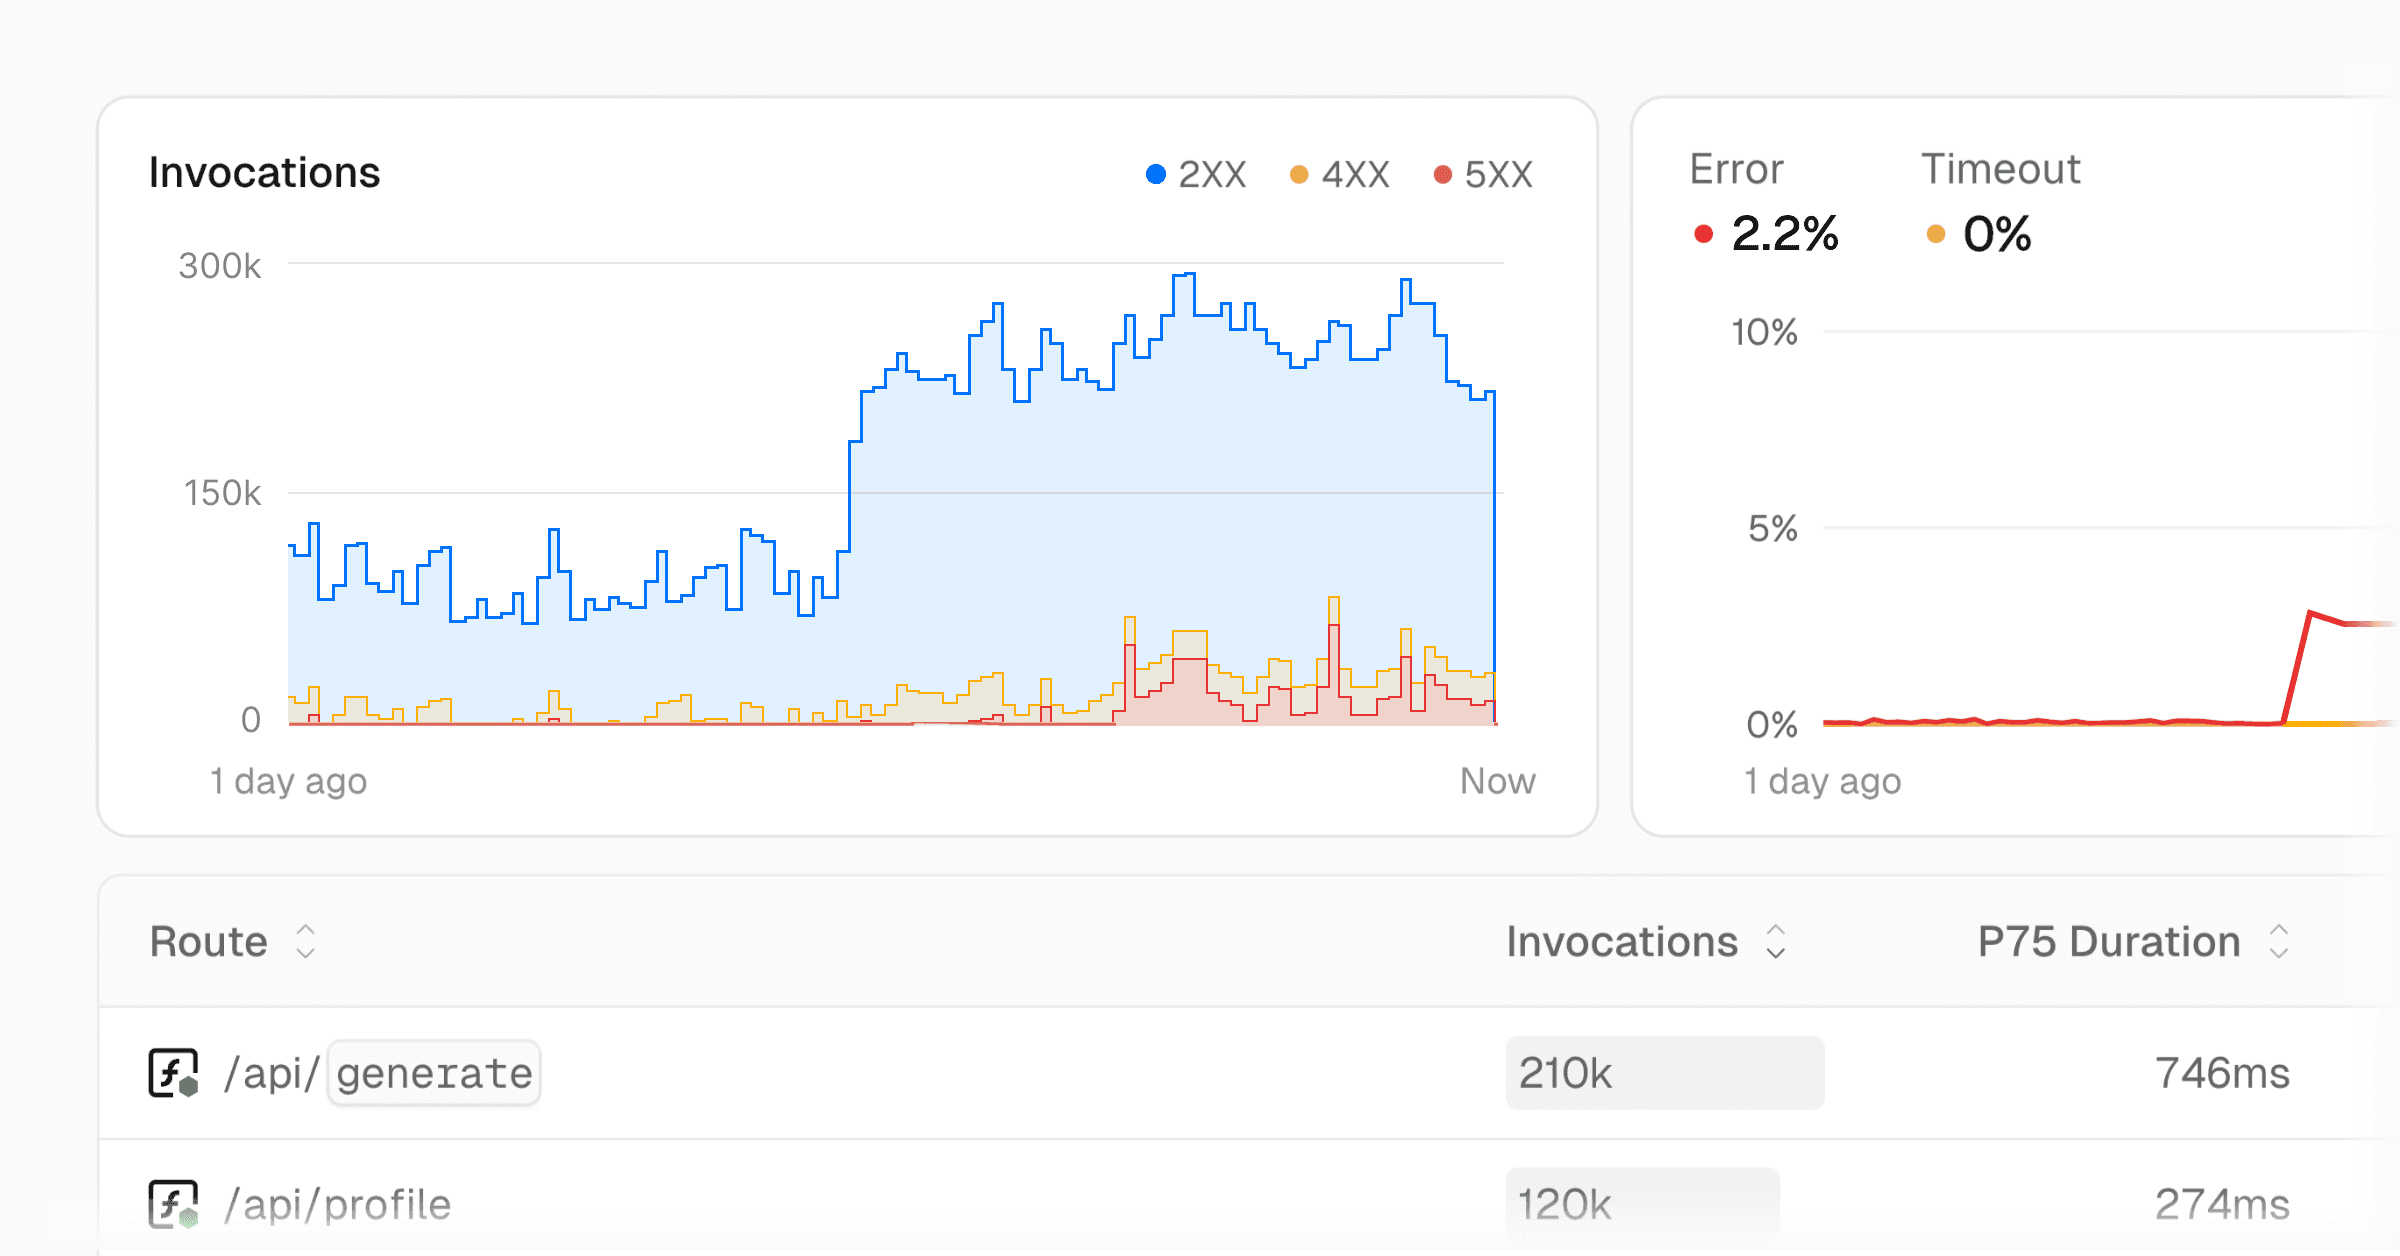
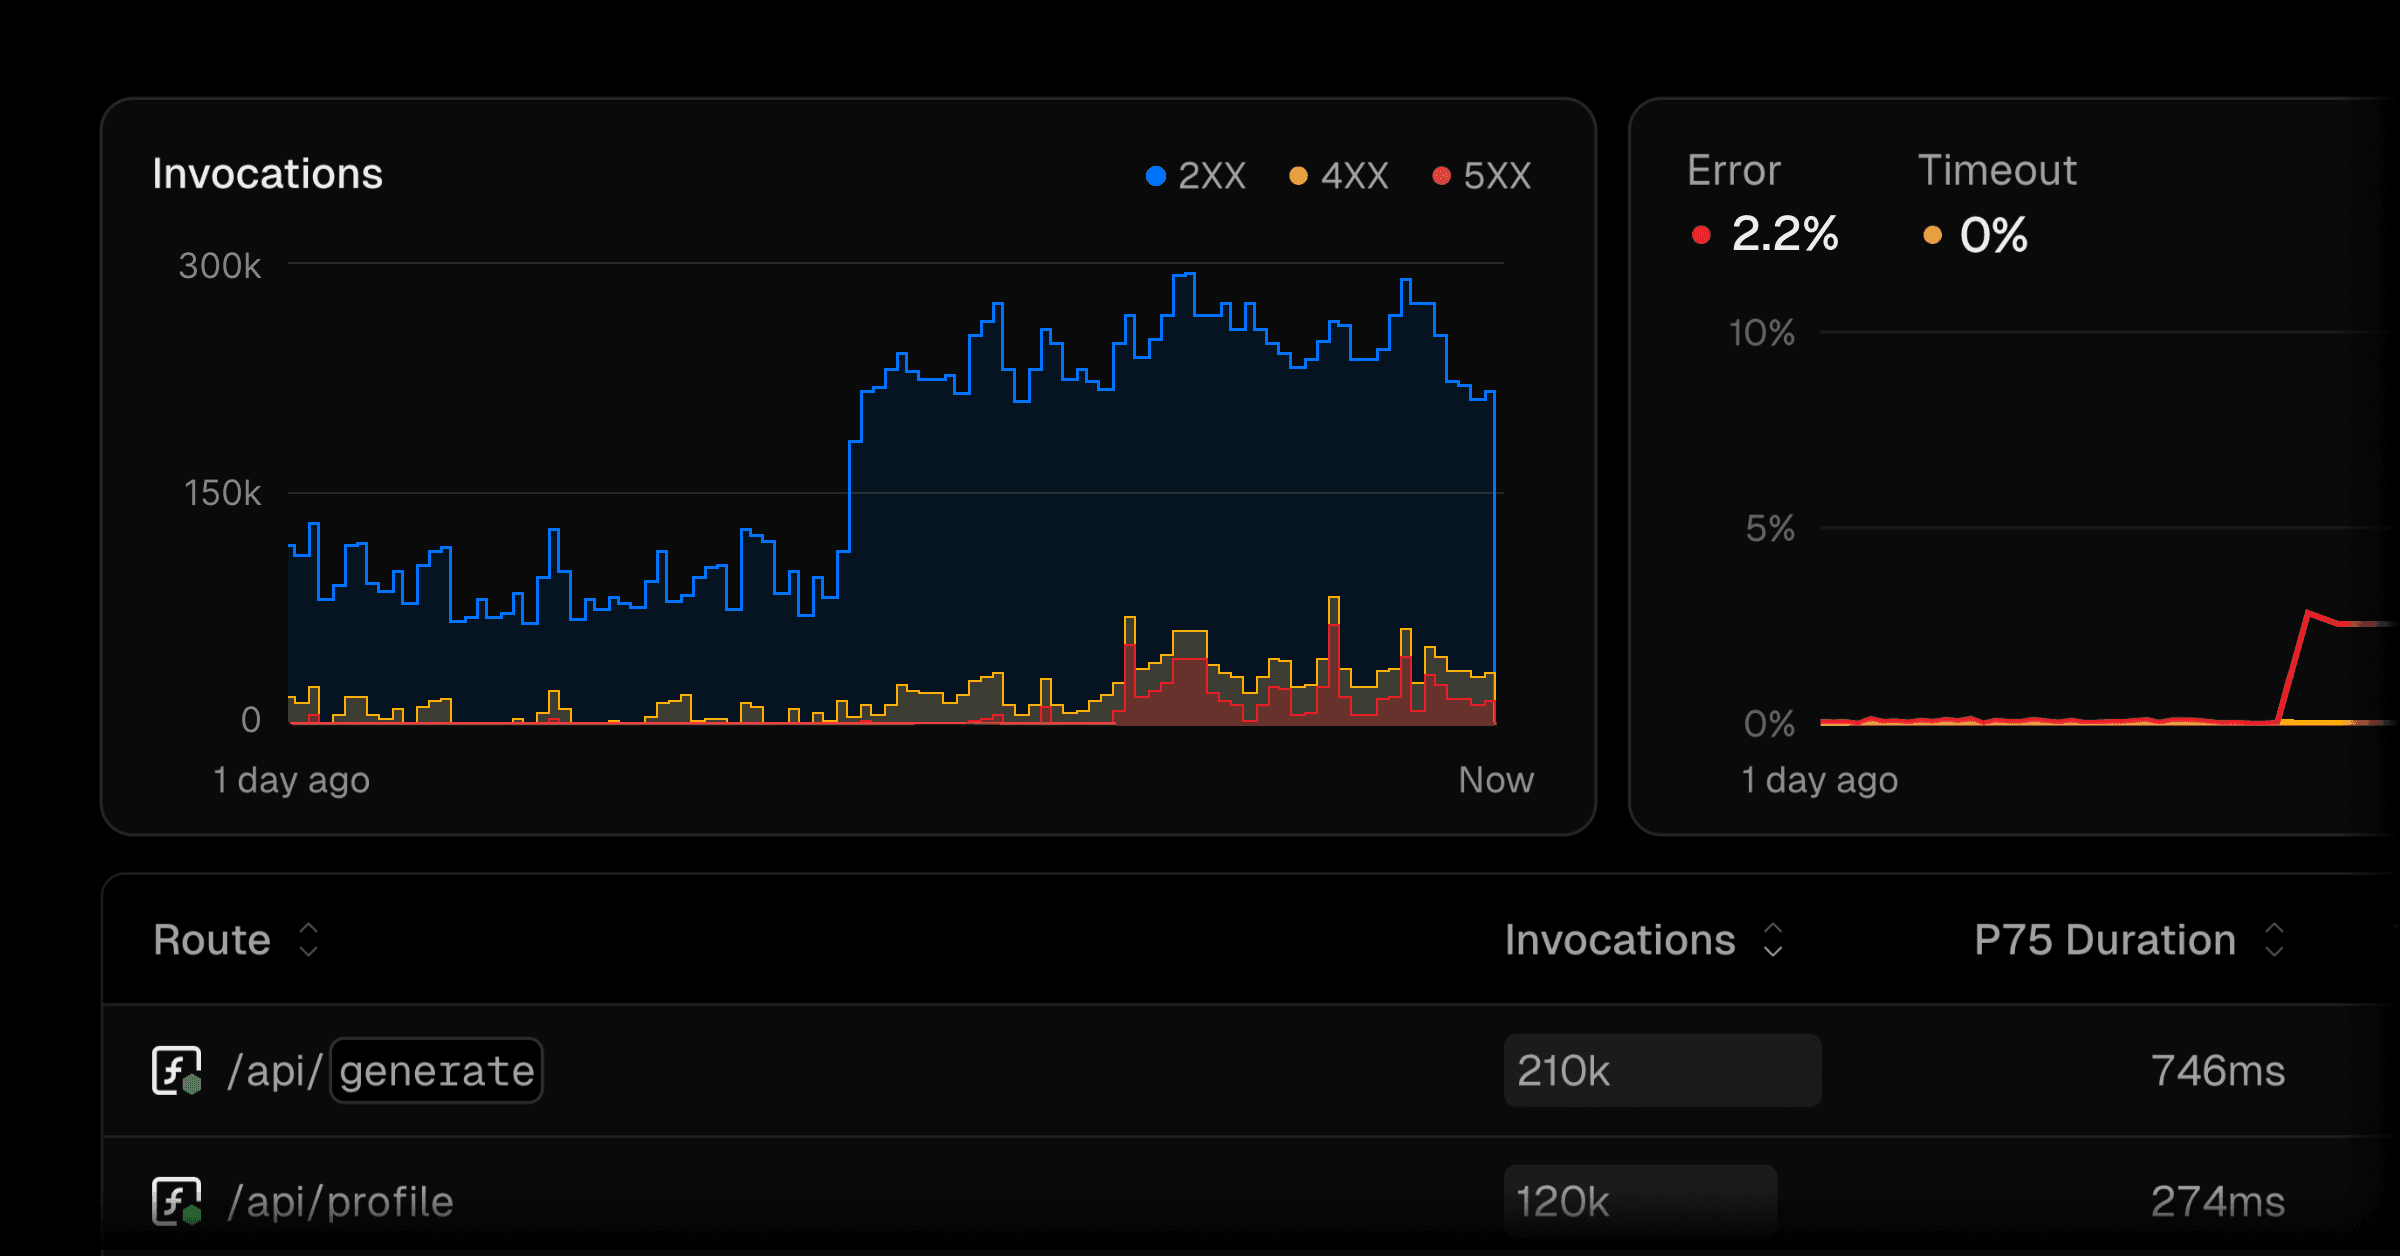
Use logs to find failing requests, traces to inspect one request path, and metrics to compare behavior over time. Use JSON output when a script or coding agent needs structured data.
How you use Observability depends on the needs of your project, for example, perhaps builds are taking longer than expected, or your Vercel Functions seem to be increasing in cost. A brief overview of how you might use the tab would be:
- Decide what feature you want to investigate. For example, Vercel Functions.
- Use the date picker or the time range selector to choose the time period you want to investigate. Users on Observability Plus will have a longer retention period and more granular data.
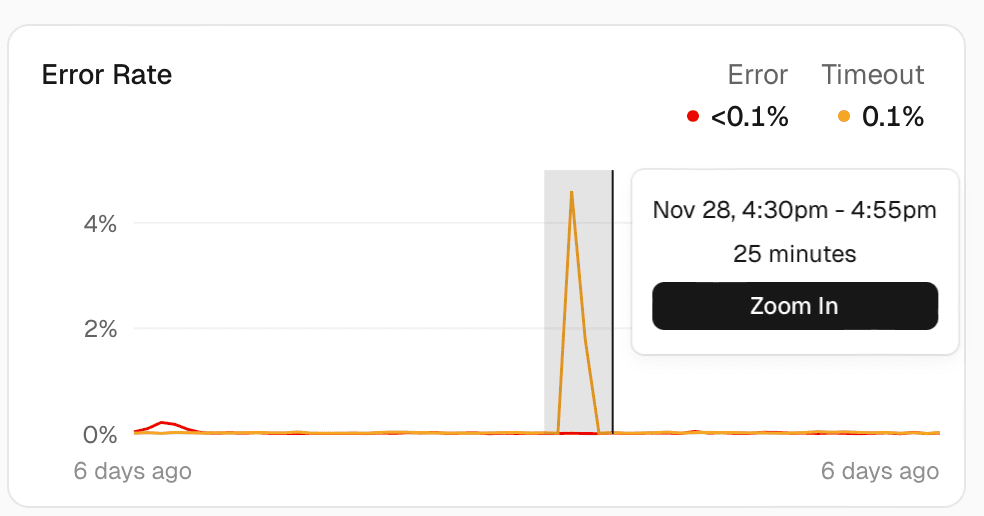
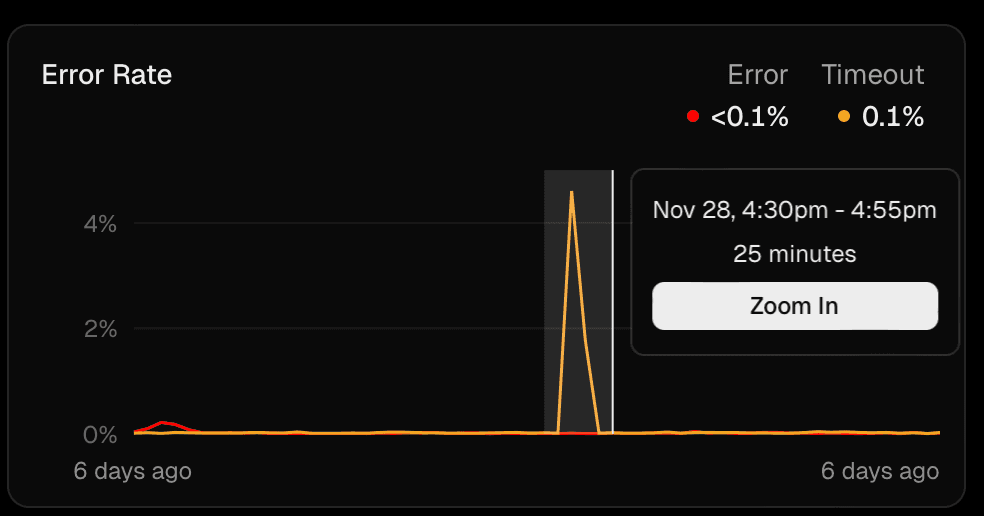
- Let's investigate our graphs in more detail, for example, Error Rate. Click and drag to select a period of time and press the Zoom In button.
- Then, from the list of routes below, choose to reorder either based on the error rate or the duration to get an idea of which routes are causing the most issues.
- To learn more about specific routes, click on the route.
- The functions view will show you the performance of each route or function, including details about the function, latency, paths, and External APIs. Note that Latency and breakdown by path are only available for Observability Plus users.
- The function view also provides a direct link to the logs for that function, enabling you to pinpoint the cause of the issue.
Observability provides different sections of features and traffic sources that help you monitor, analyze, and manage your applications either at the team or the project level. The following table shows their availability at each level:
Vercel tracks the following event types for Observability:
- Edge Requests
- Vercel Function Invocations
- External API Requests
- Routing Middleware Invocations
- AI Gateway Requests
Vercel creates one or more of these events each time a request is made to your site. Depending on your application and configuration a single request to Vercel might be:
- 1 edge request event if it's cached.
- 1 Edge Request, 1 Middleware, 1 Function Invocation, 2 External API calls, and 1 AI Gateway request, for a total of 6 events.
- 1 edge request event if it's a static asset.
Vercel tracks events at the team level, counting them across all projects in the team.
If you've excluded specific projects from Observability Plus, those projects won't generate metered events.
Users on all plans can use Observability at no additional cost, with some limitations. The Observability section in the sidebar is available on the project dashboard for all projects in the team.
Pro and Enterprise teams can use Observability Plus for additional features, higher limits, and increased retention.
You can also manage which projects are included in your Observability Plus subscription to control costs.
For more information on pricing, see Pricing.
For step-by-step debugging workflows using the Vercel CLI with Observability data, see Debugging production 500 errors.
Insights
Inspect requests, functions, middleware, and more.
Observability Plus
Higher limits, additional metrics, and longer retention.
Notebooks
Save and organize Observability queries.
Monitoring
Build dashboards and alerts on top of metrics.
Debug production errors
Step-by-step CLI workflow for debugging 500 errors.
Managing projects
Control which projects are included in Observability Plus.
Was this helpful?
Cross-link map: Observability (/docs/observability)
From the Vercel docs graph (built 2026-09-06T06:25:16.735Z), spanning vercel.com docs + KB, nextjs.org, ai-sdk.dev, and other Vercel documentation sites. Full graph as JSON: https://vercel.com/docs/graph.json
Semantically closest pages
- Observability Plus — Learn about using Observability Plus and its limits.
- Observability Insights — List of available data sources that you can view and monitor with Observability on Vercel.
- Manage and optimize usage for Observability — Learn how to understand the different charts in the Vercel dashboard, how usage relates to billing, and how to optimize
- Vercel Observability is now generally available
- Query — Query and visualize your Vercel usage, traffic, and more in observability.
This page links to (5)
- Notebooks — Learn more about Notebooks and how they allow you to organize and save your queries.
- Debugging production 500 errors — Find, fix, and verify production 500 errors using the Vercel CLI.
- Observability Insights — List of available data sources that you can view and monitor with Observability on Vercel.
- Observability Plus — Learn about using Observability Plus and its limits.
- Monitoring — Query and visualize your Vercel usage, traffic, and more with Monitoring.
Pages that link here (91)
By site: vercel-changelog (25) · vercel-kb (31) · vercel-web (8) · workflow (1) · vercel-docs (26)
From vercel-changelog
- AI query prompting now available in Observability Plus
- Anomaly alert configuration now available
- Create and share queries with notebooks in Vercel Observability
- Edge Function metrics now available in Monitoring
- Enhanced firewall data now available in Monitoring
- Expanded search for workflow runs in Vercel Observability
- Generate shareable snapshots of Observability charts
- Improved metrics search in Observability Plus
- Microfrontends now generally available
- Middleware insights now available in Vercel Observability
- Monitoring pricing reduced up to 87%
- New custom visualization in Vercel Observability
- Observability added to AI Gateway alpha
- Observability for Edge Requests now includes more traffic parameters
- One-click linking from Usage to Vercel Observability dashboards
- Overview page in Observability
- Pull anomaly alert details using the Vercel CLI
- Query and visualize workflow data in Vercel Observability
- Query data on external API requests in Vercel Observability
- Redirects and rewrites now available in Observability
- Run and share custom queries in Observability Plus
- Observability for Vercel Functions now offers a quick-view of key insights
- Vercel Observability is now generally available
- Vercel Observability is now route-aware for SvelteKit apps
- View & query bot verification data in Vercel Observability
From vercel-kb
- How to architect an AI evaluation dashboard on Vercel — Map eval orchestration, traces, and run storage to AI Gateway, Observability, and Marketplace Postgres, and learn when s
- How to prepare your storefront for Black Friday traffic — A practical checklist for keeping your storefront fast and your checkout path healthy through Black Friday and Cyber Mon
- Connect Next.js to Amazon Aurora PostgreSQL using Vercel Marketplace — Learn how to connect your Next.js application to Amazon Aurora PostgreSQL securely using the Vercel Marketplace AWS inte
- Debug routing on Vercel — Learn how to debug how Vercel decides where to route your request
- Running Docker on Vercel — Learn how to run Docker on Vercel by deploying OCI container images as Vercel Functions, storing them in Vercel Containe
- Build an incident response sre agent with eve — sre is an incident response agent for Slack. It investigates production issues using a hypothesis-driven approach and re
- Hosting your API on Vercel — Learn how to build and scale performant APIs on Vercel.
- How do I lower my Vercel Function execution time? — Learn how to lower your Serverless Function execution time.
- Building AI apps on Vercel: an overview — Learn the key AI concepts and tools for building and scaling AI apps.
- How to Optimize Next.js + Sitecore JSS — This guide covers performance and usage considerations when building and deploying your Next.js and Sitecore JSS applica
- How to Optimize RSC Payload Size — Learn how to use React Server Components efficiently in Next.js to reduce cost and improve performance
- How to Utilize Vercel’s Bot Management Features — A practical, step-by-step guide to identifying unwanted automated traffic and securing your Vercel apps with Bot Protect
- How can I improve function cold start performance on Vercel? — Learn how to confirm whether cold starts cause function latency on Vercel, and how Fluid compute reduces how often they
- Incremental Migrations with Microfrontends — Learn how to migrate legacy applications using microfrontends
- Investigate latency issues and slowness on Vercel — Learn how to use Observability to investigate latency issues and slowness on Vercel.
- Translate Kubernetes manifests to vercel.json — Translate Kubernetes Deployments, Services, Ingress, ConfigMaps, and CronJobs into vercel.json configuration and Vercel
- Migrate self-hosted Next.js and containers from AWS to Vercel — Migrate containers from AWS to Vercel: deploy with Dockerfile.vercel, keep RDS, S3, and SQS in AWS over OIDC, and cut ov
- Troubleshoot and optimize Active CPU usage on Fluid compute — Diagnose which routes drive Active CPU usage and learn to optimize it. Separate traffic growth from per-request CPU work
- Production architecture for a RAG chatbot on Vercel — Architect a production RAG chatbot on Vercel Functions with Fluid compute, AI Gateway, and a region-pinned vector store.
- How to ship an H3 app on Vercel — Deploy an H3 app to Vercel with zero configuration. Learn to configure streaming, middleware, cron jobs, the Bun runtime
- How to ship a Koa app on Vercel — Deploy a Koa app to Vercel with zero configuration. Learn how to ship from the Vercel CLI or Git, and configure response
- How to ship a NestJS app on Vercel — Deploy a NestJS app to Vercel with zero configuration. Learn how to ship from a template, the Nest CLI, or Git, and conf
- Troubleshooting Build Error: "Build step did not complete within the maximum of 45 minutes" — Learn common reasons Vercel builds hit the 45-minute limit and how to reduce build times so your deployments stay fast a
- Troubleshooting Builds Failing with SIGKILL or Out of Memory Errors — Learn how to troubleshoot builds failing with SIGKILL or Out of Memory errors on a Vercel Deployment.
- Understand the Cost Impact of Function Invocations — Learn how to use Observability to understand function invocations and their cost impact.
- Using Vercel as a Standalone CDN — Use Vercel's external rewrites to proxy and cache content from external websites or APIs through Vercel's global edge ne
- Does Vercel support Kubernetes? — Vercel doesn't run Kubernetes clusters. Learn how Kubernetes workloads like Deployments, Ingress, ConfigMaps, and CronJo
- Vercel vs Kubernetes — Compare Vercel and Kubernetes on operational ownership, deployment workflow, scaling, and cost model to decide which pla
- Build a Weather API on Vercel: Express, FastAPI, and Nitro — Build a weather API on Vercel with FastAPI, Express, or Nitro. Compare the three runtimes, add caching and Observability
- How to Build a Weather API with Nitro and Vercel — Provide real-time weather data to apps and websites with a single Nitro route, Vercel cache storage, and Observability.
- How to stop Vercel Functions from timing out — Vercel Functions that time out usually trace back to a few causes. Learn how Fluid Compute fixes most of them and how to
From vercel-web
- Agentic Infrastructure
- How to integrate AI into your business
- How we’re adapting SEO for LLMs and AI search
- Protecting your app (and wallet) against malicious traffic
- Headless Salesforce: An incremental migration from monolith to composable
- The AI Cloud: A unified platform for AI workloads
- Next.js 16.3 support on Vercel
- Vercel Pricing — Choose a Vercel plan and compare features and usage pricing.
From workflow
- Step executed multiple times — Diagnose duplicate step_started events caused by function timeouts, OOMs, or network issues.
From vercel-docs
- Bot Management — Learn how to manage bot traffic to your site.
- vercel project — Perform the following commands from the terminal for your Vercel Projects: list, add, inspect, update settings, rename,
- eve — Build and deploy durable backend AI agents with eve, an open-source, filesystem-first framework.
- Observability — View agent runs in the Vercel dashboard with no setup, and optionally export AI SDK spans through OpenTelemetry.
- Nitro on Vercel — Deploy Nitro applications to Vercel with zero configuration. Learn about observability, ISR, and custom build configurat
- Create React App on Vercel — Deploy Create React App projects to Vercel and add Preview Deployments, Web Analytics, Speed Insights, and Observability
- Vite + Nitro on Vercel — Add a backend to any Vite app with Nitro and deploy to Vercel with zero configuration.
- Container Images — Deploy OCI container images with a Dockerfile or Containerfile on Vercel Functions.
- Debugging slow Vercel Functions — Diagnose and fix slow Vercel Functions using CLI tools, logs, and timing analysis.
- Integrating Vercel and Kubernetes — Deploy your frontend on Vercel alongside your existing Kubernetes infrastructure.
- Limits — Look up account limits, usage summaries, rate limits, and resource constraints for every Vercel plan.
- Manage and optimize usage for Observability — Learn how to understand the different charts in the Vercel dashboard, how usage relates to billing, and how to optimize
- Testing & troubleshooting microfrontends — Learn about testing, common issues, and how to troubleshoot microfrontends on Vercel.
- Debugging production 500 errors — Find, fix, and verify production 500 errors using the Vercel CLI.
- Observability Plus — Learn about using Observability Plus and its limits.
- Account Plans on Vercel — Learn about the different plans available on Vercel.
- Vercel Enterprise Plan — Learn about the Enterprise plan for Vercel, including features, pricing, and more.
- Pricing on Vercel — Learn about Vercel's pricing model, including the resources and services that are billed, and how they are priced.
- Products — Browse Vercel products for building, deploying, securing, observing, and scaling web applications.
- Projects overview — A project is the application that you have deployed to Vercel.
- Monitoring Quickstart — In this quickstart guide, you'll discover how to create and execute a query to visualize the most popular posts on your
- Routing Middleware — Learn how you can use Routing Middleware, code that executes before a request is processed on a site, to provide speed a
- Vercel Documentation Sitemap — Browse Vercel documentation pages with summaries, prerequisites, and topics.
- Session tracing — Learn how to trace your sessions to understand performance and infrastructure details.
- Vercel Blob — Vercel Blob is a scalable, cost-effective object storage service with private and public access modes for files up to 5
- Workflow Pricing and Limits — Understand how Vercel Workflows billing works and the limits that apply to runs, streams, and platform resources.