




 Live
Real-Time Functions, Executed on Your Nodes
The Live tab gives you real-time access to Netdata Functions - specialized routines provided by collectors that deliver live information from your monitored nodes. Process explorers, database monitoring, network topology maps, diagnostics, and troubleshooting actions - all from your browser.


What the Live Tab Gives You
Real-time functions executed directly on your nodes

Process Explorer
Browser-based replacement for top, htop, and ps. Sort, filter, and group processes with full historical data and ML context.

Database Monitoring
Top Queries on 12 engines, including PostgreSQL, MySQL, SQL Server, Oracle, ClickHouse, MongoDB, CockroachDB, Elasticsearch and Redis. See which queries consume the most resources.
Network Topology
Active network connections ranked by bandwidth with connection states, protocols, and traffic statistics.

Systemd Services
All systemd units with resource metrics. Track service CPU, memory, and I/O without manual configuration.
Automatic Discovery
Every process, container, and service tracked from the moment it starts. Zero configuration, zero blind spots.

Diagnostic Actions
Retrieve extra diagnostic information and perform troubleshooting actions directly on the node - all from your browser.
Trusted by operations teams worldwide








































What You Can Do With the Live Tab
Debug Production Without SSH Access
top, htop, and ps with browser-based visibility. Sort by any metric, filter by category or user, and see historical data - not just current state. Give operations teams console-quality insights without infrastructure access.80% MTTR reduction
Learn about Troubleshooting

Monitor Database Query Performance
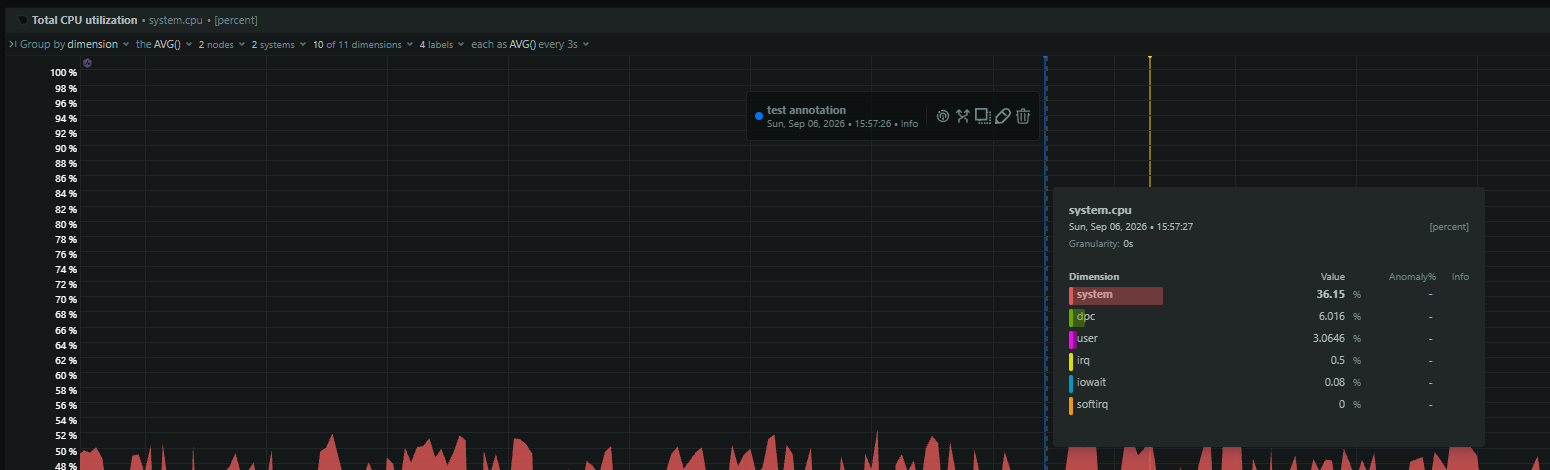
Per-second query insights
View Database Monitoring
Monitor Every Container and Pod
Zero-config Kubernetes monitoring
View Kubernetes Integration

Accelerate Incident Response with ML
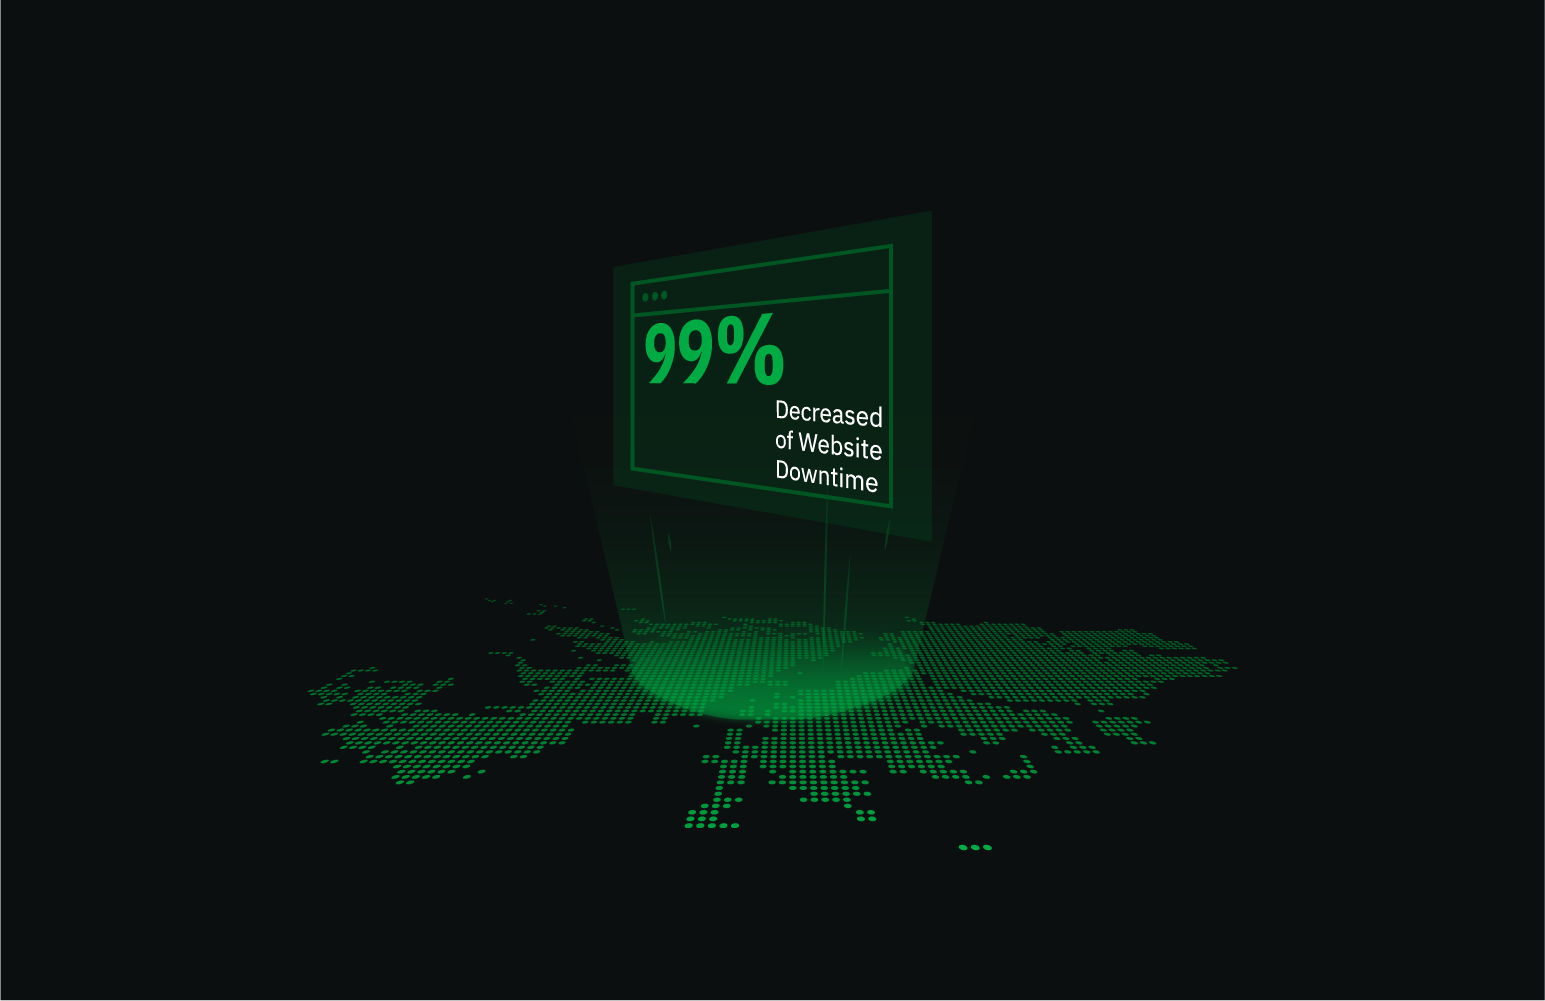
99% false positive reduction
Discover Anomaly Advisor


Why Netdata Wins
Live Tab: Netdata vs Traditional Monitoring
See how Netdata’s Live tab transforms troubleshooting from complex queries to instant insights
Capability
Netdata
Traditional Monitoring
Query Language Required
None
Point-and-click interactive dropdowns
PromQL/SQL Required
Complex syntax for simple questions
Time to First Insight
One-Line Install
Dashboards as soon as data is collected
Hours to Weeks
Configuration and dashboard building required
Data Granularity
Per-Second
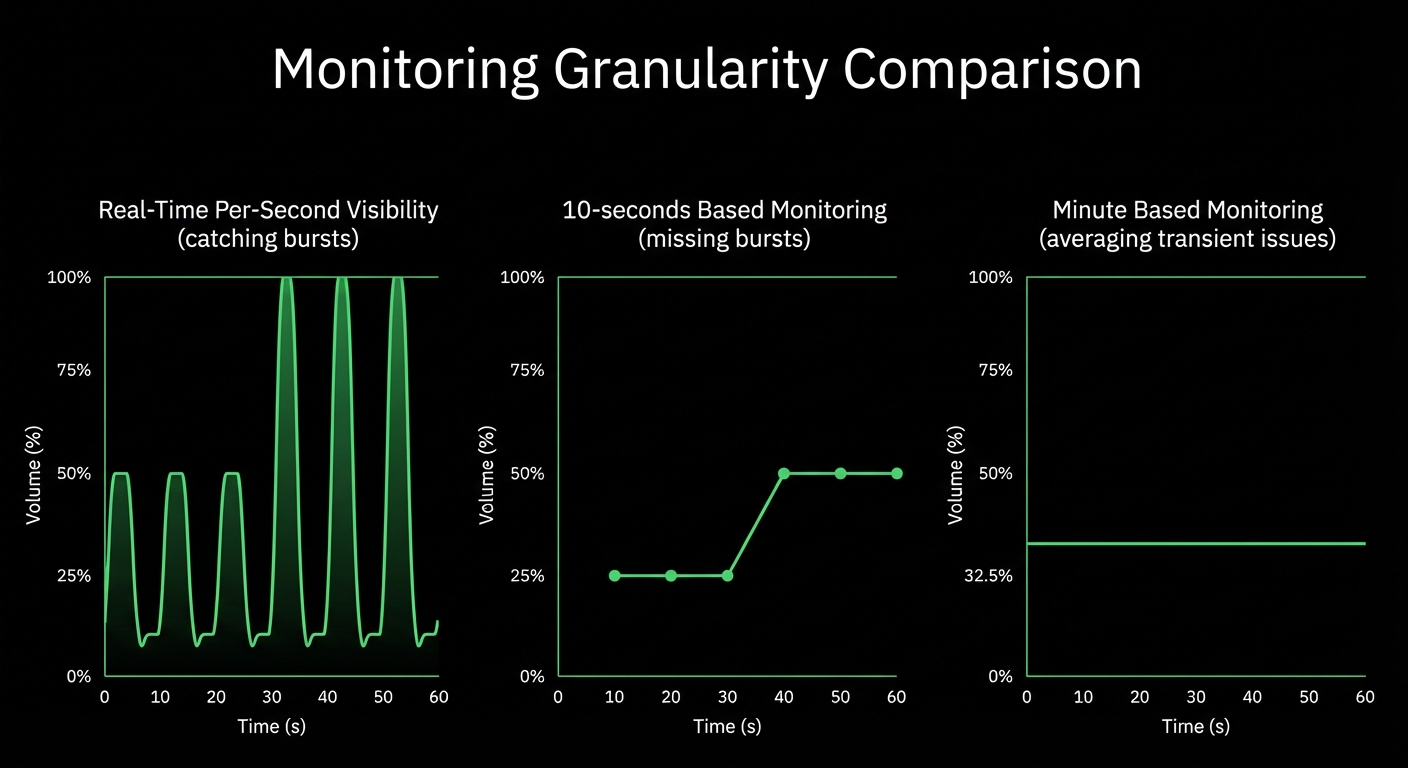
Captures microbursts and transient spikes
Per-Minute
Averages hide critical patterns
Process Tracking
Automatic
Every PID discovered and grouped
Manual Config
Requires agent configuration
Container Monitoring
Native Integration
Zero-config Kubernetes support
Separate Tools
Additional components required
ML Anomaly Detection
Included
18 models per metric, automatic
Paid Add-On
Extra cost or not available
Live Functions on Nodes
Yes
Process explorer, top queries, network topology
No
SSH required for live diagnostics
Historical Process Data
Full History
See what happened during incidents
Current State Only
SSH tools show live data only
Pricing Model
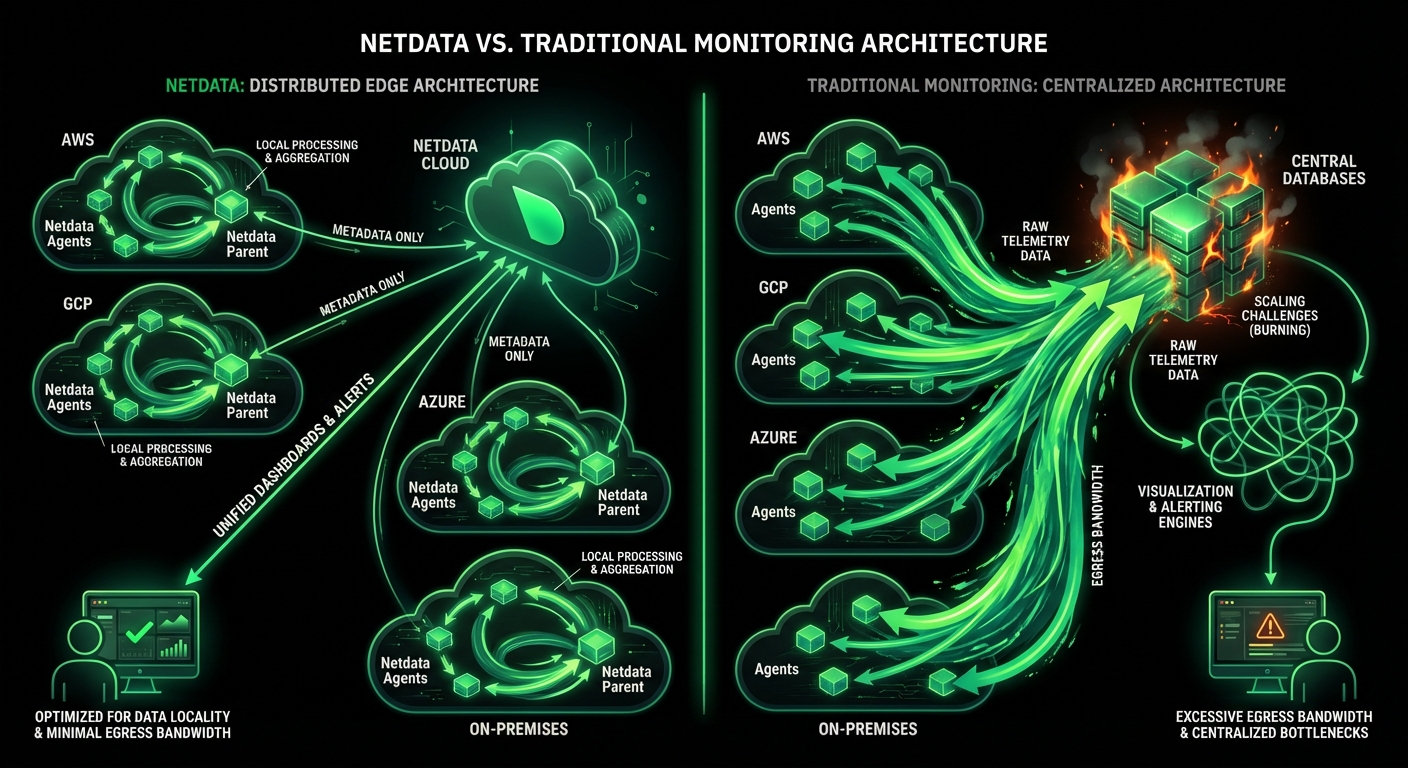
Flat Per-Node
No per-metric charges
Volume-Based
Costs increase with data collected
Total Cost of Ownership
90% Cost Reduction
Predictable and transparent pricing
Exponential Scaling
Costs grow with metrics volume
Live Functions Across Your Stack
Console-Quality Process Explorer
Browser-based process explorer with sorting, filtering, and historical data. Replaces SSH and console tools with team-friendly collaboration.
Real-time process intelligence
Explore Integrations


Key Capabilities
Everything the Live tab puts at your fingertips

Automatic Discovery
Every process, container, and service tracked from creation without configuration or manual setup.

Intelligent Grouping
Thousands of PIDs organized into meaningful application categories with accumulated metrics from process families.

ML Anomaly Detection
Eighteen unsupervised models per metric achieve 99% false positive reduction through consensus-based detection.

Query-Less Analysis
Interactive dropdowns with real-time statistics enable sorting and filtering without learning query languages.

Cross-Stack Correlation
Automatic correlation from Kubernetes cluster to specific PID reveals complete root cause paths.

Per-Second Precision
Capture microbursts and transient spikes that minute-averaging hides with true real-time monitoring.

Historical Visibility
See what happened during incidents with full historical data, not just current state snapshots.

Predictable Costs
Per-node pricing with no per-metric charges eliminates anxiety about collecting comprehensive data.

Top Queries
Database query performance across 12 engines, from PostgreSQL and MySQL to MongoDB and Redis - sorted by CPU, I/O, time.

Deadlock Detection
Real-time deadlock metrics and graphs for SQL Server, PostgreSQL, and MySQL with immediate alerts.

Query Error Attribution
Track query errors and failures with attribution to specific queries and error types.

October 5, 2026
Distributed Tracing In Netdata: OpenTelemetry Traces
Netdata now ingests OpenTelemetry traces over OTLP on the same Agent that collects your metrics and logs. Spans are stored and indexed on your own infrastructure and explored in the new Traces tab in Netdata Cloud.

October 3, 2026
Who Built This Dashboard, and Are They Still Here?
Your server monitoring dashboard shouldn't be a DIY project. Netdata charts every metric automatically — no query languages, no dashboards to build, ever.
September 8, 2026
Infrastructure Knowledge For AI Root Cause Analysis
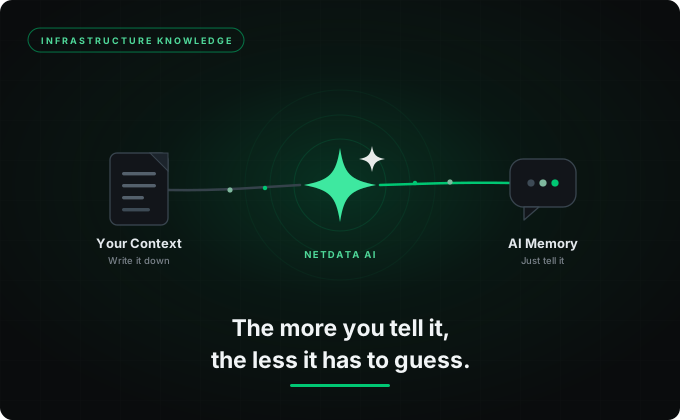
Netdata AI now learns your infrastructure the way a new SRE would: a shared context document your team writes, and a memory layer built from conversations that gets more accurate every time you use it.