




 Netdata vs KloudFuse
Deploy Observability with One Command, Not Days
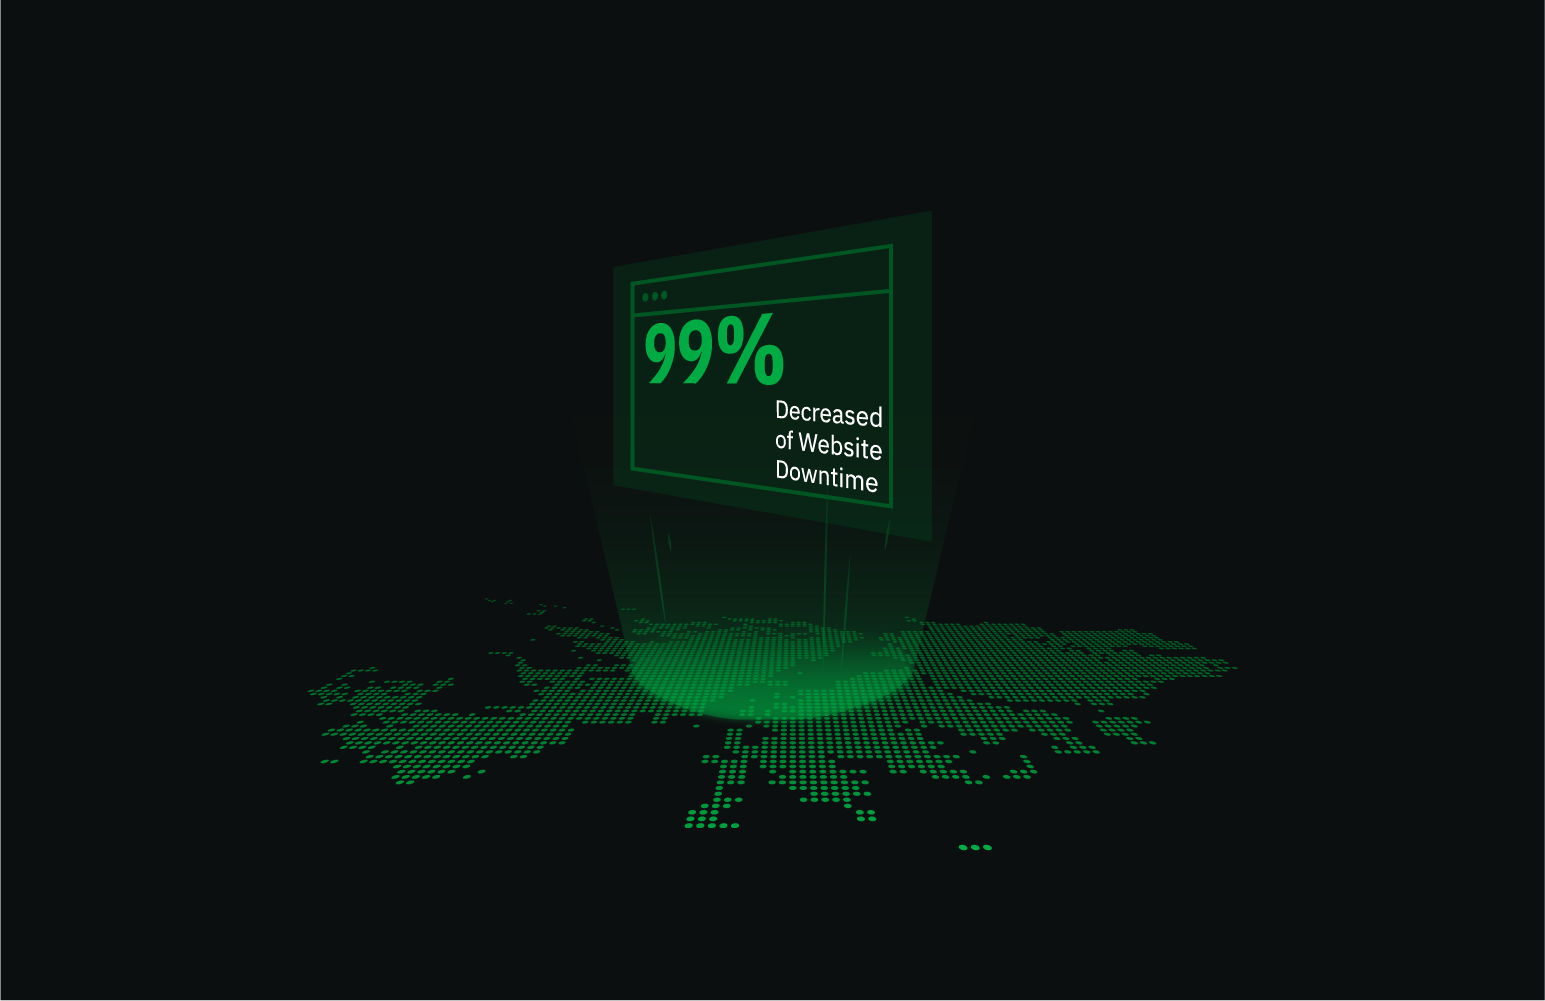
Experience true real-time monitoring with per-second granularity and zero operational overhead. While KloudFuse requires Kubernetes expertise and days of configuration, Netdata delivers instant infrastructure visibility, with logs and OpenTelemetry traces on the same agents, that scales effortlessly from 1 to 100,000+ nodes.


Why Operations Teams Choose Netdata
Transform your monitoring experience

One-Line Install
One-line install delivers instant visibility. No Kubernetes clusters, no Helm charts, no days of configuration - just immediate operational insights.

True Per-Second Monitoring
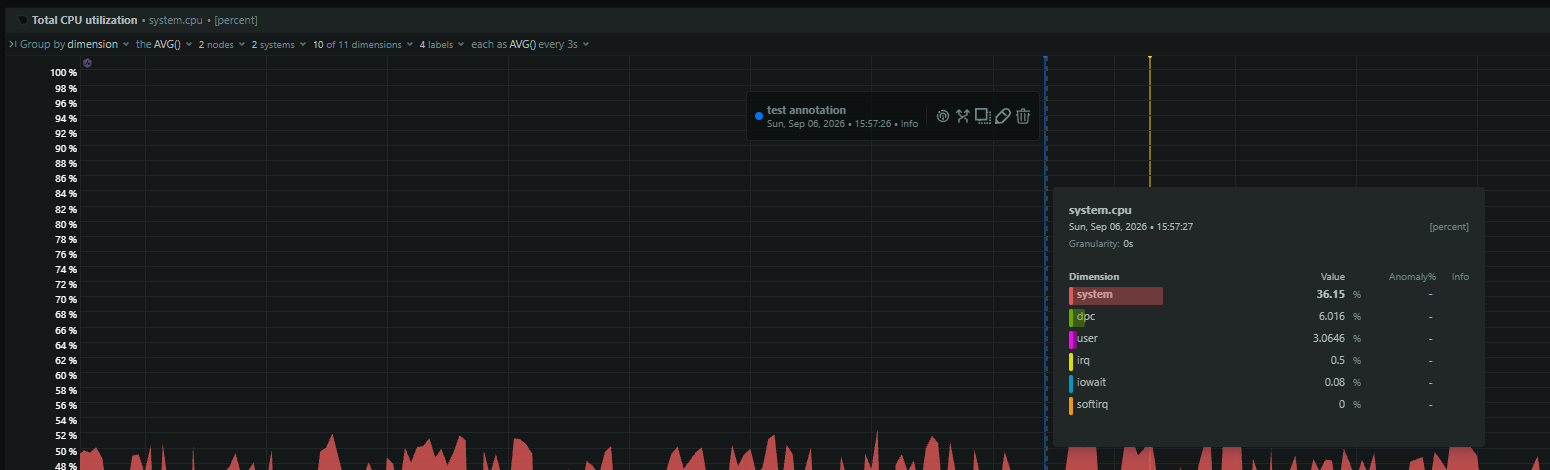
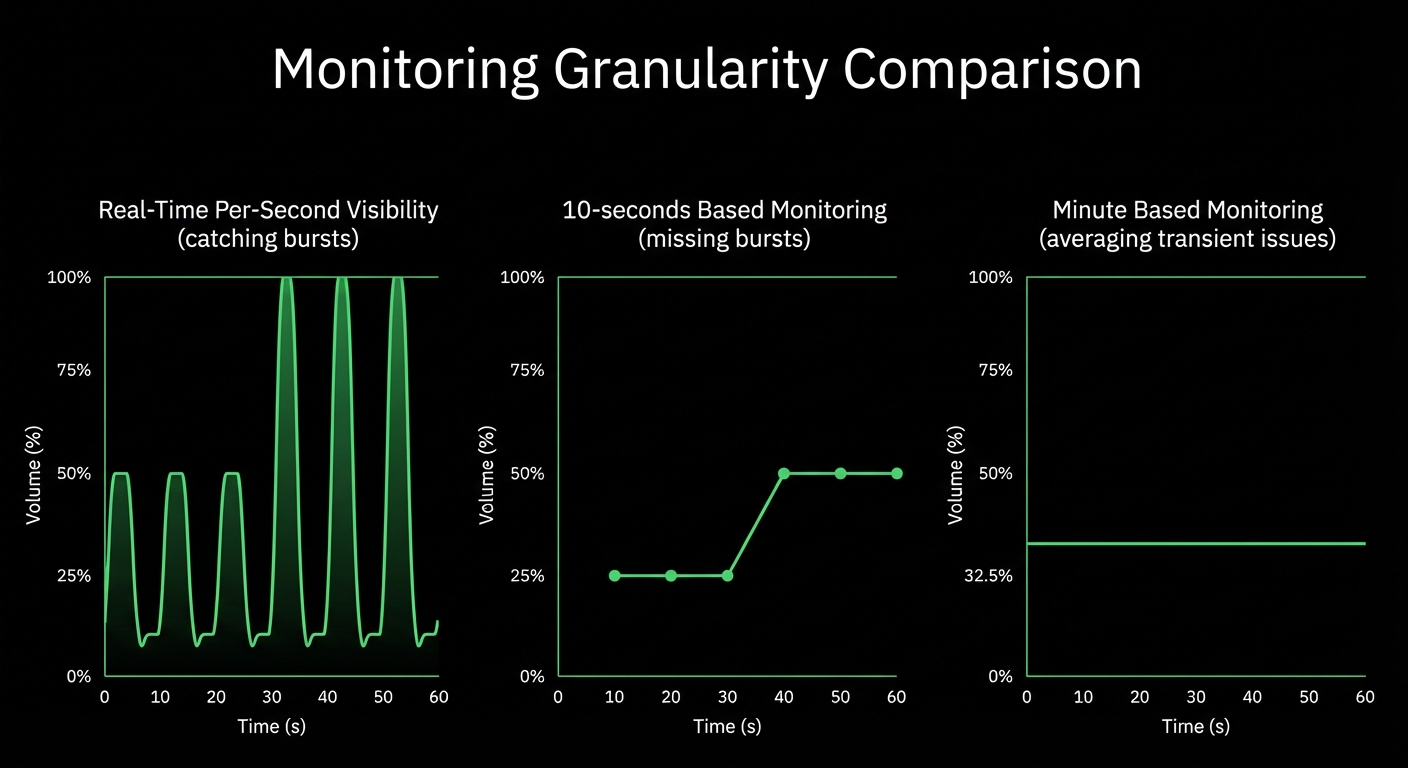
Capture every anomaly with 1-second granularity. While KloudFuse’s 15-60 second sampling misses transient issues, Netdata sees everything in real-time.

AI-Powered Intelligence
18 ML models per metric detect anomalies automatically with 99% false positive reduction. AI Conversations and automated root cause analysis accelerate troubleshooting by 80%.

Transparent Economics
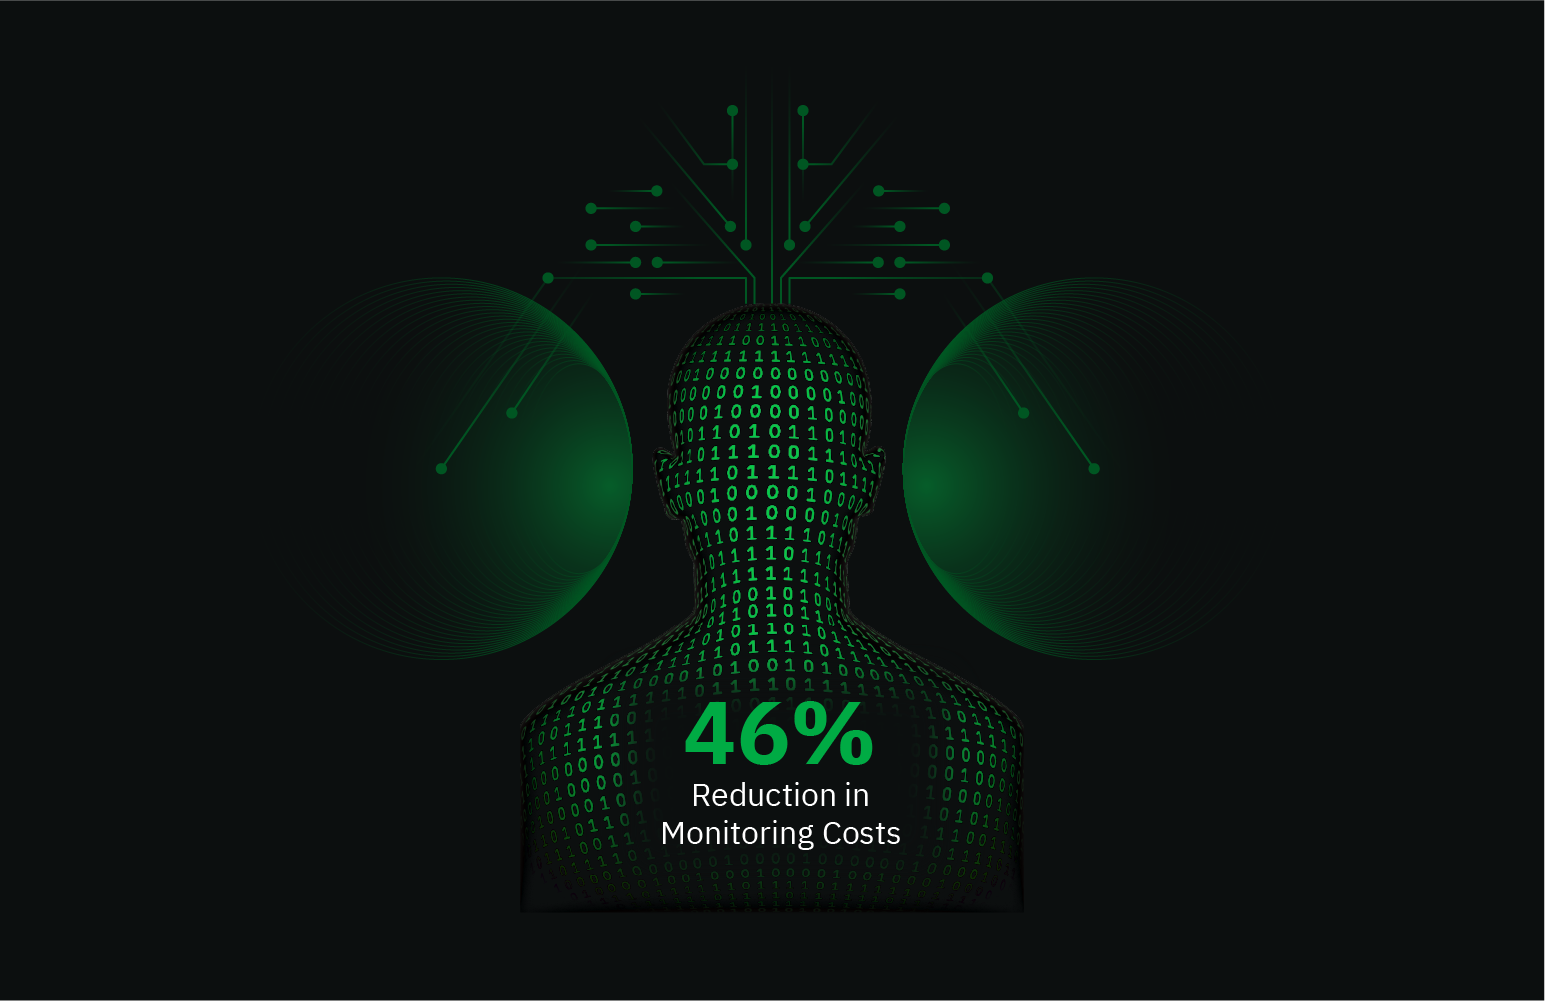
Published predictable per-node pricing with no hidden infrastructure costs. Achieve 90% cost reduction vs commercial platforms with complete budget predictability.

Zero Operational Burden
Self-maintaining architecture eliminates the BYOC management overhead. No control plane lifecycle, no manual scaling, no Kubernetes expertise required.

Proven at Global Scale
80,000+ GitHub stars, 1.5M daily downloads, 100,000+ node deployments. Battle-tested reliability with active community support and independent validation.
Trusted by DevOps teams worldwide








































Platform Comparison
Netdata vs KloudFuse
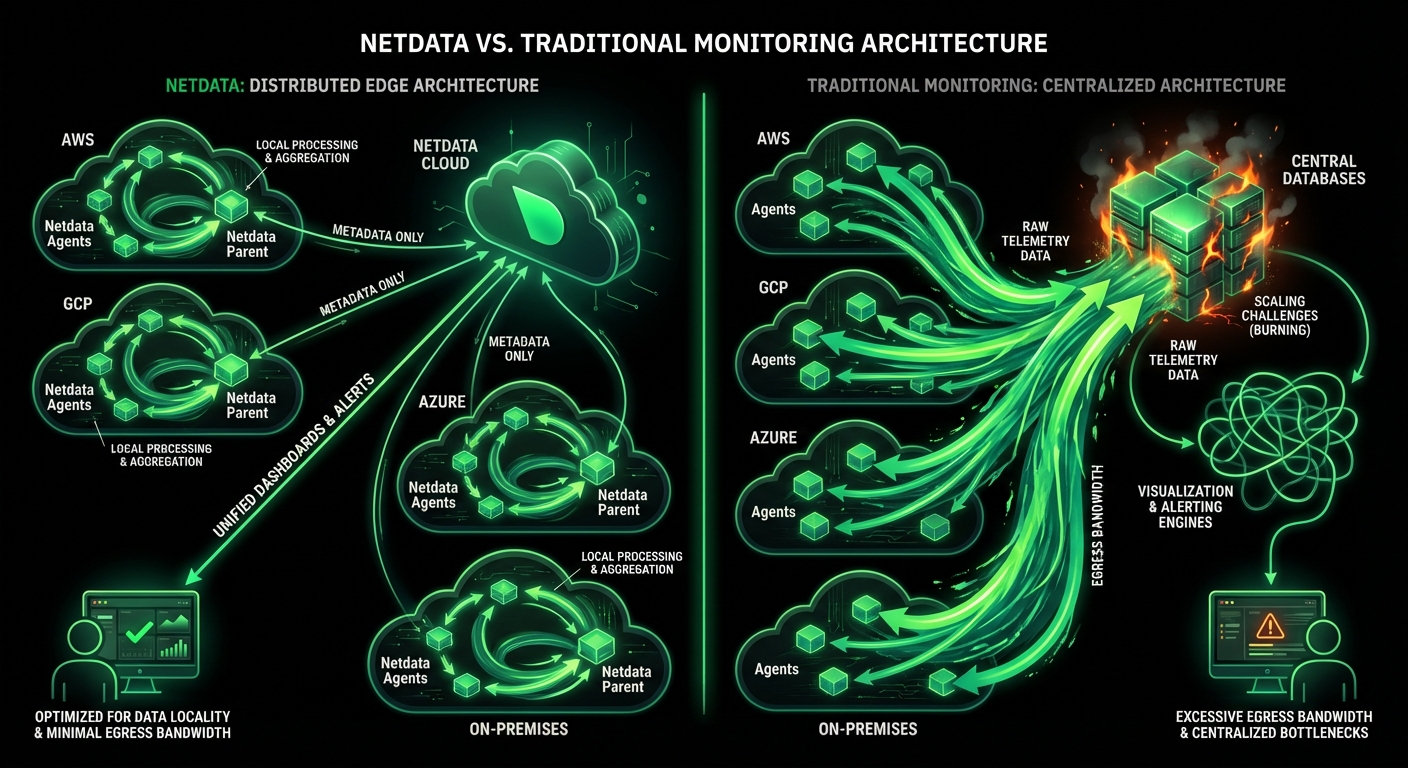
See how Netdata’s distributed edge architecture delivers superior performance, simplicity, and economics compared to KloudFuse’s centralized BYOC model.
Feature
Netdata
KloudFuse
Setup Time
✅ One command
One-line install, instant visibility
⚠️ Days to weeks
Kubernetes cluster, Helm configuration required
Data Granularity
✅ 1 second
Captures 100% of transient issues
⚠️ 15-60 seconds
Misses short-lived anomalies
Query Performance
✅ Milliseconds
Distributed edge queries
⚠️ Seconds to minutes
Centralized data lake bottleneck
Pricing Model
✅ Published rates
Predictable per-node pricing, transparent discounts
⚠️ Quote-based
No published rates, unknown TCO
Infrastructure Required
✅ Any system
Linux, Windows, FreeBSD, macOS
⚠️ Kubernetes mandatory
8-core, 32-64GB minimum
Operational Overhead
✅ Zero maintenance
Self-maintaining, no management
⚠️ High burden
BYOC self-managed control plane
Scalability
✅ Dynamic, linear
1 to 100,000+ nodes automatically
⚠️ Pre-configured static
No dynamic scaling, manual decisions
ML Anomaly Detection
✅ 18 models per metric
99% false positive reduction
⚠️ 3-4 algorithms
Manual sensitivity tuning required
Query Language
✅ None required
Point-and-click NIDL framework
⚠️ 6 languages
FuseQL, PromQL, LogQL, TraceQL, SQL, GraphQL
Market Validation
✅ 80,000+ stars
1.5M daily downloads, proven scale
⚠️ Limited presence
Emerging platform, smaller community
Agent Overhead
✅ <5% CPU, 150 MB RAM (standalone, ML enabled)
Independently validated efficiency
⚠️ Not documented
No published overhead metrics
Platform Maturity
✅ 10+ years
Battle-tested at massive scale
⚠️ 2 years
Newer platform, evolving features
Experience the Netdata Advantage
Deploy with One Command, Not Weeks
Dashboards as soon as data is collected
Start One-Line Install

Capture Every Anomaly in Real-Time
Per-second resolution
See Real-Time Monitoring

Eliminate Operational Complexity
Zero operational burden
Learn About Edge Architecture

Budget with Complete Transparency
90% cost reduction
View Transparent Pricing

Feature Comparison
Monitoring Capabilities Side by Side
Comprehensive feature analysis reveals Netdata’s superior coverage across infrastructure monitoring, AI/ML intelligence, and operational simplicity.
Capability
Netdata
KloudFuse
Infrastructure Monitoring
✅ Ideal
Complete OS, hardware, network coverage
✅ Good
Kubernetes-focused, cloud services
Container Monitoring
✅ Ideal
Native cgroups, Docker, K8s, lifecycle tracking
✅ Good
Docker, containerd, Kubernetes native
Database Monitoring
✅ Ideal
Auto-discovery, per-second queries
✅ Good
PostgreSQL, MySQL, MongoDB, Redis
Log Management
✅ Ideal
OS logs in place + any source via OpenTelemetry, 90% cost reduction
✅ Good
FuseQL, patent-pending fingerprinting
Distributed Tracing
✅ OpenTelemetry traces over OTLP, stored and indexed on your own agents, explored in the Traces tab (any-attribute filters, query-time RED analysis, heatmap, waterfall)
✅ Good
TraceQL, service maps, span analysis
Anomaly Detection
✅ Ideal
18 models, 99% FP reduction, zero-config
✅ Good
Prophet, SARIMA, manual tuning
Root Cause Analysis
✅ Ideal
Automated Anomaly Advisor, blast radius
✅ Good
K-Lens, manual interpretation
AI Conversations/Natural Language
✅ Ideal
MCP (Cloud + Agent), Claude, ChatGPT, Gemini
❌ Not Available
No AI chat capability
Synthetic Monitoring
✅ Advanced
Playwright journeys, Lighthouse audits, HTTP, TCP, DNS checks, Nagios plugins
❌ Not Available
No synthetic checks
Real User Monitoring
✅ Advanced
Browser RUM: Core Web Vitals p50/p75/p95, sessions, grouped JavaScript errors, alerts, W3C trace propagation
✅ Good
Web, Flutter, React Native
Continuous Profiling
Traces instead
Request-level analysis through OpenTelemetry traces and query-time RED
✅ Good
CPU, memory, disk I/O profiling
Auto-Discovery
✅ Ideal
800+ integrations, zero-config
⚠️ Basic
Available but requires configuration
Netdata's Architectural Advantages
Distributed Processing at Scale
Netdata's edge-native architecture processes data where it's generated, eliminating central bottlenecks and enabling linear scalability. Each Agent is a complete monitoring system with collection, storage, ML, and alerting.
Proven at 100,000+ nodes
Learn About Edge Architecture


Use Case Analysis
Netdata vs KloudFuse Use Cases
Evaluate which platform best serves your specific monitoring requirements across common operational scenarios.
Use Case
Netdata
KloudFuse
Real-Time Infrastructure Monitoring
✅ Ideal
Per-second, sub-2s latency, 100% sampling
⚠️ Limited
15-60s sampling, misses transient issues
Live Troubleshooting
✅ Ideal
Console replacement, SSH-free debugging
⚠️ Basic
Query latency during incidents
Capacity Planning
✅ Advanced
AI Investigations, Prophet forecasting
✅ Good
Prophet, Holt Winters algorithms
Cost Optimization
✅ Ideal
90% reduction, transparent pricing
⚠️ Limited
Quote-based, unknown TCO
Kubernetes Monitoring
✅ Ideal
Native support, auto-discovery
✅ Good
K8s-focused, HPA autoscaling
Application Performance Monitoring
✅ OpenTelemetry APM
Traces with query-time RED, RUM and synthetic journeys on your agents
✅ Good
TraceQL, service maps, APM
Data Sovereignty Requirements
✅ Ideal
All data on-premises, zero egress
✅ Good
VPC deployment, BYOC model
Lean Team Operations
✅ Ideal
Zero maintenance, auto-scaling
⚠️ Limited
High operational overhead
Multi-Cloud Environments
✅ Advanced
AWS and Azure via native APIs; Agents on any cloud, incl. GCP and OCI
✅ Good
Multi-cloud support, integrations
Rapid Deployment Scenarios
✅ Ideal
One-line install, zero prerequisites
⚠️ Limited
Days/weeks, K8s expertise required
High-Cardinality Workloads
✅ Ideal
No per-metric charges, no cost impact
⚠️ Limited
Performance degradation, cost explosion
Budget-Constrained Teams
✅ Ideal
Predictable per-node pricing
⚠️ Limited
Unknown TCO, infrastructure costs

October 5, 2026
Distributed Tracing In Netdata: OpenTelemetry Traces
Netdata now ingests OpenTelemetry traces over OTLP on the same Agent that collects your metrics and logs. Spans are stored and indexed on your own infrastructure and explored in the new Traces tab in Netdata Cloud.

October 3, 2026
Who Built This Dashboard, and Are They Still Here?
Your server monitoring dashboard shouldn't be a DIY project. Netdata charts every metric automatically — no query languages, no dashboards to build, ever.
September 8, 2026
Infrastructure Knowledge For AI Root Cause Analysis
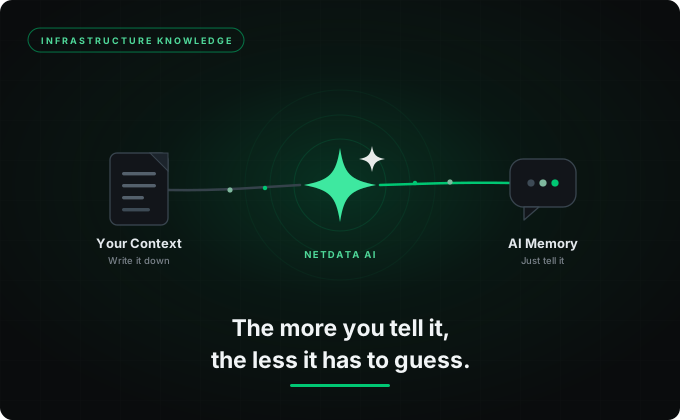
Netdata AI now learns your infrastructure the way a new SRE would: a shared context document your team writes, and a memory layer built from conversations that gets more accurate every time you use it.
Frequently Asked Questions
Understanding the KloudFuse Experience
Common challenges teams face with KloudFuse’s BYOC architecture based on the deployment model requirements.
Days of Kubernetes Configuration
Helm charts, cluster sizing, infrastructure pre-configuration
Delayed Time to Value
Weeks spent on setup instead of monitoring production
15-60 Second Sampling Intervals
Averaged metrics miss transient issues
Blind Spots During Incidents
Critical anomalies invisible in aggregated data
Quote-Based Pricing Opacity
No published rates, unknown total cost of ownership
Budget Uncertainty
Finance teams unable to predict monitoring costs
BYOC Self-Managed Infrastructure
Control plane lifecycle, manual scaling, Kubernetes expertise
High Operational Overhead
Engineering time diverted from core business goals
Pre-Configured Cluster Requirements
Must determine cluster size before deployment
Inflexible Infrastructure
Cannot easily adapt to changing workload demands
Newer Platform with Smaller Community
Limited market validation compared to established solutions
Adoption Risk
Less community support and proven scale