
Try live | GitHub repo | Open in StackBlitz
An example demonstrating deck.gl integration for geospatial data visualization through @sqlrooms/deck. It renders ~48k Overture Maps building footprints for the Zurich city centre (currently 48,451 rows), extruded in 3D and colored by height using a sequential color scale.
Features:
- Query a Hugging Face-hosted Parquet file with DuckDB WASM via
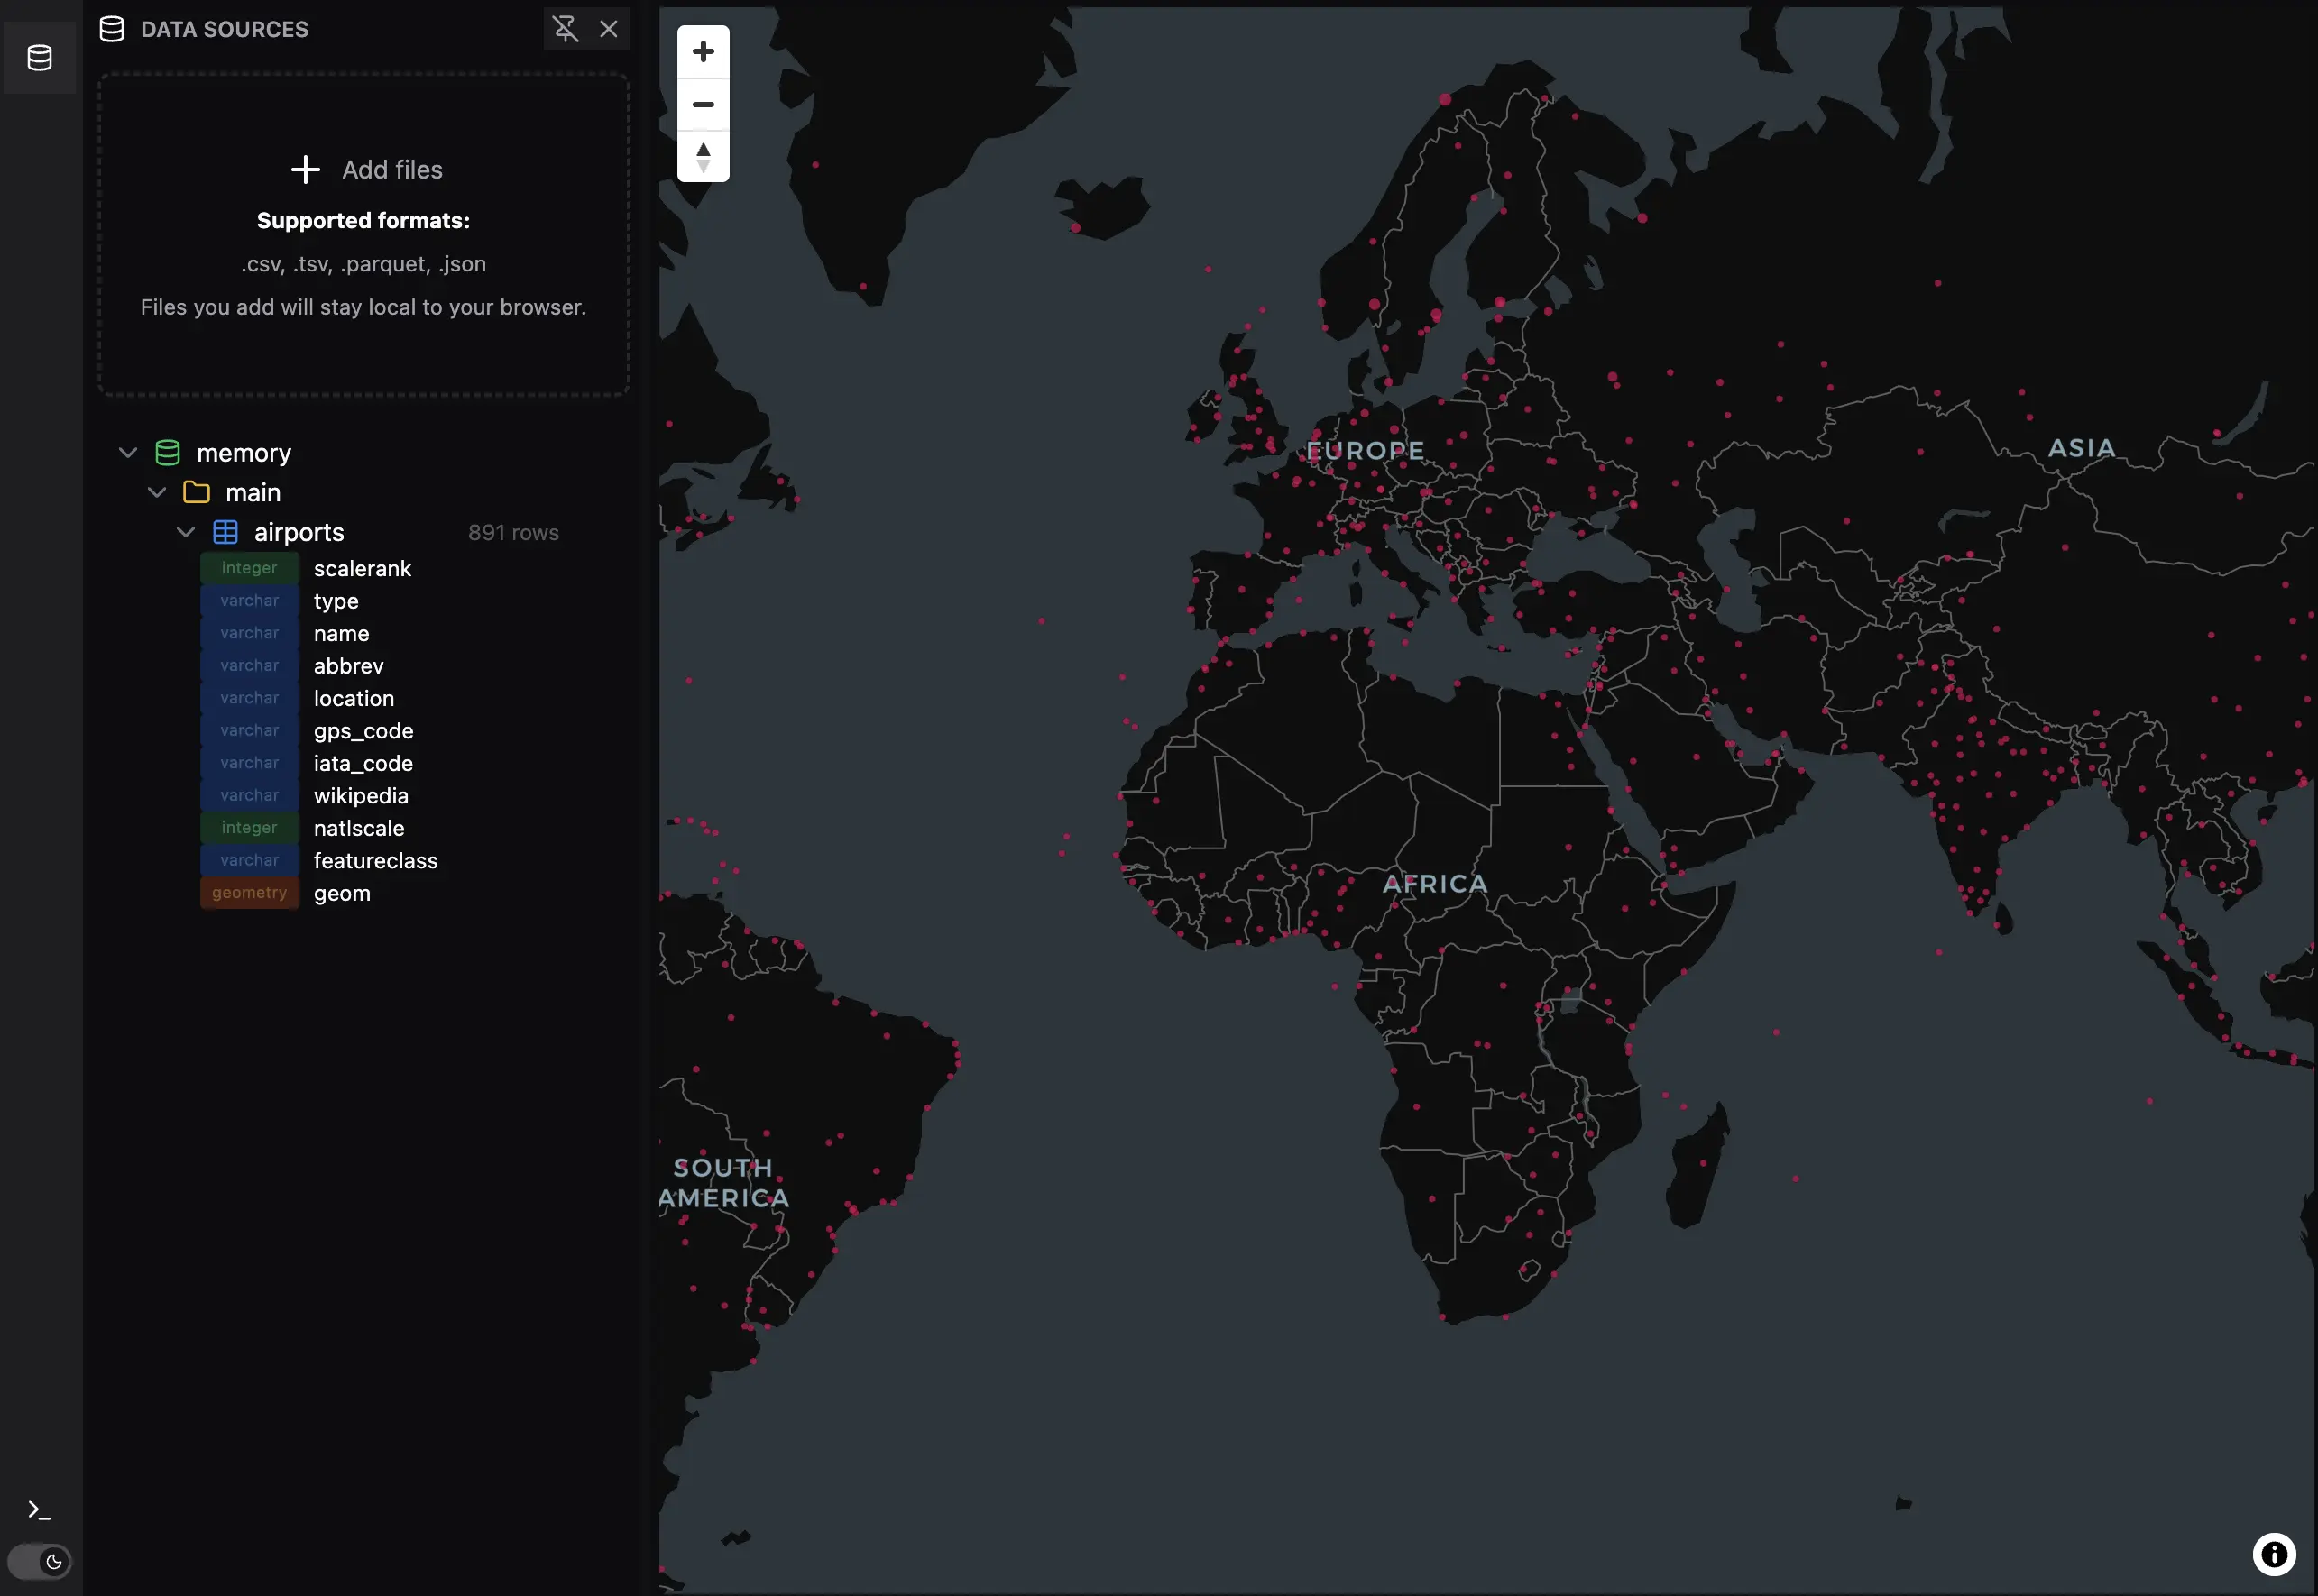
httpfs - Load airports data file into DuckDB
- Define a serializable deck.gl JSON layer spec separately from the data
- Bind multiple named DuckDB-backed datasets into one map
- Visualize airport locations on an interactive map with GeoArrow-backed point layers
- WKB geometry decoded directly to GeoArrow — no GeoJSON intermediate
- 3D extruded
GeoArrowPolygonLayerwith height-based color scale - Legend title includes units (
Height (m)) with domain matching loaded data min/max - Tooltip with building name, class, and height
- Toggle between airports and Zurich buildings in the same map UI
To create a new project from the deckgl example run this:
npx giget gh:sqlrooms/examples/deckgl my-new-app/pnpm install
pnpm build
pnpm dev deckgl-exampleThe Zurich buildings dataset is hosted at sqlrooms/buildings on Hugging Face. It was generated from Overture Maps using DuckDB. Run in the DuckDB CLI or any SQL client with httpfs and spatial extensions:
INSTALL httpfs; LOAD httpfs;
INSTALL spatial; LOAD spatial;

SET s3_region = 'us-west-2';

COPY (
  SELECT
    names.primary AS name,
    class,
    COALESCE(height, num_floors * 3.2, 5) AS height,
    ST_AsWKB(geometry) AS geometry
  FROM read_parquet(
    's3://overturemaps-us-west-2/release/2026-04-15.0/theme=buildings/type=building/*.zstd.parquet',
    hive_partitioning = 1
  )
  WHERE bbox.xmin BETWEEN 8.47 AND 8.59
    AND bbox.ymin BETWEEN 47.335 AND 47.415
  LIMIT 50000
) TO 'zurich_buildings.parquet';
Adjust the bounding box or the release date to target a different area or a newer Overture snapshot, then upload the resulting Parquet file to the Hugging Face dataset.