Bug summary
Some image comparison tests in a project of mine are failing when running matplotlib 3.50b1
Code for reproduction
import matplotlib.pyplot as plt
from matplotlib.collections import LineCollection
from matplotlib.colors import TwoSlopeNorm
import numpy as np

x = np.linspace(0, 10, 100)
y = np.sin(x)
# generate some data within some interval that doesn't have 0 its central value
z = y + 0.5

points = np.array([x, y]).T.reshape(-1, 1, 2)
segments = np.concatenate([points[:-1], points[1:]], axis=1)

# adapted from
# https://matplotlib.org/stable/gallery/lines_bars_and_markers/multicolored_line.html
lc = LineCollection(segments, norm=TwoSlopeNorm(0), cmap="RdYlBu")
lc.set_array(z)

fig, ax = plt.subplots()

# this line is just to compensate for the fact that the limits are not
# automatically handled when the plot just contains a single LineCollection artist
ax.set(xlim=(0, 10), ylim=(-1, 1))

line = ax.add_collection(lc)
fig.colorbar(line)
Actual outcome
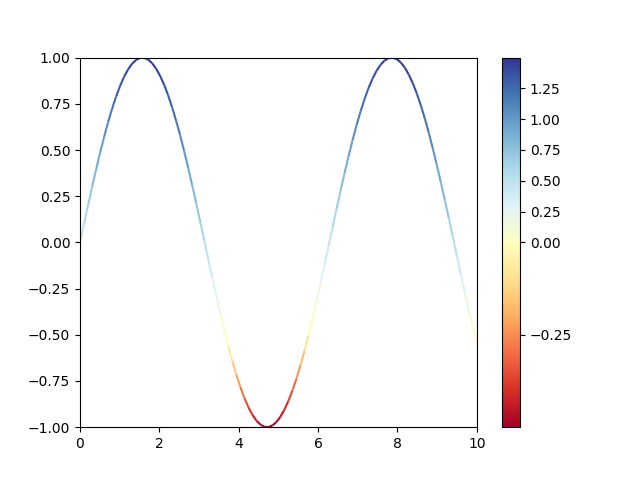
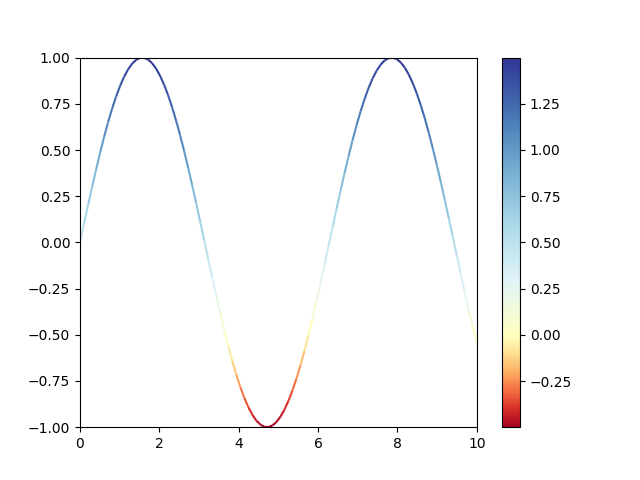
Expected outcome
This is the results with matplotlib 3.4.3
Operating system
OS/X
Matplotlib Version
3.5.0b1
Matplotlib Backend
MacOSX
Python version
3.9.6
Jupyter version
N/A
Other libraries
No response
Installation
pip
Conda channel
No response

Bug summary
Some image comparison tests in a project of mine are failing when running matplotlib 3.50b1
Code for reproduction
Actual outcome
Expected outcome
This is the results with matplotlib 3.4.3

Operating system
OS/X
Matplotlib Version
3.5.0b1
Matplotlib Backend
MacOSX
Python version
3.9.6
Jupyter version
N/A
Other libraries
No response
Installation
pip
Conda channel
No response