GoogleMapPlotter.circle
GoogleMapPlotter.circle(lat, lng, radius, color=None, c=None, alpha=0.5, **kwargs)
Plot a circle.
-
Parameters
-
lats
float– Latitude of the center of the circle. -
lngs
float– Longitude of the center of the circle. -
radius
int– Radius of the circle, in meters.
-
-
Optional Parameters
-
edge_alpha/ea
float– Opacity of the circle’s edge, ranging from 0 to 1. Defaults to 1.0. -
edge_width/ew
int– Width of the circle’s edge, in pixels. Defaults to 1. -
face_alpha/alpha
float– Opacity of the circle’s face, ranging from 0 to 1. Defaults to 0.5. -
color/c/face_color/fc
str– Color of the circle’s face. Can be hex (‘#00FFFF’), named (‘cyan’), or matplotlib-like (‘c’). Defaults to black. -
color/c/edge_color/ec
str– Color of the circle’s edge. Can be hex (‘#00FFFF’), named (‘cyan’), or matplotlib-like (‘c’). Defaults to black.
-
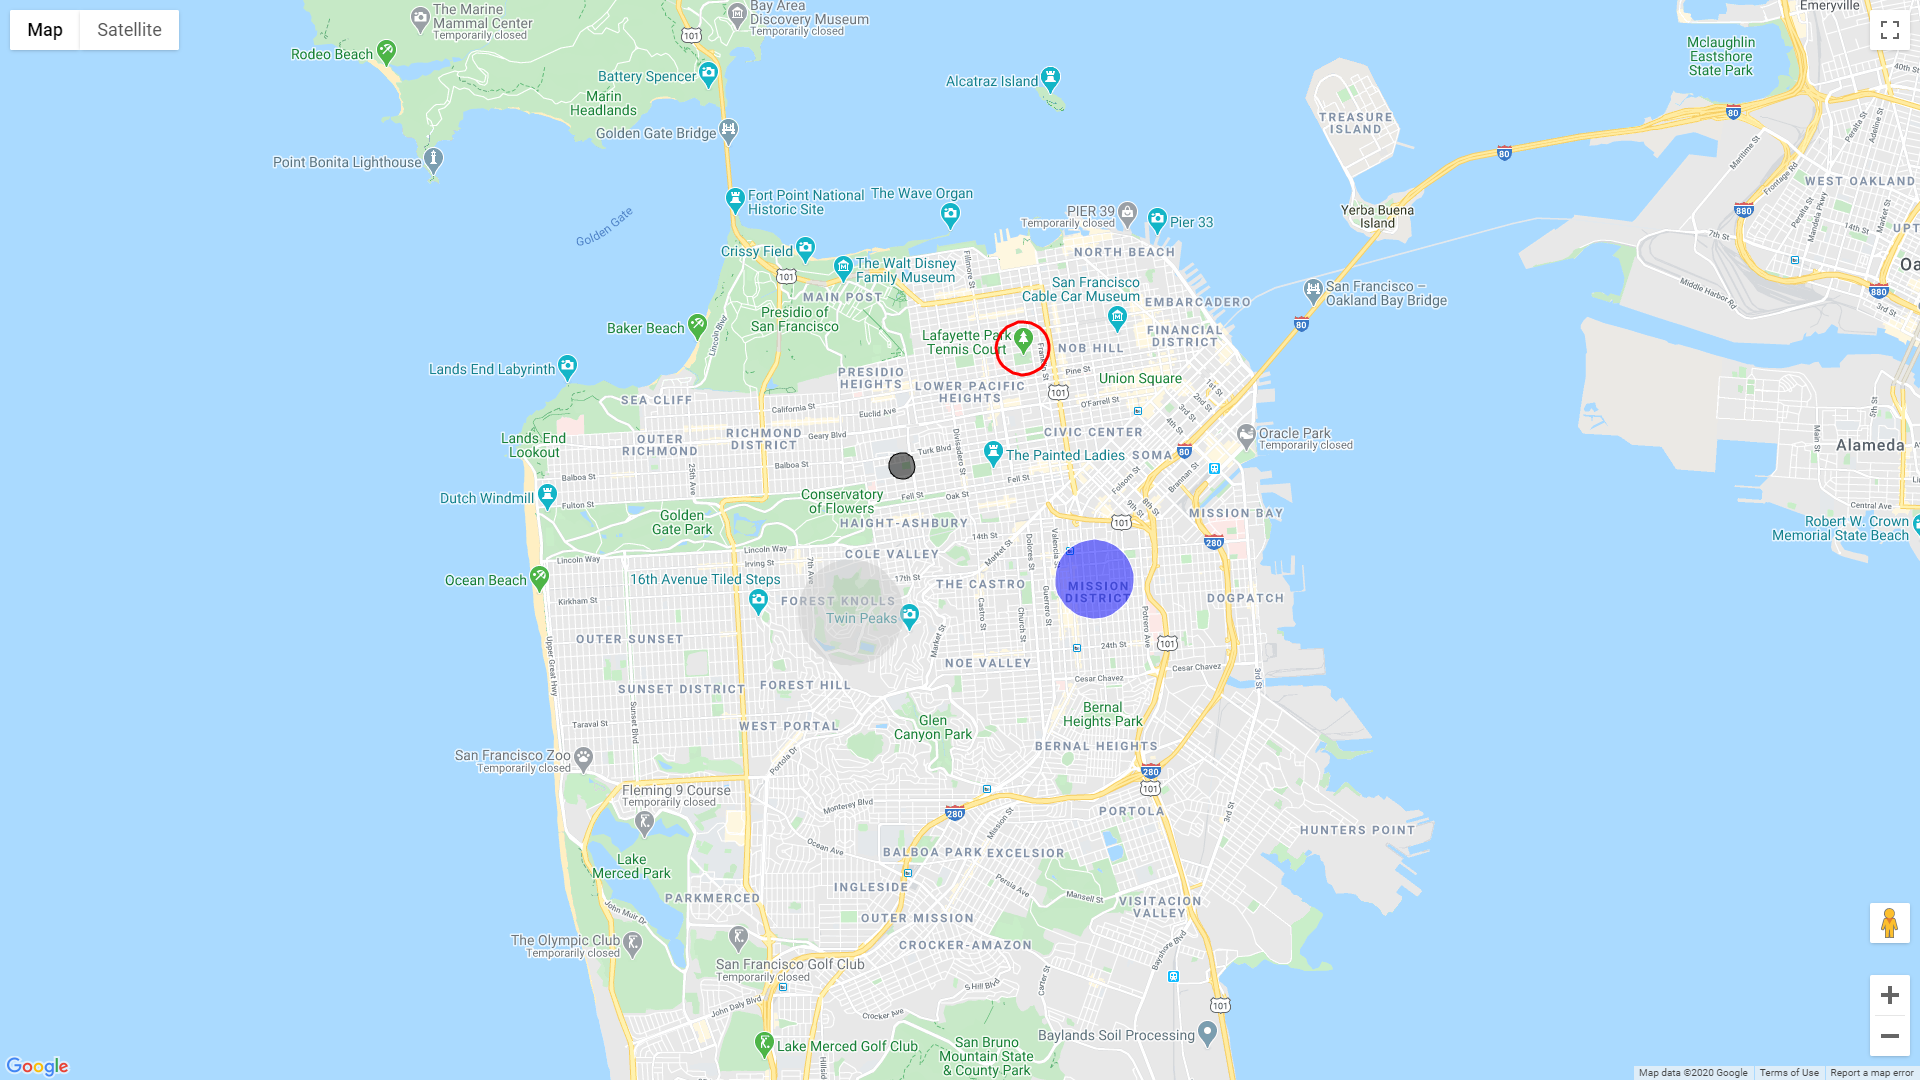
Usage:
import gmplot
apikey = '' # (your API key here)
gmap = gmplot.GoogleMapPlotter(37.766956, -122.438481, 13, apikey=apikey)

gmap.circle(37.776956, -122.448481, 200)
gmap.circle(37.792915, -122.427716, 400, face_alpha=0, ew=3, color='red')
gmap.circle(37.761601, -122.415438, 600, edge_color='#ffffff', fc='b')
gmap.circle(37.757069, -122.457245, 800, edge_alpha=0, color='#cccccc')

gmap.draw('map.html')