
BarDataLabels Class
Specifies default data label settings for bar series points.
Namespace: DevExpress.Docs.Office
Assembly: DevExpress.Docs.Core.v26.1.dll
Declaration
Related API Members
The following members return BarDataLabels objects:
Remarks
For additional information about data labels, refer to the following help topic: Data Labels.
Example
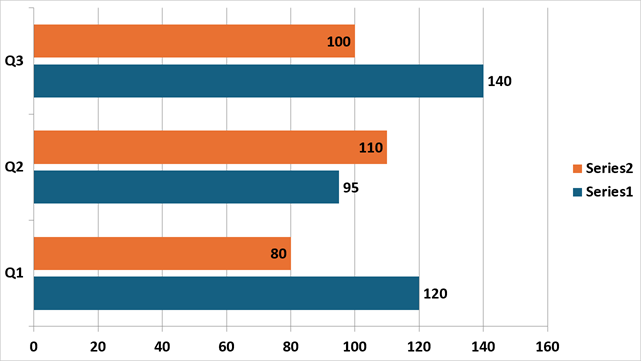
The following code snippet adds two bar series to a presentation chart and customizes the corresponding view:
using DevExpress.Docs.Office;
using DevExpress.Docs.Presentation;
using System.Drawing;

namespace PresentationApiSample;

public class Program {
    public static async Task Main(string[] _) {

        // Create a presentation and add a blank slide.
        Presentation presentation = new Presentation();
        presentation.Slides.Clear();
        Slide slide = new Slide(SlideLayoutType.Blank);
        presentation.Slides.Add(slide);

        // Insert a chart that fills the slide.
        Chart chart = new Chart();
        chart.Width = presentation.SlideSize.Width;
        chart.Height = presentation.SlideSize.Height;
        slide.Shapes.Add(chart);

        // Set text properties common for all chart text elements.
        chart.TextProperties = new TextProperties { FontSize = 24, Bold = true };

        // Add the first bar series.
        BarSeries series1 = new BarSeries();
        series1.Arguments = new ChartStringData(new[] { "Q1", "Q2", "Q3" });
        series1.Values = new ChartNumericData(new double[] { 120, 95, 140 });
        chart.Series.Add(series1);

        // Configure data labels for the first series.
        series1.DataLabels.ShowValue = true;
        series1.DataLabels.LabelPosition = BarDataLabelPosition.OutsideEnd;

        // Add the second bar series.
        BarSeries series2 = new BarSeries();
        series2.Arguments = new ChartStringData(new[] { "Q1", "Q2", "Q3" });
        series2.Values = new ChartNumericData(new double[] { 80, 110, 100 });
        chart.Series.Add(series2);

        // Configure data labels for the second series.
        series2.DataLabels.ShowValue = true;
        series2.DataLabels.LabelPosition = BarDataLabelPosition.InsideEnd;

        // Access the bar chart view and customize its appearance.
        BarChartView view = (BarChartView)chart.Views[0];
        view.BarDirection = BarChartDirection.Bar;
        view.BarGrouping = BarChartGrouping.Clustered;
        view.GapWidth = 100;
        view.Overlap = -20;

        // Save the presentation to a file or export it.
        // ...
    }
}
Implements
Inheritance
Object
OfficeObject
DataLabelBase
DataLabels
BarDataLabels
See Also