A Plotly is a Python library that is used to design graphs, especially interactive graphs. It can plot various graphs and charts like histogram, barplot, boxplot, spreadplot, and many more. It is mainly used in data analysis as well as financial analysis. plotly is an interactive visualization library.
Carpet Contour Plot
A carpet contour plot is a graphical technique for representing a 3-dimensional surface by plotting constant z slices, called contours, on a 2-dimensional format. X and Y attributes are used to set the x and y coordinates. In case the value of x is missing then it will form a cheater plot. A and B attributes should be used to save the values of the parameter.
Syntax: plotly.graph_objects.Contourcarpet( a=None,b=None,xaxis=None, yaxis=None, z=None)
Parameters:
Example:
import plotly.graph_objects as go

fig = go.Figure(go.Carpet(
    a=[1, 2, 3, 4, 5, 6],
    b=[6, 5, 4, 3, 2, 1],
    y=[1, 2, 3, 4, 5, 6],

    aaxis=dict(
        tickprefix='F = ',
        ticksuffix='N',
        smoothing=0.2,
        minorgridcount=10,
    ),
    baxis=dict(
        tickprefix='P = ',
        ticksuffix='pa',
        smoothing=0.4,
        minorgridcount=9,
    )
))

fig.show()
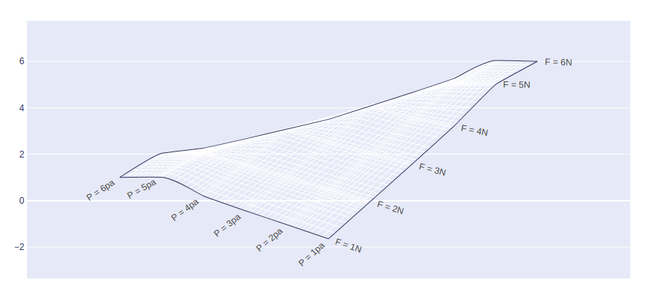
Output:
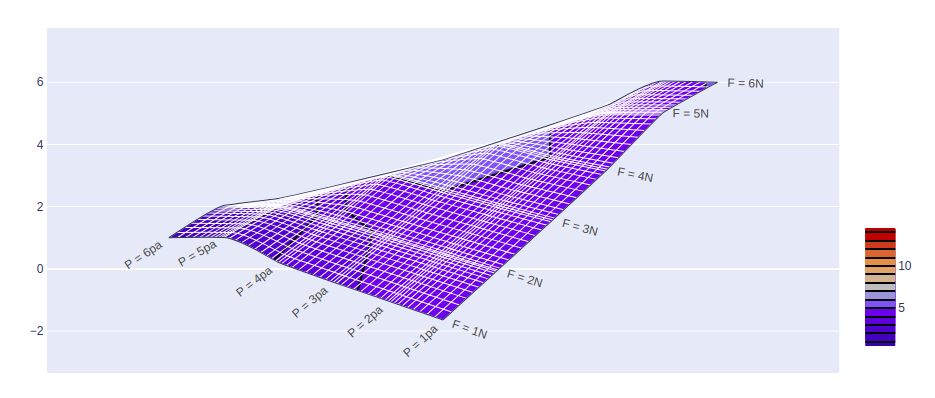
Adding Contours
In plotly, contours can be added by using the go.Contourcarpet() method of graph_object class. Contours should be added in such a way that the graph body should be in the proper segment.
Example:
import plotly.graph_objects as go

fig = go.Figure()

fig.add_trace(go.Contourcarpet(
    a = [1, 2, 3, 4, 5, 6],
    b = [6, 5, 4, 3, 2, 1],
    z = [1, 1.96, 5, 6.1028, 4, 5.0625],
    autocontour = False,
    contours = dict(
        start = 1,
        end = 14,
        size = 1
    ),
    line = dict(
        width = 2,
        smoothing = 0
    ),
    colorbar = dict(
       len = 0.4,
        y = 0.25
    )
))


fig.add_trace(go.Carpet(
    a=[1, 2, 3, 4, 5, 6],
    b=[6, 5, 4, 3, 2, 1],
    y=[1, 2, 3, 4, 5, 6],

    aaxis=dict(
        tickprefix='F = ',
        ticksuffix='N',
        smoothing=0.2,
        minorgridcount=10,
    ),
    baxis=dict(
        tickprefix='P = ',
        ticksuffix='pa',
        smoothing=0.4,
        minorgridcount=9,
    )
))

fig.show()
Output: