Bug report
Bug summary
A simple 3D scatter plot is not working on jupyter notebook when %matplotlib notebook is enabled. However, it is working for %matplotlib inline
An extremely large, blank window appears that spans beyond the page.
Code for reproduction
%matplotlib notebook

import numpy as np
import matplotlib.pyplot as plt
from mpl_toolkits.mplot3d import Axes3D

A = np.random.random((100,3))
fig = plt.figure()
ax = Axes3D(fig)
ax.scatter(A[:,0], A[:,1], A[:,2])
plt.show()
Actual outcome
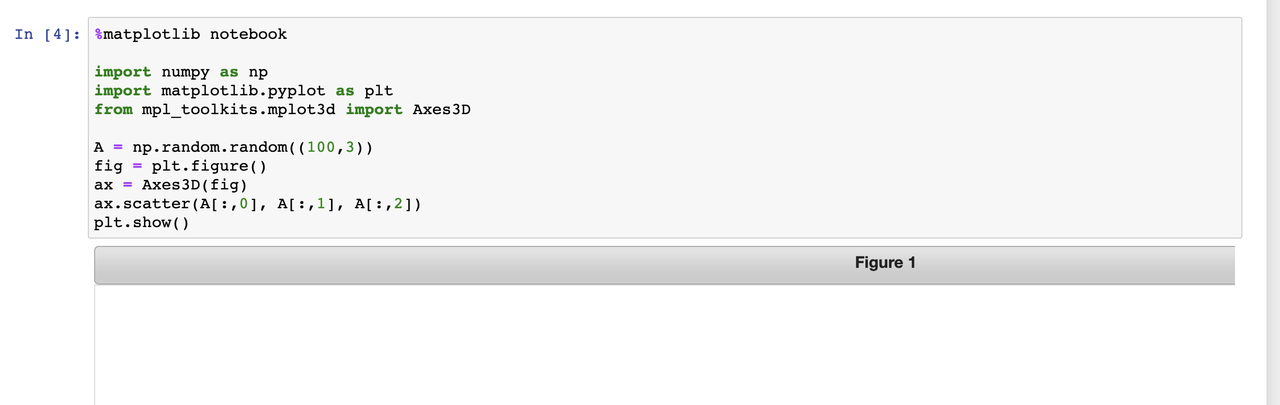
Expected outcome
Expecting a 3D scatter plot of A.
Matplotlib version
- Operating system: posix Darwin 19.6.0
- Matplotlib version: 3.3.0
- Matplotlib backend (
print(matplotlib.get_backend())): nbAgg
- Python version: 3.7.5
- Jupyter version (if applicable):
- jupyter core : 4.6.3
- jupyter-notebook : 6.0.3
- qtconsole : 4.7.5
- ipython : 7.16.1
- ipykernel : 5.3.4
- jupyter client : 6.1.6
- jupyter lab : not installed
- nbconvert : 5.6.1
- ipywidgets : 7.5.1
- nbformat : 5.0.7
- traitlets : 4.3.3
- Other libraries: numpy 1.19.1, scipy 1.5.2

Bug report
Bug summary
A simple 3D scatter plot is not working on jupyter notebook when
%matplotlib notebookis enabled. However, it is working for%matplotlib inlineAn extremely large, blank window appears that spans beyond the page.
Code for reproduction
Actual outcome

Expected outcome
Expecting a 3D scatter plot of
A.Matplotlib version
print(matplotlib.get_backend())): nbAgg