15. Kalman Filter, II
This notebook is a continuation of on KalmanFilter.NET [Bec18]. In this notebook, we focus on the Kalman Filter in one dimension.
15.1. Kalman Gain Equation
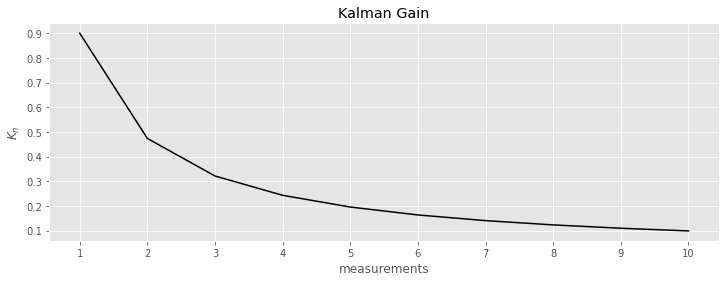
Before, the Kalman Gain \(K_n\) was held fixed or reduced over time by \(\dfrac{1}{n}\). Here \(K_n\) changes dynamically and depends on the meaurement device. To start, the Kalman Gain Equation \(K_n\) is defined as follows.
\(K_n = \dfrac{p_{n,n-1}}{p_{n,n-1} + r_n}\),
where
\(p_{n,n-1}\) is the estimation uncertainty (variance)
\(r_n\) is the measurement uncertainty (variance)
\(0 \leq K_n \leq 1\)
The State Update Equation can be rewritten as follows.
\(\begin{array} \hat{x}_{n,n} & = & \hat{x}_{n,n-1} + K_n (z_n - \hat{x}_{n,n-1}) \\ & = & \hat{x}_{n,n-1} + K_n z_n - K_n \hat{x}_{n,n-1} \\ & = & \hat{x}_{n,n-1} - K_n \hat{x}_{n,n-1} + K_n z_n \\ & = & (1 - K_n) \hat{x}_{n,n-1} + K_n z_n\end{array}\)
When the State Update Equation is written as above, then
\((1 - K_n)\) is the weight given to the estimate
\(K_n\) is the weight given to the measurement
The Covariance Update Equation is given as follows.
\(p_{n,n} = (1 - K_n) p_{n,n-1}\)
The Covariance Extrapolation Equations for the position \(x\) and velocity \(v\) are give as follows.
\(p^x_{n+1,n} = p^x_{n,n} + \Delta t^2 p^v_{n,n}\)
\(p^v_{n+1,n} = p^v_{n,n}\)
15.2. Building height, estimation and measurement uncertainties
[1]:
import pandas as pd

data = []

r = 25      # measurement uncertainty
x_ii = 60   # estimate
p_ii = 225  # estimate uncertainty

x_ji = x_ii # prediction
p_ji = p_ii # prediction uncertainty

Z = [48.54, 47.11, 55.01, 55.15, 49.89, 40.85, 46.72, 50.05, 51.27, 49.95]

for z_i in Z:
    K_i = p_ji / (p_ji + r)

    x_ii = x_ji + K_i * (z_i - x_ji)
    p_ii = (1 - K_i) * p_ji

    x_ji = x_ii
    p_ji = p_ii

    data.append({
        'K_i': K_i,
        'x_ii': x_ii,
        'p_ii': p_ii,
        'z_i': z_i,
        'r_i': r
    })

data = pd.DataFrame(data)
data.index = range(1, data.shape[0] + 1)
data
[1]:
[2]:
import matplotlib.pyplot as plt

plt.style.use('ggplot')

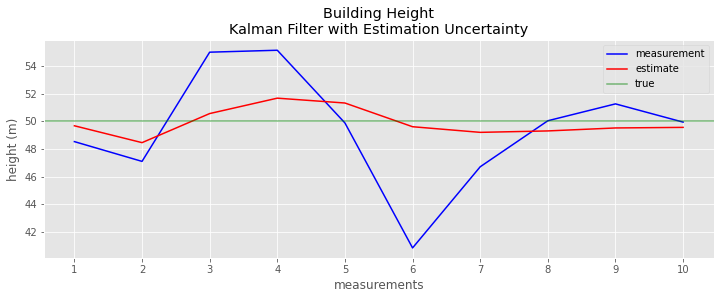
fig, ax = plt.subplots(figsize=(12, 4))

_ = data.z_i.plot(kind='line', ax=ax, color='blue', label='measurement')
_ = data.x_ii.plot(kind='line', ax=ax, color='red', label='estimate')
_ = ax.axhline(50, color='green', alpha=0.5, label='true')
_ = ax.set_xticks(range(1, data.shape[0] + 1))
_ = ax.set_xticklabels(data.index)
_ = ax.legend()
_ = ax.set_xlabel('measurements')
_ = ax.set_ylabel('height (m)')
_ = ax.set_title('Building Height\nKalman Filter with Estimation Uncertainty')
[3]:
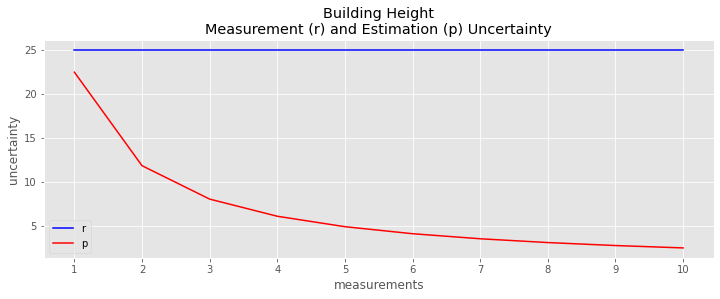
fig, ax = plt.subplots(figsize=(12, 4))

_ = data.r_i.plot(kind='line', ax=ax, color='blue', label='r')
_ = data.p_ii.plot(kind='line', ax=ax, color='red', label='p')
_ = ax.set_xticks(range(1, data.shape[0] + 1))
_ = ax.set_xticklabels(data.index)
_ = ax.legend()
_ = ax.set_xlabel('measurements')
_ = ax.set_ylabel('uncertainty')
_ = ax.set_title('Building Height\nMeasurement (r) and Estimation (p) Uncertainty')
[ ]:
fig, ax = plt.subplots(figsize=(12, 4))

_ = data.K_i.plot(kind='line', ax=ax, color='black')
_ = ax.set_xticks(range(1, data.shape[0] + 1))
_ = ax.set_xticklabels(data.index)
_ = ax.set_xlabel('measurements')
_ = ax.set_ylabel(r'$K_n$')
_ = ax.set_title('Kalman Gain')